
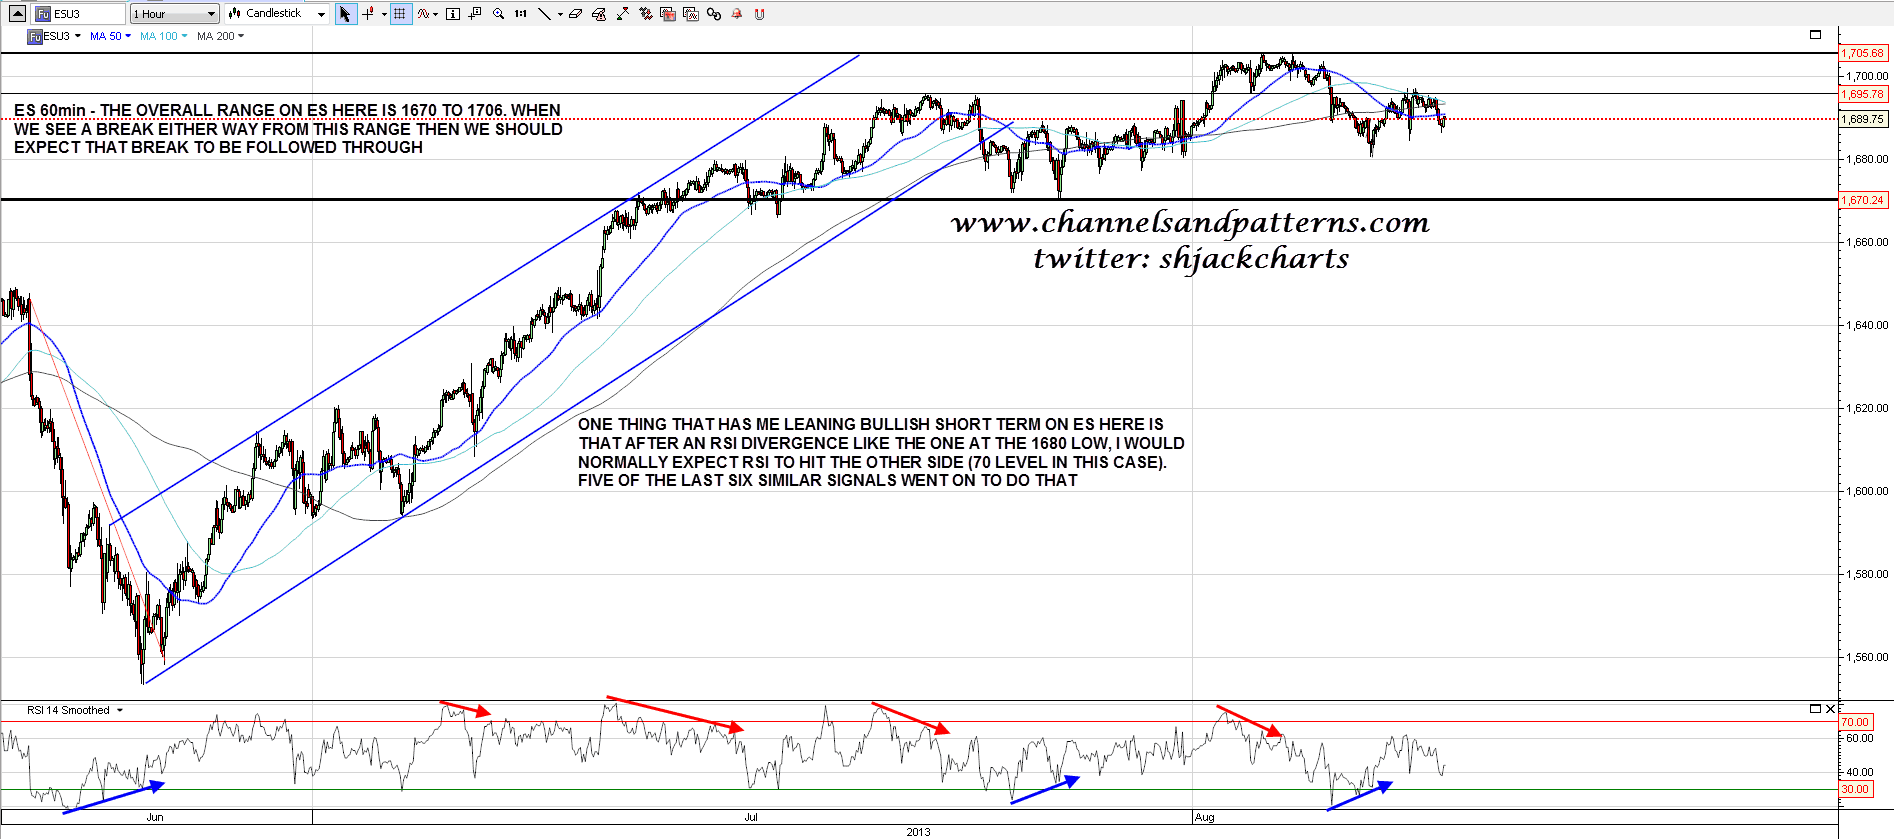
The opening setup I was looking at yesterday failed for the second day running. This is a very choppy market on ES, and not much seems to be working well apart from the buy and sell signals on the 1min and 5min RSIs. There isn’t an opening setup today on ES, and perhaps that’s just as well. What I would say from the ES 60min chart below is that there is unfinished business on the upside from the last 60min RSI reversal signal. Five of the last six of these signals were followed by the 60min RSI reaching the other side (70 in this case) and that hasn’t happened yet. What I would add to that is that the current trading range, roughly 1670 to 1706 is one where on a break either way we should see a follow-through move, that there is clearly strong resistance at 1697, and that ES is currently trading below the 50 hour MA, which is still in the 1690.5 area. ES 60min chart:
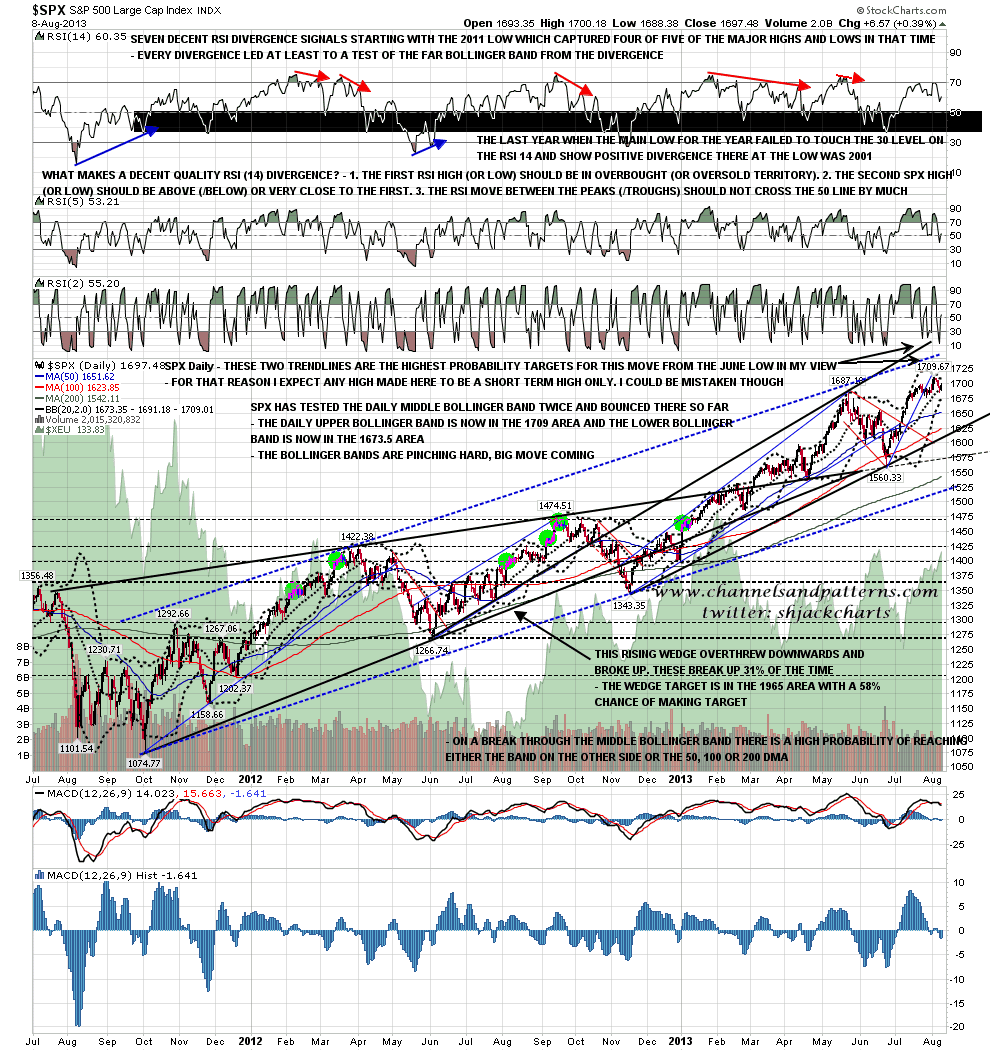
The low on SPX yesterday was another test of the daily middle bollinger band or the 20 DMA. If that continues to hold then the upper band is now at 1709, and if it breaks the lower band is now at 1673, so the upper and lower bollinger bands are in effect at the top and bottom of the current trading range. The bollinger bands are pinching together hard so pressure is building for a big move, most likely in the direction of any break from the current range. SPX daily chart:
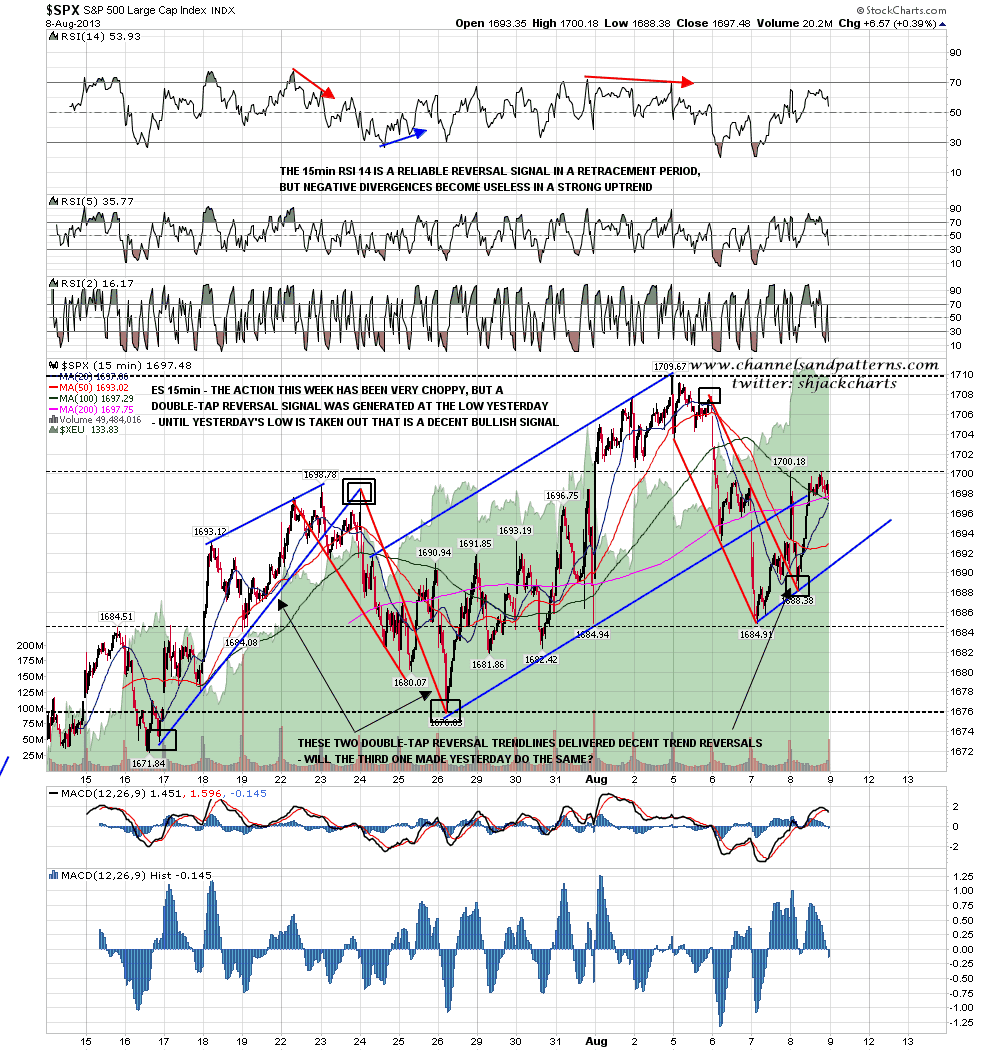
One thing to note from the SPX 15min chart is the Double-Tap Reversal (DTR) trendline that completed at the SPX low yesterday. There are two previous instances marked on this chart and both signaled larger reversals than we have seen from this one so far. Another reason I’m leaning bullish here short term, though if rising support from the 1684.91 low is broken today I’ll be switching that bias to neutral. Worth noting also from this chart is that within the overall trading range of 1676 to 1710 there is a smaller range between two significant S/R levels around 1685 and 1700. SPX 15min chart:
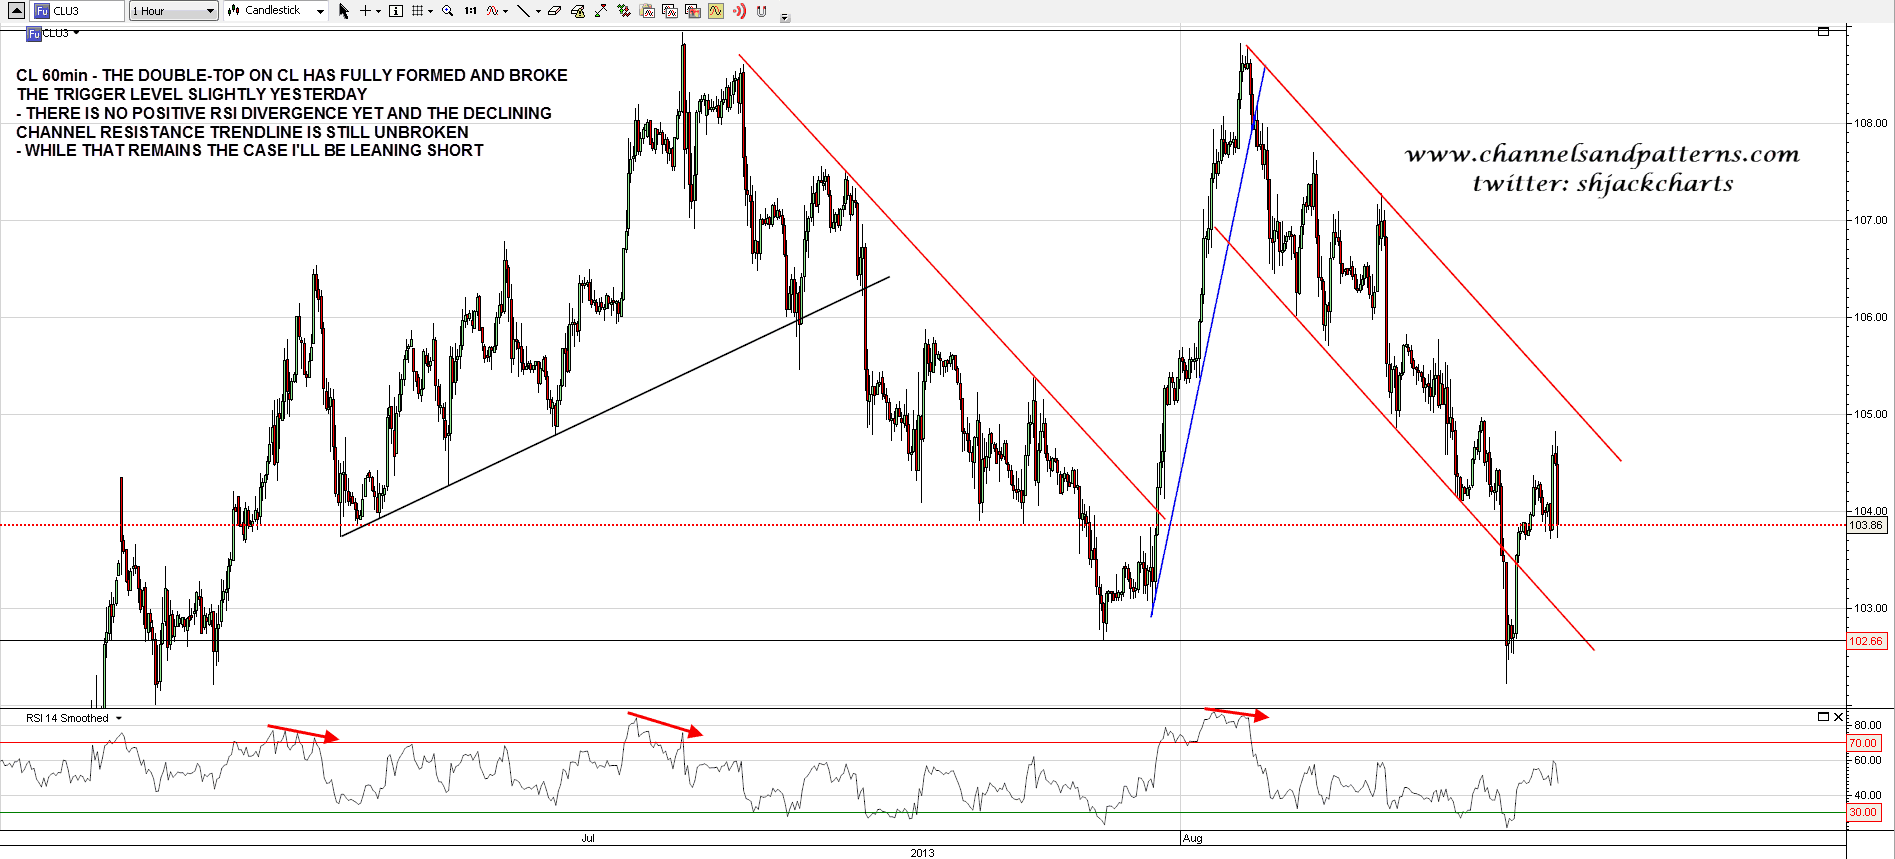
On other markets CL broke under the trigger level for the double-top there yesterday. Needless to say that is where these patterns fail when they fail, but as long as declining resistance from the last high is unbroken and there is no positive RSI divergence I’m leaning bearish on CL here. CL 60min chart:
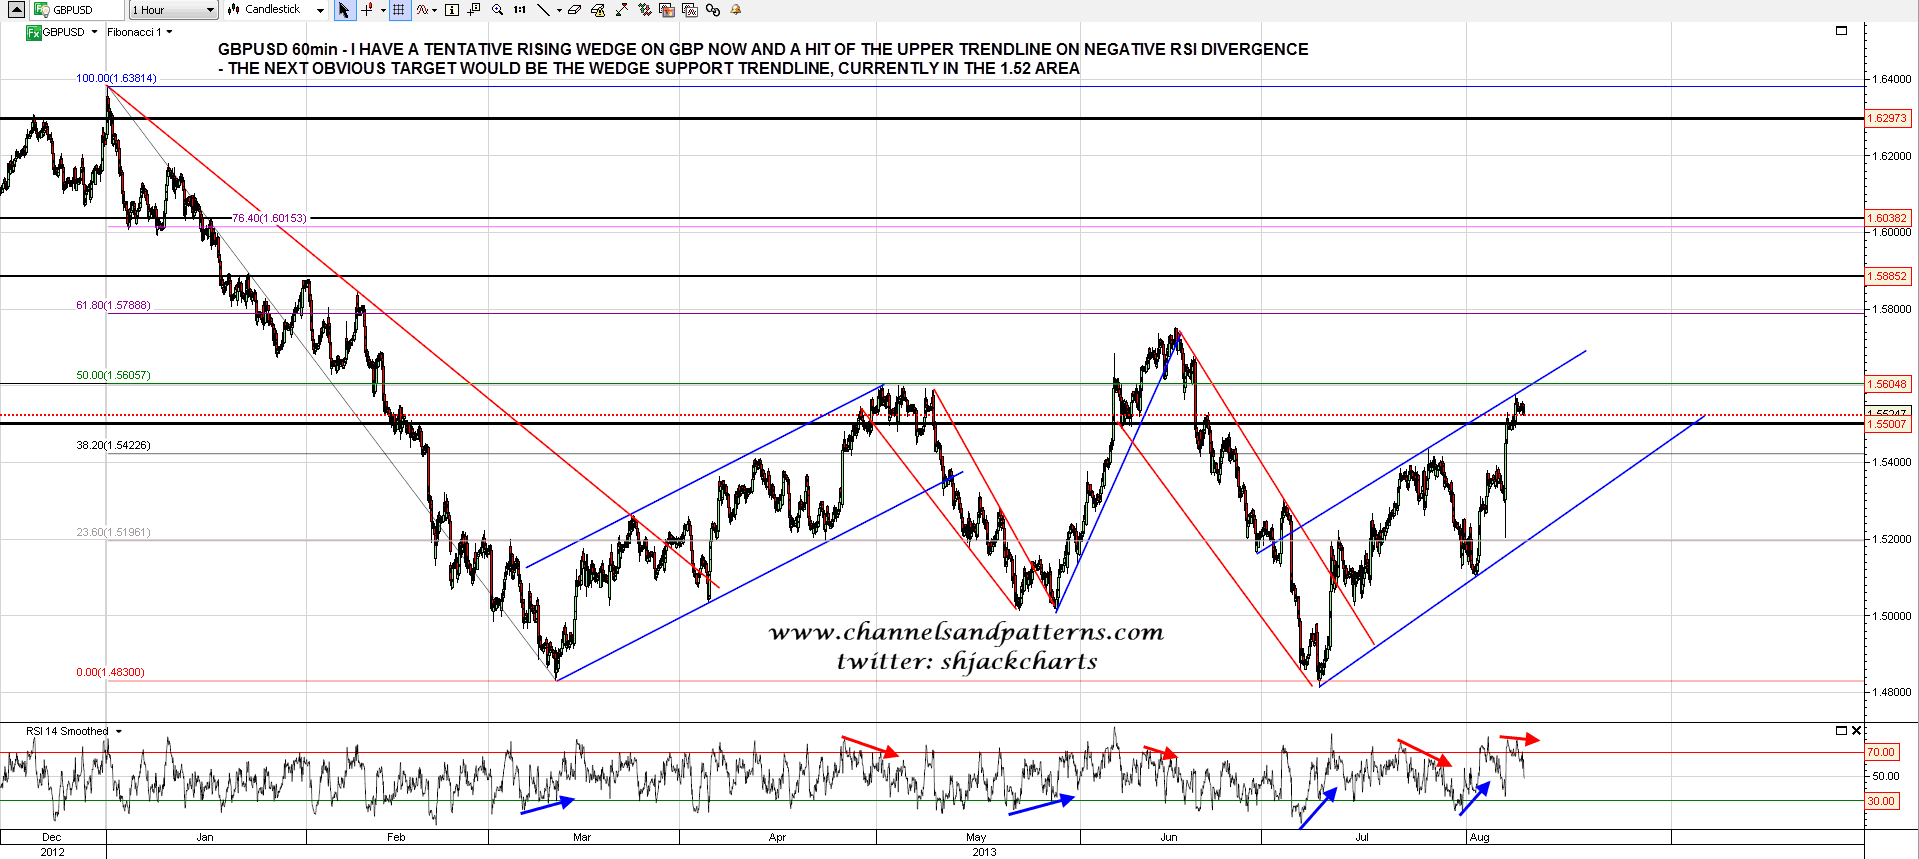
I’ve been watching USD with concern here, as it is threatening to break key support in the 80,5 area, but it seems that there may be good news for USD being signaled on GBPUSD. On GBPUSD I have a tentative rising wedge identified and that is reversing down with an obvious target at wedge support, currently in the 1.52 area. GBPUSD 60min:
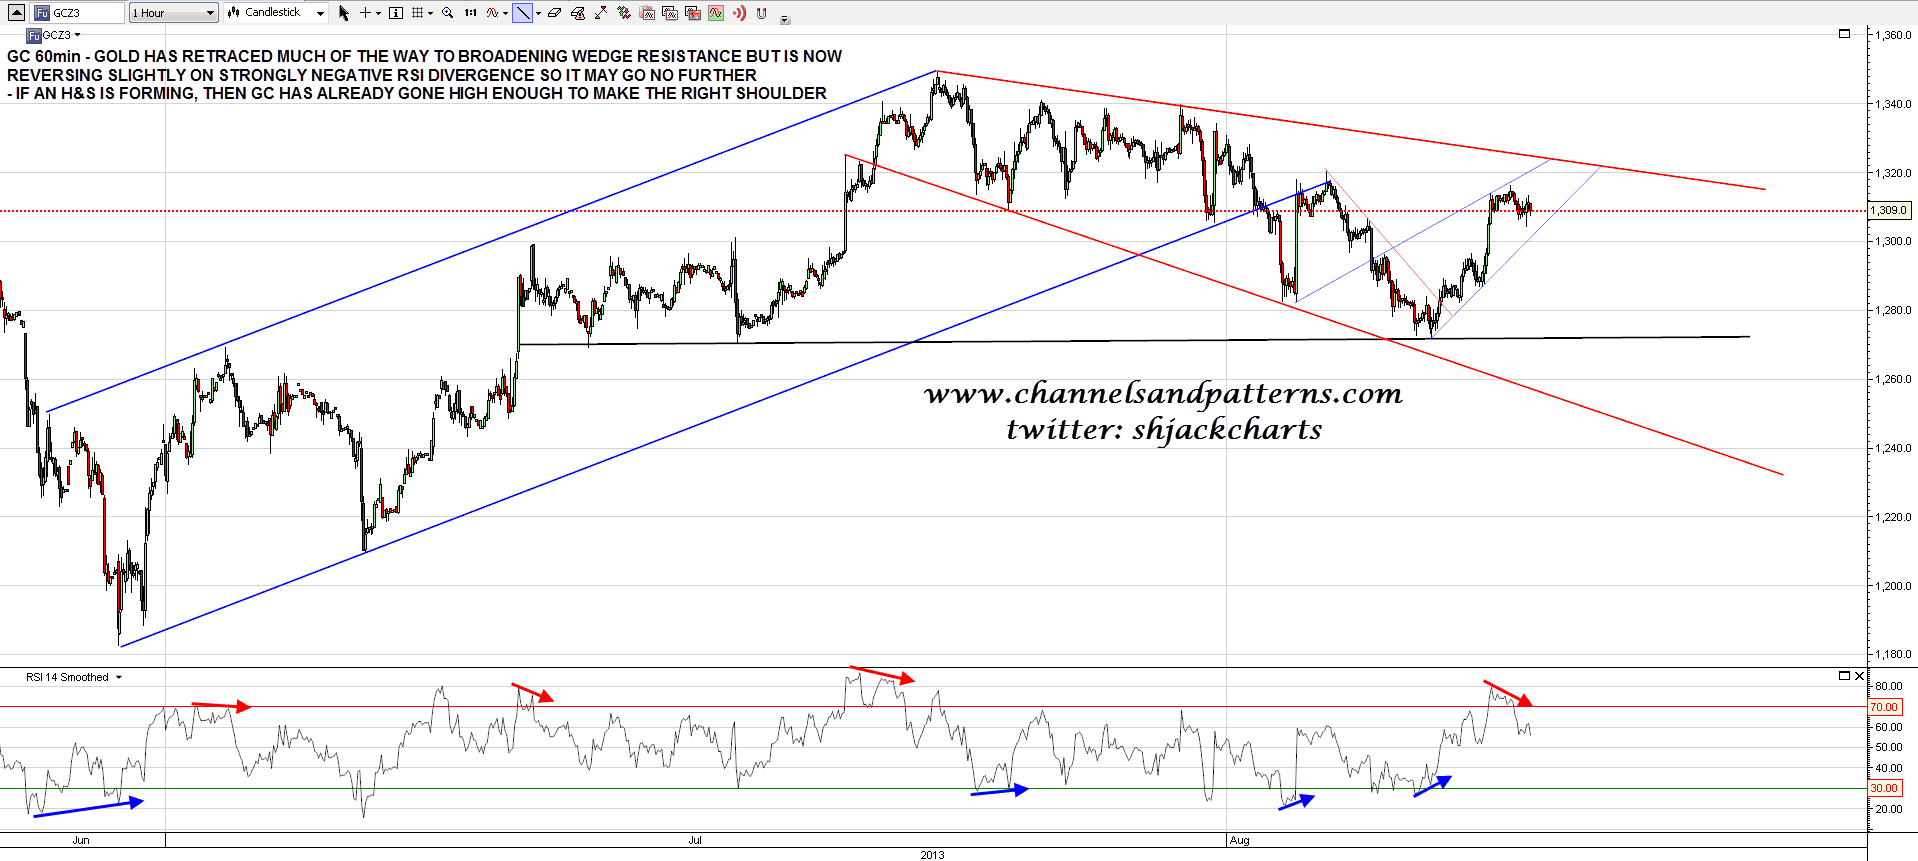
Lastly for today gold futures have been reversing back up as I expected towards broadening descending wedge resistance, but may not reach it as it is now reversing on strongly negative 60min RSI divergence. If an H&S is forming on GC, then the rally has already gone high enough for the right shoulder, and we may now see a reversal back down to the neckline at 1272. I have marked the small rising wedge on the chart and the current rally should be over if GC gets back below 1300. GC 60min chart:
I am leaning bullish on ES today but without much conviction. If ES can break up over 1697 that would open up a test of the highs.
