
Well, the constant drift upwards is relentless. I thought September would bring some more decisive direction, but it took almost two weeks of chop to get anywhere. But now the direction seems to be up.
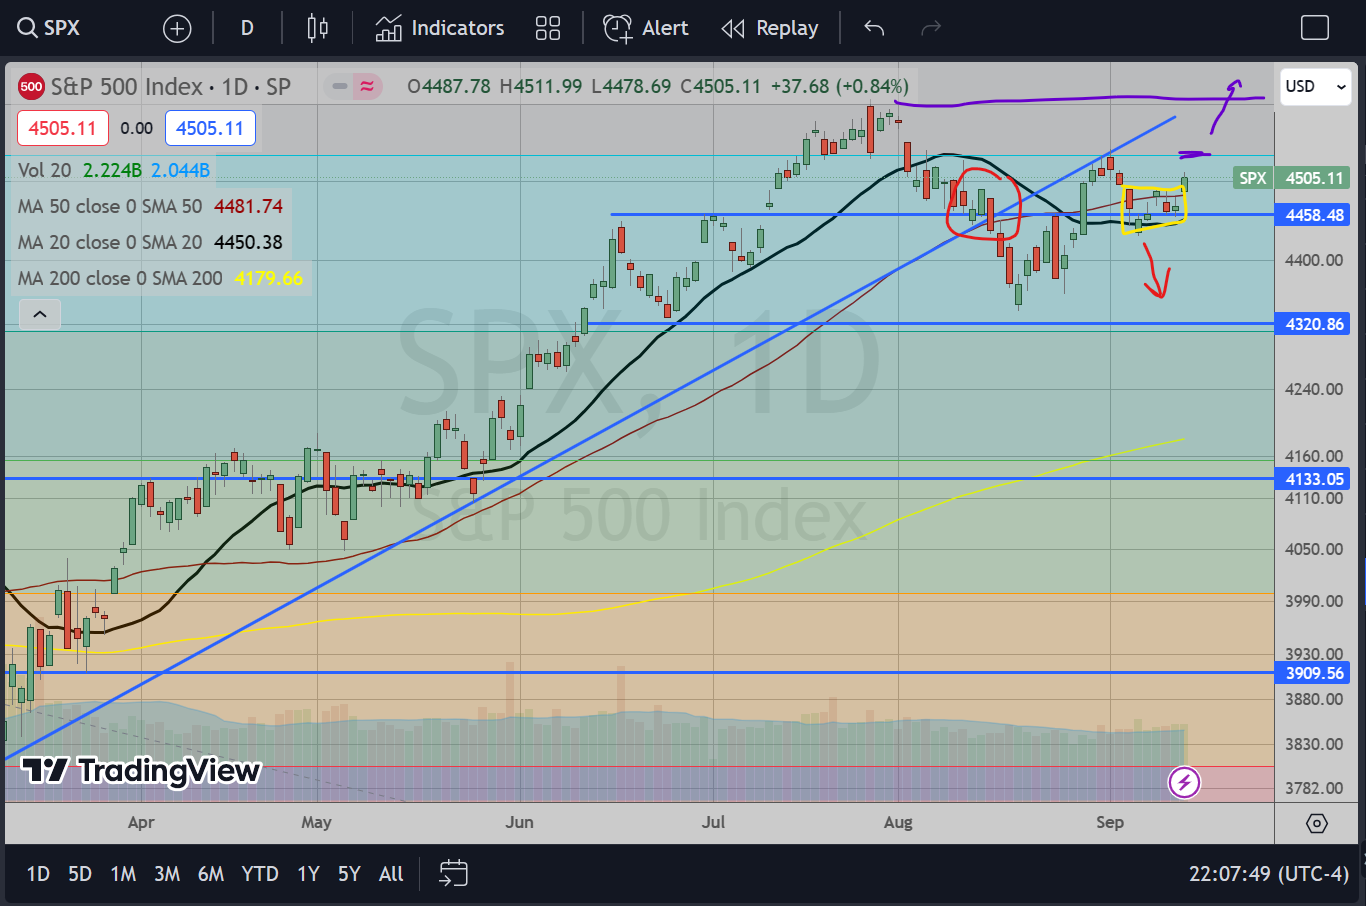
SPX Daily
The ascending trendline drawn from the March lows this year through May lows was broken mid-August, leading to a nice descent to 4337 where we bounced abruptly. The retest from the underside was promising and finally rejected the first week of September. However, the lack of follow-through below 4430 and subsequent choppy action leads me to believe that everyone was in the same boat: Nobody knew what the heck was going on.
From a fundamental perspective, there are myriad reasons for the market to have taken the path of the red arrow down. But the chart don’t lie and here we are finding direction to the upside. I gotta go with the flow and choose the long side until I see some real topping pattern take hold. As of now, 4600 by next week is a foregone conclusion. Unless news breaks that something terrible is afoot (though I don’t know what that could be) then I doubt 4600 would hold much either. I’ll be watching for some chop up there for a day or two, setting up for a break upwards into the end of the year towards 4800.
I hope I didn’t bum any of you bears out with this. I myself am quite disappointed at the prospect as I was hoping to see some reality set in with regards to these lofty valuations, but with all the free money still sloshing around out there in the system, this market is in a “Weekend at Bernie’s” situation (they kept that dead guy walking for an entire two hour movie, so who knows how long the powers that be can prop up this market). Regardless, this is at least a stock picker’s market. There are still some bearish looking charts out there which one could scratch that bearish itch.
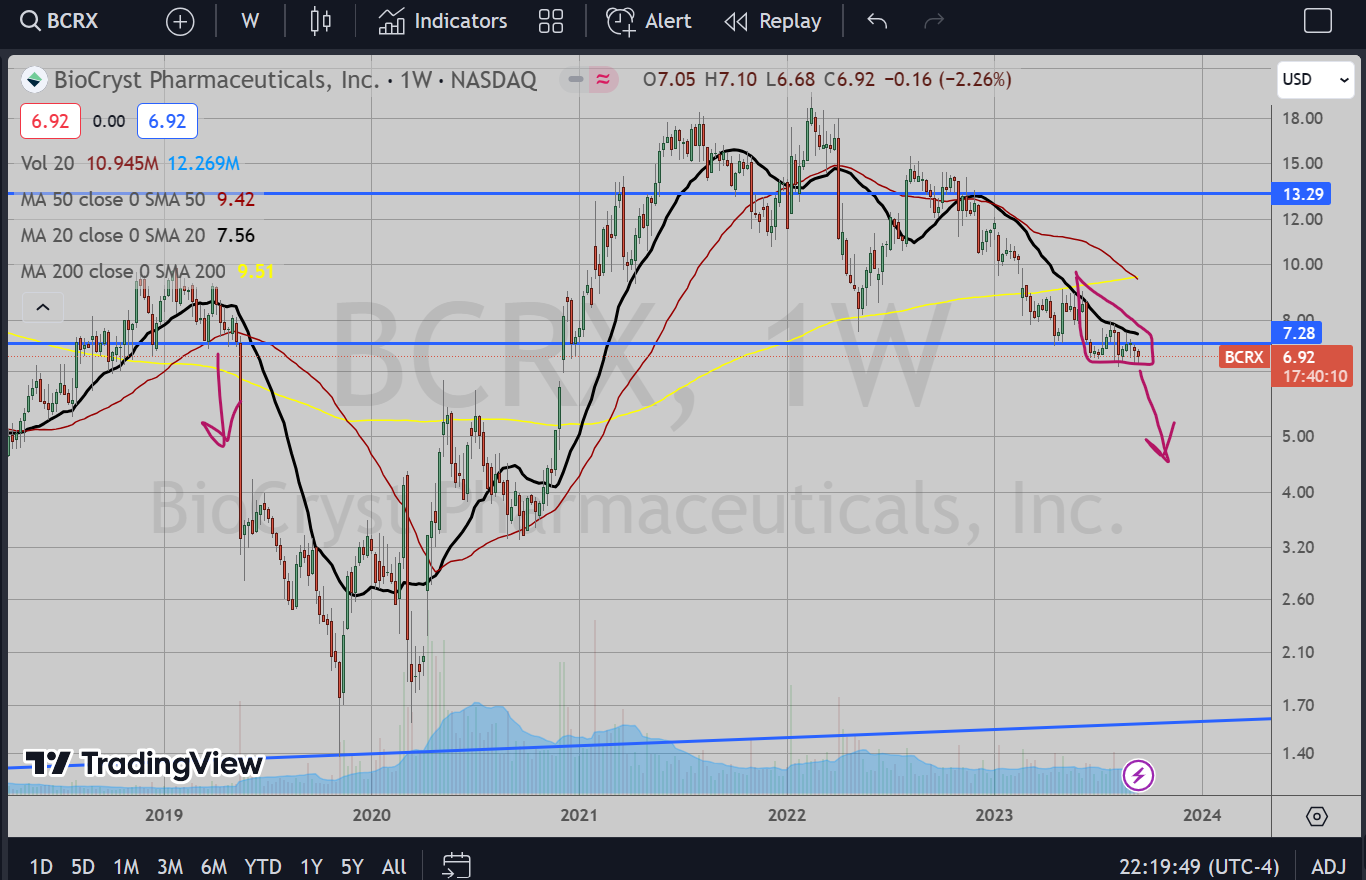
BCRX
I’ve mentioned this before. I still am watching this for a spillover towards $2 by the end of the year. There’s no bullishness around it, no real news. Just this choppy drift downwards. I’ll be watching for potential rollover by next month to take this to $5 at least.
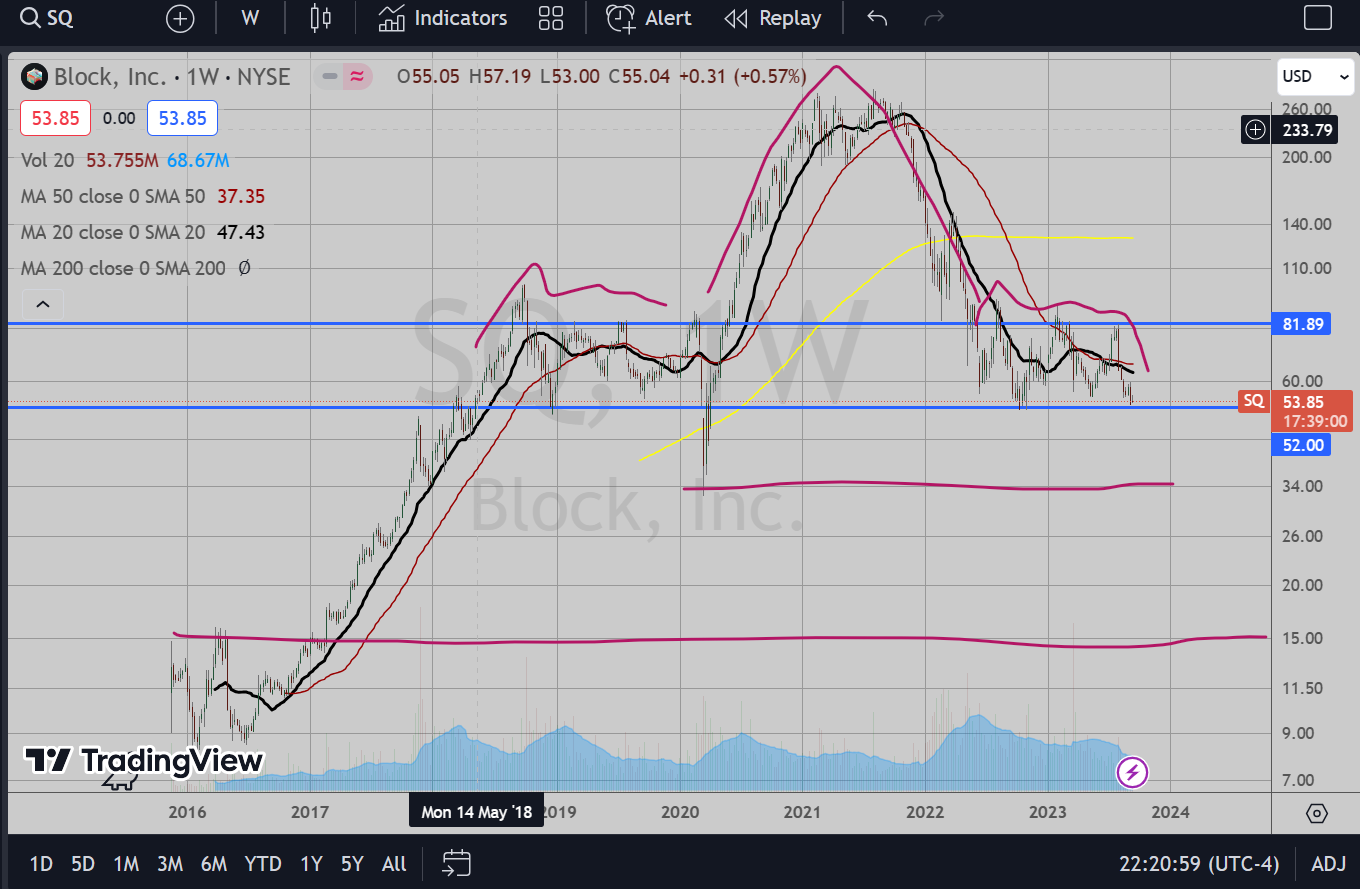
SQ
On a weekly chart, this really lost that momentum in 2021. While it is not a perfect H&S pattern, it is admiringly symmetrical. No strength in this either, and testing low end of support range. I don’t have the chart here, but interesting to note that this has had very large revenue increases in 2020 and 2021 (2022 was slightly negative from 2021), but actual earnings have been flat (actually negative in 2022), so even the fundamental basic analysis shows something is wrong. If this manages to break I’d look to target $34 (March 2020 lows) at minimum. If real momentum downward takes hold then $15 becomes a delicious spot to target.
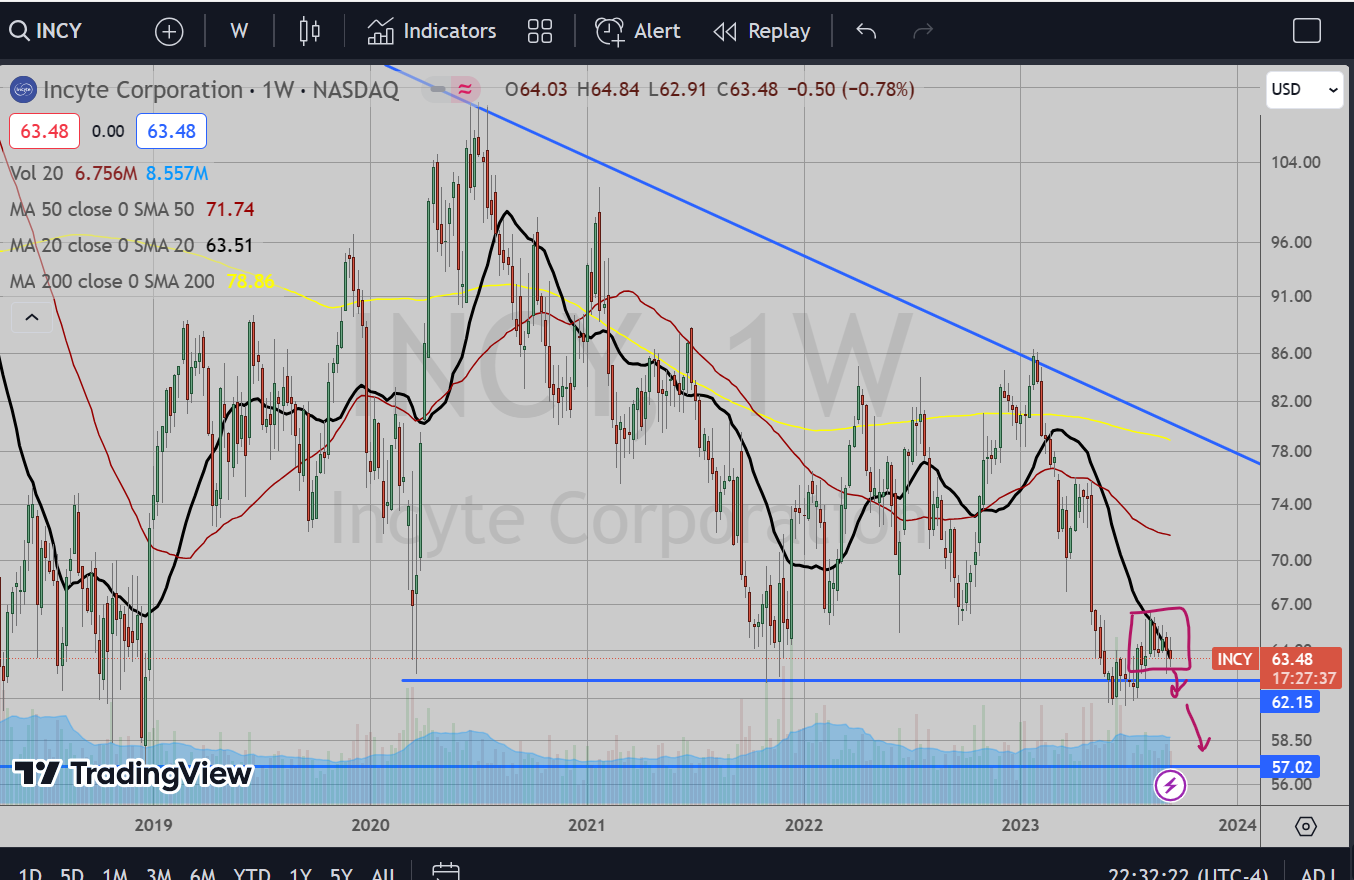
INCY
I’ve also mentioned this one before around June. I was eager for the breakdown but seems I was a bit early. This managed a small drift upwards (ever so slightly), but did not get far. It managed to stop at the 20 Week MA and now is chopping back downwards. If this starts to rollover again towards $62, I don’t think that support will save it again. This recent “bounce” since June only managed to stave off the inevitable fall. Once this breaks downward then the recent resistance at $66 would make a good stop for a short. Targets on this are $45 by end of year, but possibly farther as this has been topping since 2016.
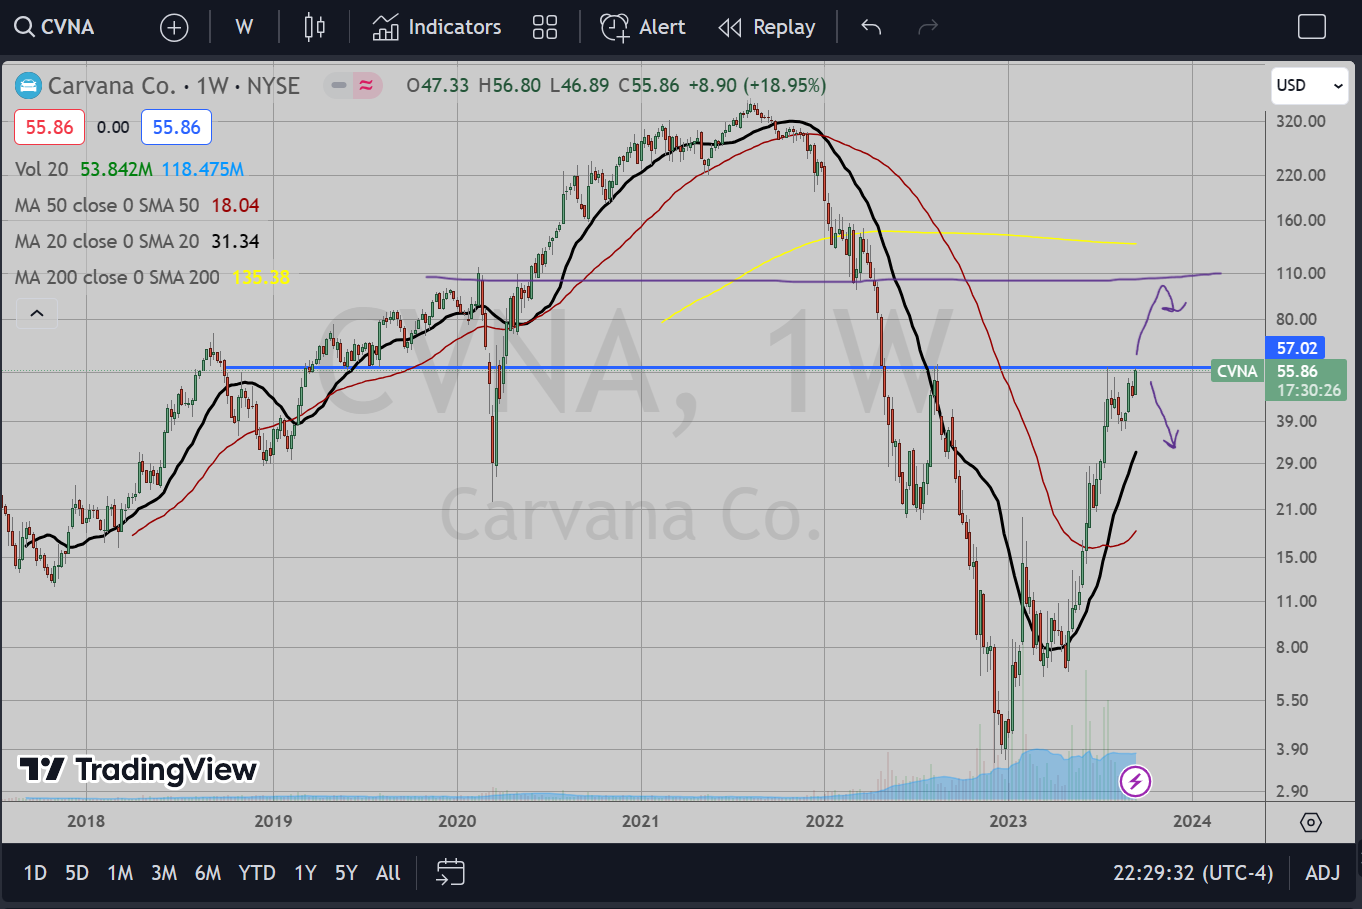
CVNA
Ok, I actually don’t think this is a bearish chart at all. If anything, this is making for a bullish pattern to breakout from here. However, this was a heavily shorted stock since 2022. The recent action has been the result of squeezing shorts to get here. How much fuel is left in the tank for that? Nobody knows. There is a lot of history here at the $56 level, as it has acted as big resistance and support several times in the past, specifically August 2022 and most recently in July 2023.
Being here again, this could reject hard or breakout. If this breaks out then the next technical target is all the way up at $110 (to think this stock could double gets my stomach turning). On the other hand, it could reject pretty hard here too if this resistance decides to hold. So it really depends on your own interpretation of the fundamentals and whether the remaining shorts are enough to squeeze that high. From a risk:reward perspective, it is a big spot worth playing. Perhaps getting long a straddle may be the right play if you’re not sure of direction.
I’ll leave that to you. At the very least, this may just be fun to watch.
So to summarize, the charts seem to be heading upwards now and as much as it pains me to say it, it looks like it is time to get long into the end of the year (at least for me). Happy hunting. Good luck to you all in your trading the rest of this year.
