My Mom's new boyfriend Ted (AKA, jagoff who took over my room and made me move in with grandma) took us all out for Chinese buffet Sunday afternoon. He made us all read our fortune cookies out loud and said we had to add "in bed" to the end of the fortune; he gets a real kick out of that.
Mom's was, "The happiest person is the one without a history… in bed" I call total bullshit on that one since I pretty much have no history in bed, and I'm pretty unhappy about that.
Grandma's was "Your everlasting patience will be rewarded sooner or later… in bed" She promptly stated, "Oh this one should be for you Nathaniel!" Stupid old bag, she jumps on every opportunity possible to zing me…
Jagoff's fortune was "Present your best talents today to an eager and welcoming audience…. in bed." Mom was swooning, and I puked up in my mouth when he read that.
My fortune read, "Take time to deliberate but when the time for action arrives, stop thinking and go in… in bed" That one makes no sense at all (the in bed part), but I kind of dug the actual fortune. The past few weeks I've seen a lot of good bullish (cringe) setups / formations that I planned to act on, then talk myself out of it when the moment presented itself because I'm doing too much analysis, too bearish and too mentally beat up. When the market is open, I really need to "stop thinking and go in" when I see a setup take place. I need to trust my analysis and not be afraid.
I can't believe how many breakouts I saw last week; ones that I sat and looked at for days or weeks before thinking, "this looks pretty bullish", but refused to act upon.
One of the only ones I did act on was SQM. It has been in a nice slow ascending triangle for weeks. An ascending triangle is a bullish formation that usually breaks to the upside. Even though I have been really bearish I put some trust in the chart and stuck with it, last week it did pay off. I wish I would have put a little more trust into some of the other charts I saw.
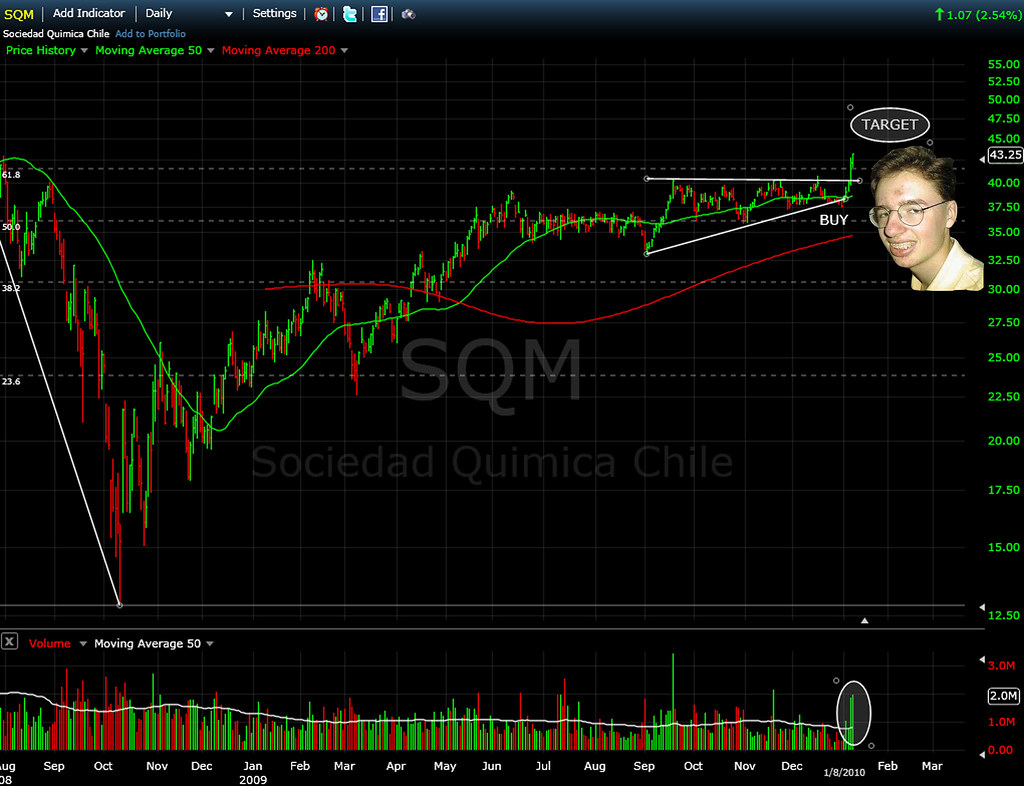
2009 did some real mental damage to me, but I can't really blame anything but myself. Technical Analysis is not broken or "just not working anymore" like I have heard many frustrated traders say. That SQM chart (as well as many others) is proof to me that it is working. I think I just need to push some of my fears aside, and "take time to deliberate but when the time for action arrives, stop thinking and go in…."
