Slope of Hope Blog Posts

Slope initially began as a blog, so this is where most of the website’s content resides. Here we have tens of thousands of posts dating back over a decade. These are listed in reverse chronological order. Click on any category icon below to see posts tagged with that particular subject, or click on a word in the category cloud on the right side of the screen for more specific choices.

Weekly Sector Report: 04/09/10 (Leisa)

By -

Below is the graph of the Dow Jones (24) Sectors for the week ending 04.09.10. The broad market sector advanced 1.5%. For the Dow Jones (164) sectors, 136/164 sectors were positive–particularly strong were the basic resources sectors.

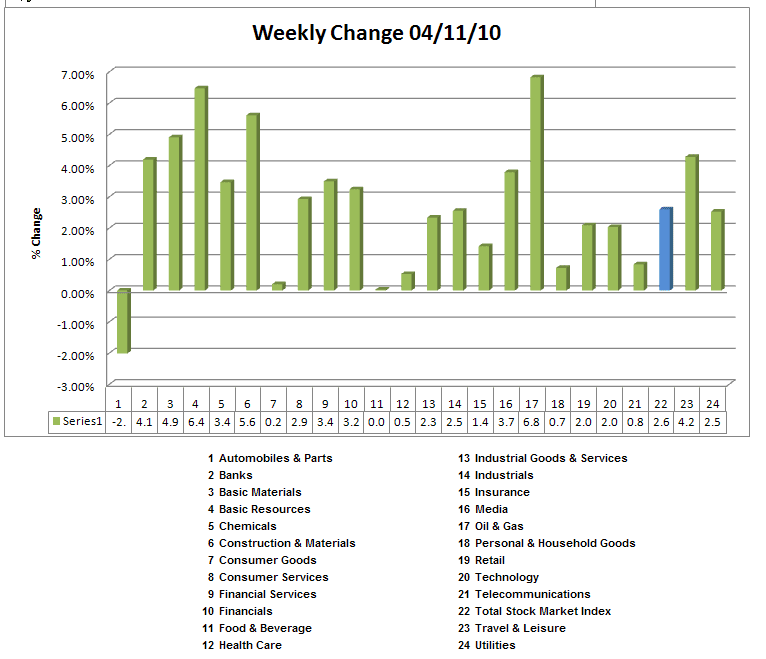
You can find the chart book of the 24 sectors here presented on a weekly and daily basis in addition to the full listing of the 164 sectors here.  I want to encourage you to look at the individual chart books to include the ranking of all 164 industries because that detail has granularity that can be instantly absorbed.  For example, the top/bottom 5 sectors were these:

Topbottom

(I see that I have 6 top sectors!)

By looking at the individual subsectors, you can pull charts of individual constituents and using your own TA methodology make some decisions about potential trades. 

Market lore is replete with both wisdom and pablum.  Unfortunately, some of us (me!) have to learn the hard way how to differentiate between the two. I subscribe to the notion that any stock pick that I have is going to be governed in general as follows:

Snap57  

This model is my mental model that serves as the core of my evaluative process. A few questions one might ask are:

  • The market and sector are weak, but this stock is strong.  Why? (Could be exciting news such as an earnings report or a new product development.).  There might be a long or short opportunity depending on your evaluation of the catalyst. 
  • This stock is weak but the market and the sector are strong.  Why?Maybe there is a short opportunity or perhaps it is in undiscovered gem. A cursory look into the matter might prompt you to put it on your watch list.
  • This sector is strong, but the market is looking weak. The market could be undergoing sector rotation. Indices may consolidate, but underlying sectors will shift up/down.  Finding leaders within the sector might be helpful for identifying opportunities.

A very quick way to look a stocks is creating a ratio of the stock price to the sector that it is in.  For the 24 sectors charts, I provide the sector information for you and it's relative performance to the broad market index.  

Here's an example of a gold chart:

Thm

The bottom part of the chart shows THM's relative performance to all of the miners. Telling, isn't it?

I highlight these points is to encourage you to develop YOUR modality in looking at the markets and stocks within the market to make informed decisions that meet your risk tolerance and time horizons.   When you have a well-developed methodology, then you are informed by the opinions of others, not influenced (read:  derailed).   I may be a slow learner, but it took me a few years to settle on my current methodology.  It suits my style, and your mileage might vary.  Test drive the cars that you need to and undertake the required care and maintenance to optimize your driving time.

All data courtesy of Stockcharts | Compilation courtesy of me.

Earnings Play (by Fujisan)

By -

The earnings season is going to kick off with AA next week and I am so excited as it moves the market!

Earnings Play Examples

There are many ways to play with the earnings with the options and I hope I could cover them all some day.  Here are some earnings play examples:

1. Take the delta neutral straddle/strangle positions a couple of weeks BEFORE the earnings, and take them off right before the earning release in order to take advantage of IV (Implied Volatility) rush.

(Note: IV rush occurs toward the earnings release when many traders speculate the underlying stocks which in turn pump up the option premium.  Same theory that you might have to pay an extra premium to get the flood insurance right before the hurricane season).

2. Take the delta neutral calendar positions RIGHT BEFORE the earnings release to take advantage of IV crush.

(Note: IV crush occurs after the earnings release.  Same theory that the insurance premium drops after the hurricane is gone).

3. Take a directional trade before the earnings release and hold on to the position afterwards for an instant gratification of the profits.  This is the most riskiest strategy of them all, and a lot of retail traders lose money on the earnings because of this.  Unless you know how to pick the direction and understand IV pump and dump, you will be most likely losing money on the earnings play.

4. You take the trade AFTER the earnings release.  The results of the earnings would often times accelerate to the direction of the earnings.  You would have a better sense of direction and a better risk/reward.

I have discussed the first 3 examples previously, but I have never discussed how to approach the "after earnings" play, so I am going to cover this topic this week.

Why "After Earnings" Play?

If you are playing with "Before Earnings" play as discussed in item 3 above, you are really going for a gap up/down of the earnings results, which accounts for a very small portion of the entire price movements and it's not worth risking your capital. 

AA Last Earnings

If you take a look at AA's last earnings, you can see a "gap" as such a small portion of the entire price move. 

AA_earnings 
BIDU Earnings Price Move

You can take the trade AFTER the earnings and still make a pretty good money.  If you take a look at BIDU's last two earnings, you can see that the price movements of the big volume candle tends to repeat.

Bidu

BIDU Daily

By the way, here is the BIDU daily that I discussed a couple of weeks ago.  BIDU is right below the big wick candle as of last Friday and if it breaks above it, there is a very good probability of another $70 move.

Bidu
 
AA Daily

Here is AA's daily chart.  AA is forming a very nice H&S pattern and I'm almost certain that AA will drop upon the earning release.  HOWEVER, unless you know how to play with the earnings, you would be better off waiting for the earnings release and then take the position.  Much better risk/reward and no surprises.  Of course, if you are looking for some excitement, you can take the trade beforehand at your own risk. 

Aa 
Metal Updates

My metal trades are going quite well.  Here are some updates from last week's post.

GOLD

2010-04-09_1621 
Silver Daily

SILVER 
GDX Daily

GDX 
General Market Updates

I guess everybody now is watching 1200 area for SPX.  I would just stay away from the major indices – it's too high to go long, but too risky to go short (it just won't drop!). 

Here is the Q's weekly chart update that I posted last month.  Qs now closed above the previous swing high, which is almost guaranteed to reach the next swing high before the consolidation.

Qqqq 
AMZN Daily

AMZN has been lagging behind the general market but it finally started picking up.

Amzn

Have a safe trip and hurry back home, Tim!  I am going to hold the market for you until you come back!

Dead Ahead

By -

Slopers – – over the course of the next week, I am going to be overseas. This will mean several things:

  • The frequency of my updates to the blog is going to be severely restricted (starting now);
  • Comment counts are going to get very high due to this infrequency;
  • You're going to be seeing more guest content than normal
  • When updates do occur, it will be at very peculiar hours, since I'll be in a very different time zone.

In the past, when I've gone on (all too rare) vacations, it was a running gag that I'd still manage to keep the blog as up-to-date as ever. Given the wildly different time zone I'll be in, I am sure the aforementioned warnings will be true. Thanks for understanding, and things will return to "normal" on Monday, April 19.

0410-europe

Chart on Retail ETF (by Mike Paulenoff)

By -

The SPDR Retail ETF (XRT) is one heck of a bullish chart, which includes names like Whole Foods (WFMI), Sears (SHLD), OfficeMax (OMX), HSN (HSNI), Netflix (NFLX), Dress Barn (DBRN), and Family Dollar Stores (FDO). Purely from a pattern perspective, the XRT shows no sign of peaking, and is poised to hurdle Wed.'s high at 42.64. If the price structure moves vertically higher into a new upleg, it COULD make a run at its upper channel resistance lines in the 44.50- 45.50 target zone, or 5% to 7% more upside.

To do this, the XRT will be climbing on "reduced" momentum, which hit its RSI peak on March 15th, when prices hit a high of 40.32. This means that the XRT has already climbed 5.5% on dissipating momentum. While this is developing and growing concern, obviously the price action tells all — and it remains up and very strong for now.

That said, the longer the "divergence" continues, the more likely it is that when the XRT turns down, the decline will be significant, and inflict some serious damage to the Feb.-Apr. uptrend. Of course, for argument sake, if the XRT declines to 39.00-38.00 from 44.50, or say 14%- 15%, The Street will be looking at the weakness as a buying opportunity. In any case, for now, as long as 41.00 support contains any forthcoming weakness, the bulls will remain in directional control.

Hvwx7Z36I 


Originally published on
MPTrader.com.