SEPTEMBER UPDATE
Overall, we are seeing divergent data coming through as usual, so we'll have to wait and see where we fall. In general, I tend to believe the longer term theme that I've laid out that our economic situation for consumers is slowly grinding to a halt while big business is taking full advantage of the globalization of the world economy and managing to keep busy. I think this is why some of this data remains stubbornly positive despite what the average guy is feeling here in the US. The fact that large multi-nationals are diverse enough to show gains abroad is great and is really beneficial to the US economy, if we didn't have that, I think we'd be in a much worse position.
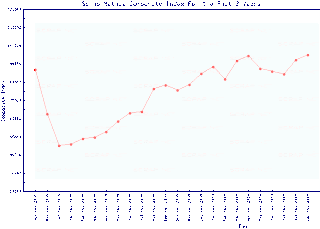
TOTAL RAIL TRAFFIC – http://railfax.transmatch.com/
Rail traffic can reversed its season decline and all carriers have resumed their forward march. They still are 10%-20% less than the 2008 period, but they continue to improve. I need to find some truck shipping data because I have a feeling that trucking companies are opting to load their trucks on rails to save on transit costs. This obviously makes rail shipping look better.
 |
|
Total Rail Traffic
|
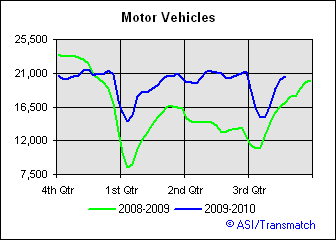
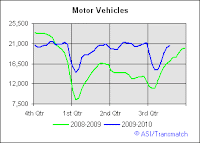
MOTOR VEHICLES (RAIL TONNAGE)
Auto shipments rebounded. As I mentioned last month, it looked like a seasonal decline was causing a drop. I'm interested to see what happens here in the next quarter as the green line really ramped higher last year. Is there pent up demand or will this begin to flat line?
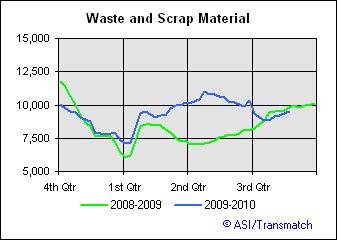
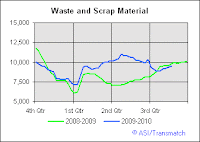
WASTE & SCRAP RAIL TONNAGE
Interesting, it looks as though scrap shipments are coming back in line with the 2008 and 2009 level which leaves me wonder what was happening over the last few quarters to fuel the spike. I believe we will see the same trend happen with those auto shipments. Despite the leveling off of scrap shipments, scrap prices do continue higher. See the chart below for those details.
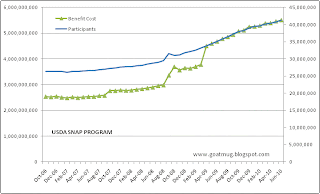
FOOD STAMPS (SNAP DATA) – http://www.fns.usda.gov/pd/34SNAPmonthly.htm
Generally speaking, there is no change in the trend for government food stamp recipients. There is an ever increasing number of families on government assistance. I know things are rough and this is highlighting the divide between the haves and have nots. A person in the US does not need more tax write offs or rebates or enticements to buy more "green" energy stuff or other overpriced crap, they need jobs.
41.2 million people are taking food stamps which is a total of 19.1 million households. Benefit costs per year continue to edge up at $5.5 Billion. The average household is receiving $287.00 a month in assistance.
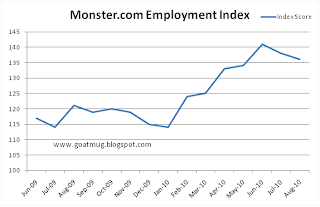
MONSTER EMPLOYMENT INDEX – http://about-monster.com/employment-index
We've commented on how the Monster Employment Index had been steadily improving as employers continued to buy advertising slots to fill their positions. Over the last two months we've seen a decline in the listings as June was the index high at 141. At the end of August we are at 136. This is still high end of the range for the last year, but clearly we've seen a softening.
HOUSING
I am purposely omitting a discussion on housing. I am attempting to obtain approval to use a few charts that I found from a great blogger on the topic. As soon as he grants permission to copy the charts I'll make a post in the next week. Chart or no chart, the housing market is terrible.
WLI DATA – http://www.businesscycle.com/resources/
WLI data continues to flounder in the low 120's area. If you've followed any of the recent debate about the usefulness of their data you'd be completely confused. The ECRI folks have submitted that their data is not an indicator of a recession, or should I say they are saying that their data does not suggest a double dip, however they have consistently advertised that their data can predict recessions. I think we are simply seeing that all data is completely fouled up due to government influences in the market. The Fed and Treasury have flooded the markets with excess liquidity that is doing nothing for the general economy, rather propping up asset values (and doing a poor job of it too). These liquidity streams are really wreaking havoc with the WLI and also the Bloomberg Financial Conditions Index in my opinion. While overall data is weak, the components that deal with easy money availability are signaling that the good times are here. The conflicting information is causing these metrics to fail.

MIT/MOODY'S COMMERCIAL PROPERTY INDEX – http://web.mit.edu/cre/research/credl/tbi.html
MIT and Moody's data shows that all is not so good on a national level for commercial real estate. Price moves up have been met with corresponding drops. Overall, stock market prices for commercial real estate (CRE) have been doing wonderful this year, as I'm sure that much of the improvement has been a relief that the complete meltdown that everyone expected has not come. Yet, these are the exact times when we should be examining these investments that have had their relief rallies and now are left with a dose of reality. Perhaps it is wise to review shorts of several real estate investments?

COSTAR – http://www.costar.com/about/article.aspx?id=7719
Costar is suggesting exactly the same. I like this chart because it breaks down the space by type of property. While there are regional improvements, especially in the Western US, the overall health of the CRE space is poor and declining.

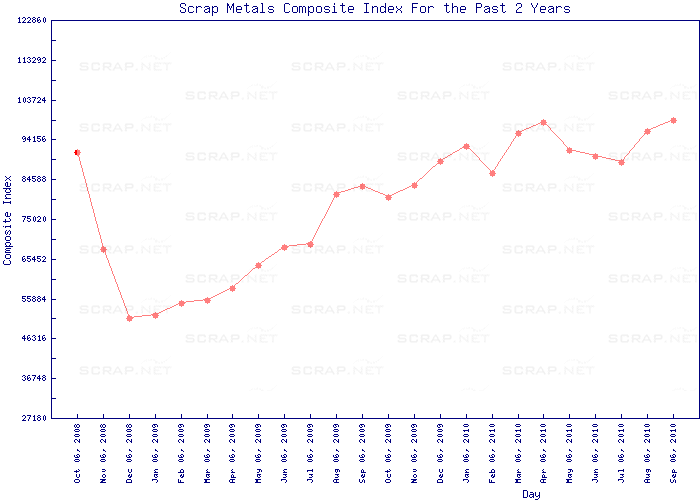
SCRAP METALS COMPOSITE – http://www.scrap.net/cgi-bin/composite_prices.cgi?id=100000&num=5
As we've covered several times, Alan Greenspan used scrap metal as a way to take the economic "temperature" of the economy. We continue to see prices rise here, but I'll be watching for a breakout above these levels to signal that some real recovery activity might be going on. All in all this may be a reflection of international demand and dollar weakness.
BALTIC DRY GOODS SHIPPING – http://www.bloomberg.com/apps/quote?ticker=BDIY:IND
Speaking of international demand, we are seeing continued improvement in the BDI. I'm still bullish on pricing for this index to go higher. If you are looking at this space as an investment, remember that few shippers are leveraged to this metric as they've contracted out their fleets for longer term deals. There are a couple of shippers that are tied more to the daily rate and you should do some homework on those names. The bottom line here is that most shippers are leveraged to an extreme and they are subject to dividend cuts (which is why many people own these types of firms). So, faced with a cut of dividend and high leverage, I tend to shy away from these firms. Although one can argue that with pricing as bad as it it now, there is only one way to go and it is up!

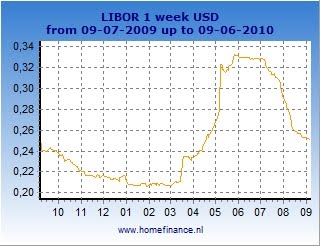
1 WEEK LIBOR – www.homefinance.nl
Despite rumors of poor banking lending in Europe and around the world, we continue to see 1 week Libor and all other dates come in. This would normally be an indicator of health in the system as bankers are "trusting" each other more and therefore demanding less of an interest rate for 1 week exposure. As mentioned above, government interference in this space causes me to question any rate or improvement I see, especially with the concerns that European banks may need more capital. While this is USD Libor, we are seeing the same rate reductions in all rate curves.

US FINANCIAL CONDITIONS INDEX – http://www.bloomberg.com/apps/quote?ticker=BFCIUS:IND
The USCI has edged above 0 again which would suggest that we are now in recovery mode and in an expansion! HA! As mentioned with WLI, I have to question it. The big move is a result of the rebound in the stock market over the last week. As we have covered, this is exactly the strategy of the Fed, if asset values move higher, people believe that the recovery is in. Once they believe the recovery is in, they spend like crazy adding to their debt and spending beyond their means for instant gratification! I'm not buying it and Mom and Pop are not buying it either. We'll continue to watch this one.

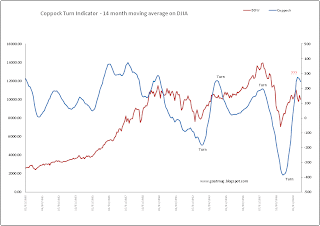
COPPOCK TURN INDICATOR
Since I posted the Coppock turn signal in June there has been no looking back. The signal continues to suggest that you should be out of the market rather than in. The thing has a decent track record, but won't get you in early on the turns because it is based on a 14 month average, however, on big swings it does give you decent signals.
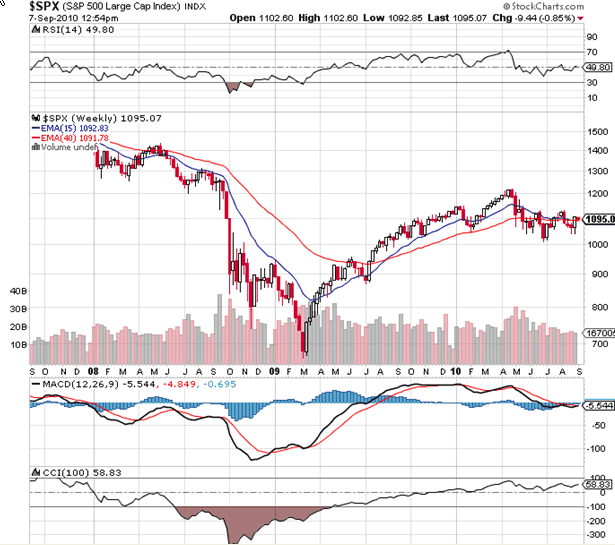
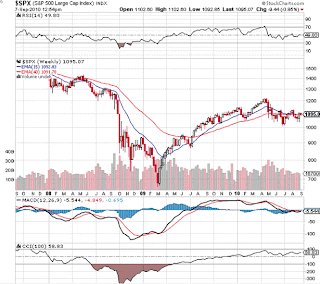
S&P 500 15 DAY / 40 DAY EMA CROSSOVER
Last week's rally has put another bearish chart into question. We'll need to watch this set up as I type this today, the signal will go back to bearish. As many know, one of my favorite bloggers Chris Puplava suggests that a very long term signal for market declines is the 15/40 Crossover on a weekly chart confirmed with a sub-50 RSI. As I posted several weeks ago, we did get that signal in the S&P500. I wanted to post this here because you might get the sense that I'm bearish (and that would be correct), but I want to make sure that I'm not caught leaning one way when it really is a false signal. Of real importance is that the DOW has NOT crossed over and therefore is not confirming the action in the S&P500.
USD -http://www.bloomberg.com/apps/quote?ticker=DXY:IND
The US dollar has almost lost all of its gains made in that last several months. How easy it was for Fed President Bullard and Chairman Bernake to slash the value of the dollar! This is clearly much of the fuel for the launch in gold prices. So remember we now have two keys reasons why gold is favored. First, it is not the dollar and not the Euro, and second it possesses the characteristics that benefit from the Fed strategy of debasement.

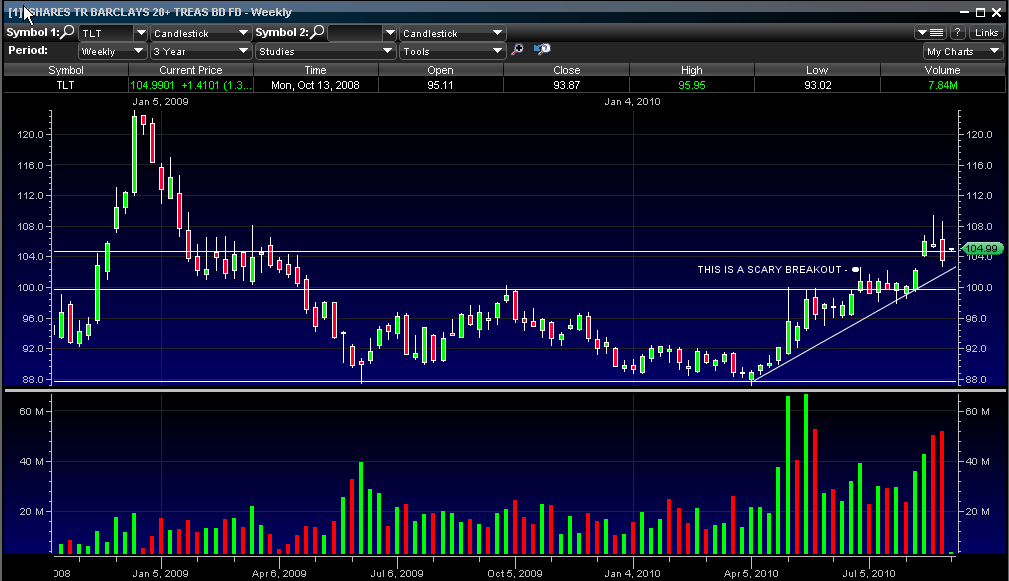
TREASURIES (TLT)
Treasuries continue to remain above the levels that suggest stress in the financial system. While TLT trades higher we must acknowledge that much of the gap higher is related to the Fed's QE program where they buy treasuries. Of course this incited a stampede to get in front of the FED so we have traded down a bit once the rush abated. I have spoken with several people that want to short treasuries or buy TBT but I would caution against this trade unless it is very short term in nature. What we all need to understand is that this program is here for the long haul and we'll continue to see record setting low rates across the spectrum of the debt curve. We will see 3.25% or 3.5% 30 year mortgages and to have that come to fruition, we'll need to see TLT go higher.
TRADING UPDATE
As bearish as things are beginning to look, I am very concerned when it seems like the entire universe shares my pessimistic view. I was noting that last week and guess what, we got a big rally! Fortunately I continued to stay long in the emerging markets strategy I've advocated since July and have rebounded nicely. In fact, holdings in Singapore and Malaysia continue to outperform. As we enter September I am going to scale out of positions, or if I retain them, will marry them to a short position to have downside coverage. I still like corporate debt, but so does everyone else, so I haven't added any bonds to my portfolio in a long time and don't anticipate adding unless I see something come out that is being unloaded by a distressed seller.
For longer term trades, I still believe 100% in my anti-US strategy of going long emerging markets and gold. The Fed has put us on notice that they will monetize debt and drive the value of the dollar down in an attempt to stimulate, stimulate, stimulate!
I had an interesting conversation with a few professional oil and gas traders last week. They reflected that this has been one of the toughest trading years that they can recall. They were very concerned that top notch guys were getting blown up with the wild swings from day to day. They commented that several big firms were really in bad shape. It is these types of conversations that continue to keep me out of oil and gas because you can be directionally correct, but have someone blow up and move the entire market against you.
MONOPOLY AND THE BEAR MARKET OF 2010
This is dangerous work and it pays to be cautious, patient, and above all protect your capital. I played an online version of Monopoly with my kids the other day and we had an unusual experience that is an example of what will happen in real life in the coming years.
In our online game a computer player landed on an unowned space and he decided that he did not want to buy the property. In our example, when the buyer doesn't want the property, it is sent to auction where all of the other players can bid on it. (Perhaps the real game is like this too, but I never remembered that). In our game we really wanted this Boardwalk-like property and had lots of cash to purchase it since we'd had terrible luck with our rolls. All of the other players were really strapped for cash since they had bought other properties due to their good rolls. Since I'm teaching them "economics and game theory" we entered a clever bid in hopes of stealing this prime property on the cheap. What happened next was very unusual. As the time to enter bids expired we received a notice on the screen that we were the only bidder for the property and therefore bought it for almost nothing!
The message is simple and clear. In Monopoly and in real life bear markets, there will be opportunities, you need to have cash to be able to take advantage of them. Patience is a trade so protect your capital! Check out other posts in the next few days at www.goatmug.blogspot.com
Be careful!