
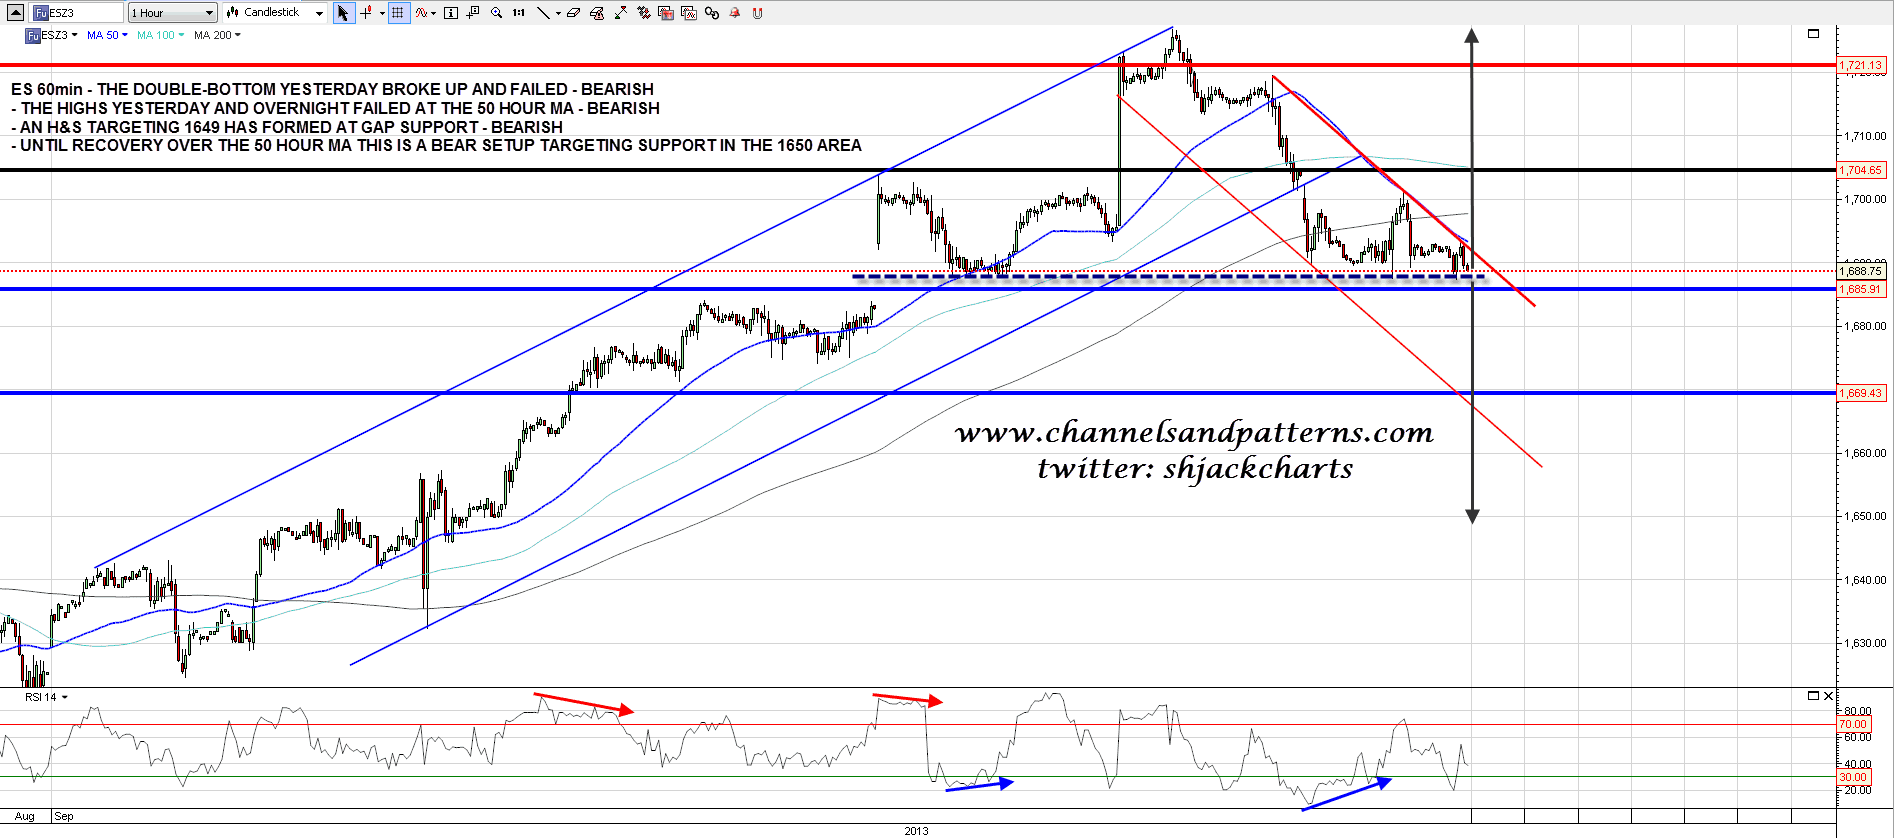
That was a very nice bounce setup coming into yesterday morning, and it improved with the initial spike down as a double-bottom formed on SPX to join the one on ES. Both double-bottoms broke up but soon ran into a wall at the ES 50 hour MA and failed there, which was bearish. Overnight ES bounced again and failed again at the 50 hour MA, currently at 1693, so that is main resistance coming into today and the bulls have nothing unless that can be broken. ES support is gap support in the 1683.75 to 1687.25 range, and if that breaks the H&S target is in the 1649 area. ES 60min chart:
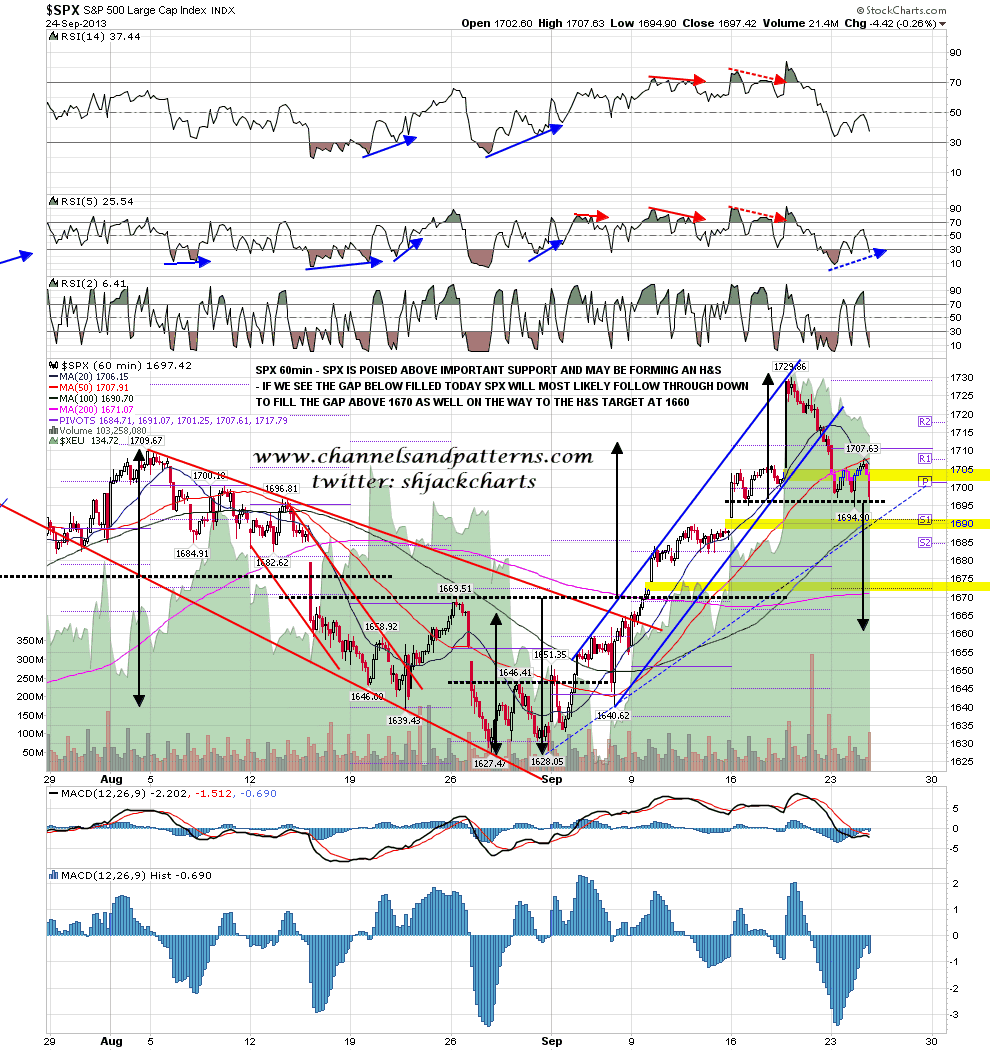
The H&S on ES has a matching pattern on SPX, and I posted this on twitter last night just after the close. On a clear break below the neckline the H&S target is in the 1660 area, which would fill both open gaps below. SPX 60min chart:
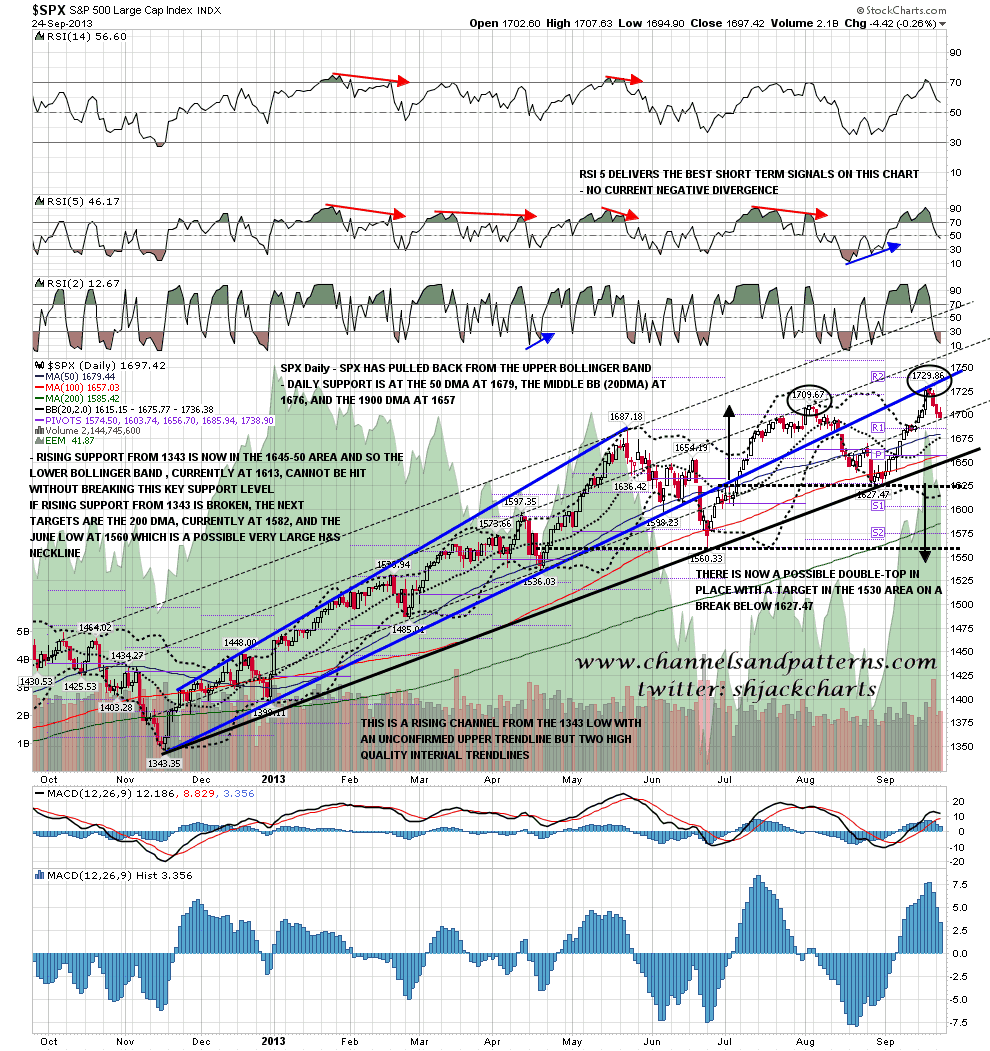
With those H&S targets in mind what are the obvious targets below on the longer term SPX charts? On the daily chart the sharp pullback from the daily upper bollinger band would normally be followed by a test of the daily middle BB or a major MA. On that basis the obvious targets and support levels are the 50 DMA at 1679, the middle BB (aka the 20 DMA) at 1676, and the 100 DMA at 1657. Obviously the 100 DMA is the best fit with the H&S targets. SPX daily chart:
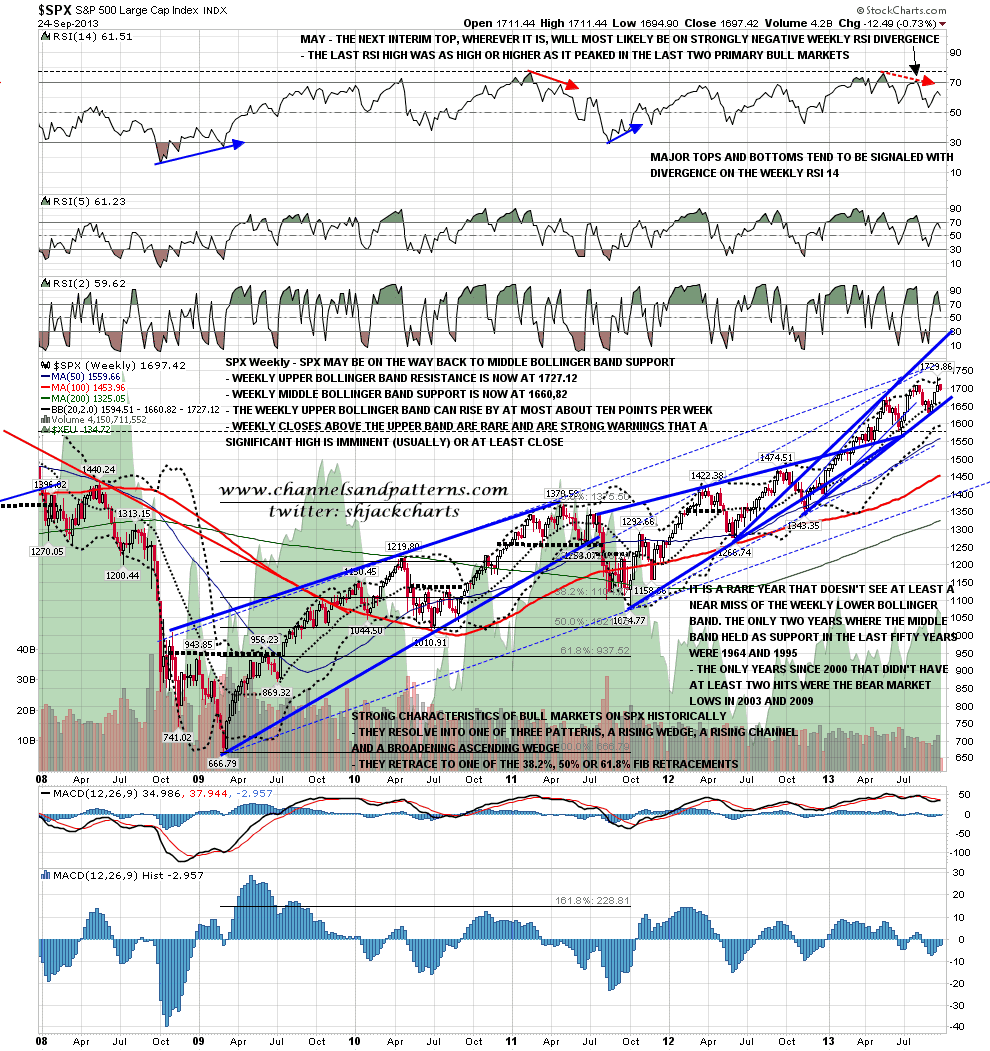
The other target to consider here is the weekly chart, where the middle bollinger band is now at 1660, which reinforces the most likely target on a break down here in the 1657-60 area. SPX weekly chart:
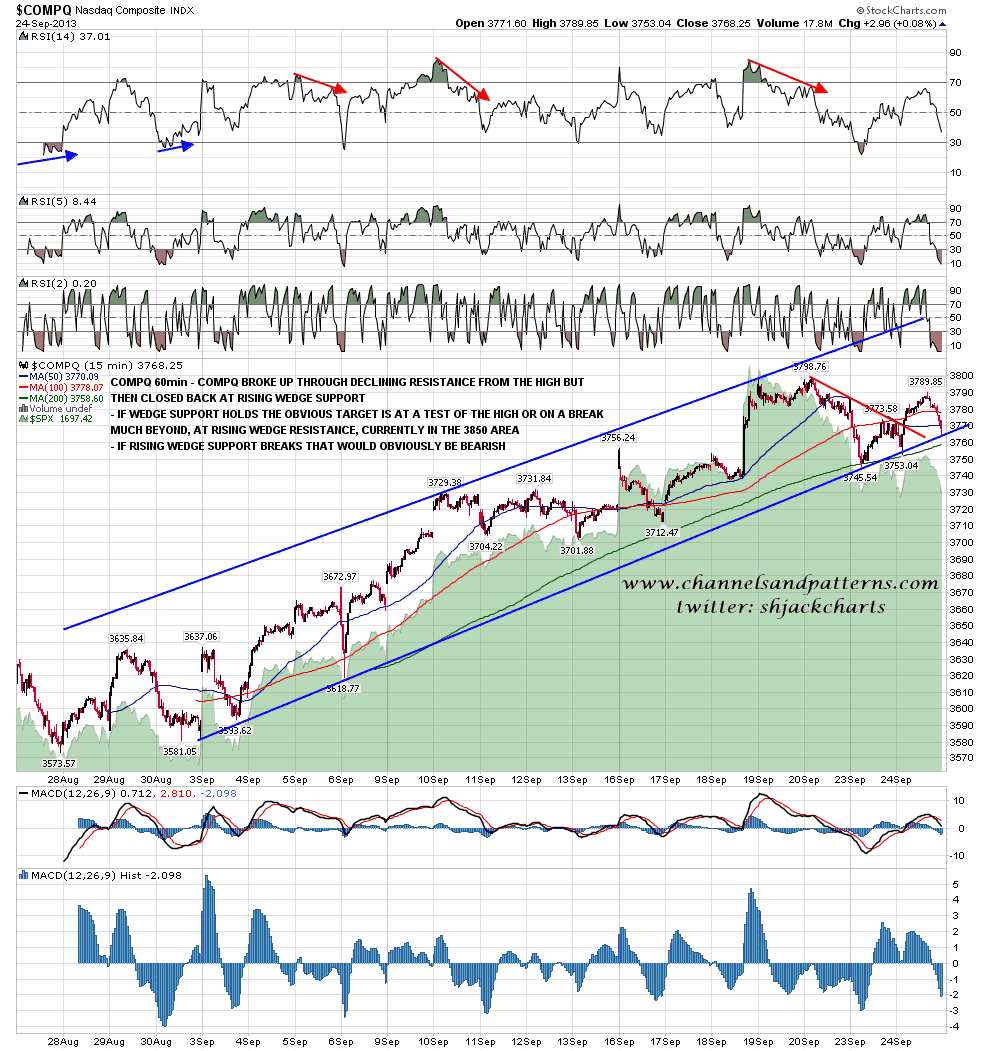
Following on from my look at COMPQ yesterday morning, COMPQ tested rising wedge support on the initial spike down, then broke up through declining resistance, and then closed back at rising wedge support. Obviously a break down would look rather bearish and three tests over a short period without an intervening visit to wedge resistance suggests that we may well see this support trendline break soon. Until the trendline breaks we could see a test of the highs but given the overall setup here I’d advise against betting the family farm on that happening. COMPQ 60min chart:
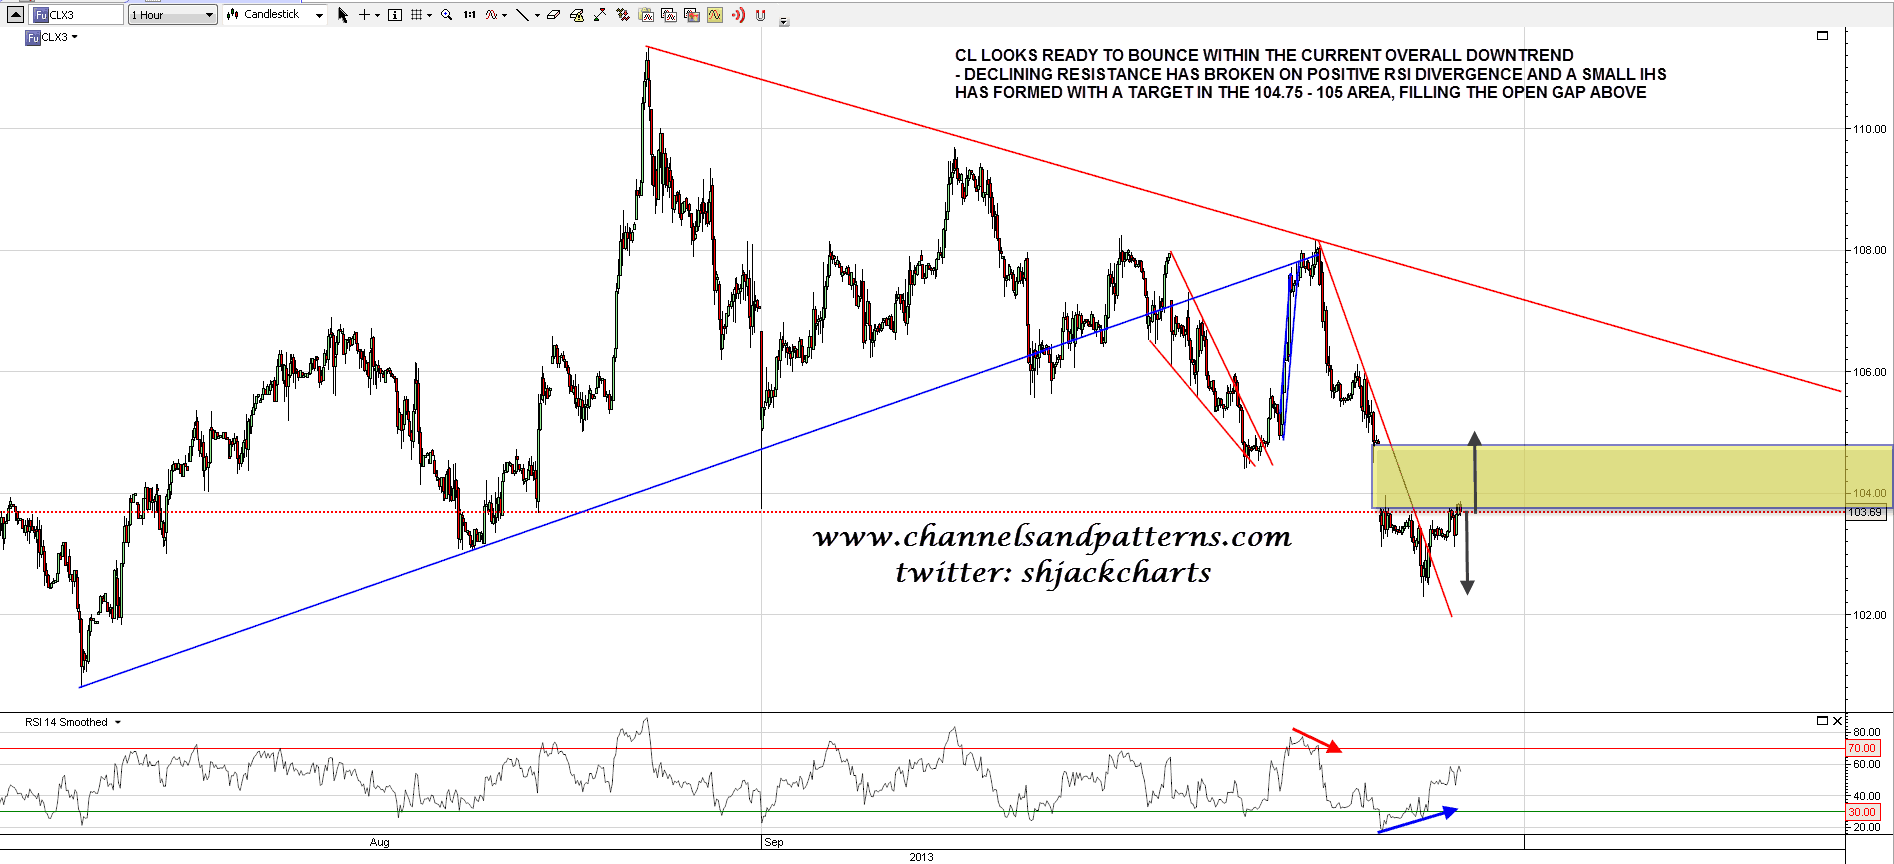
On other markets I posted a chart on twitter yesterday noting that CL had broken declining resistance on 60min RSI divergence. Since then a small IHS has formed and is breaking up with a target in the 104.75 to 105 range to fill the open gap immediately above. CL 60min chart:
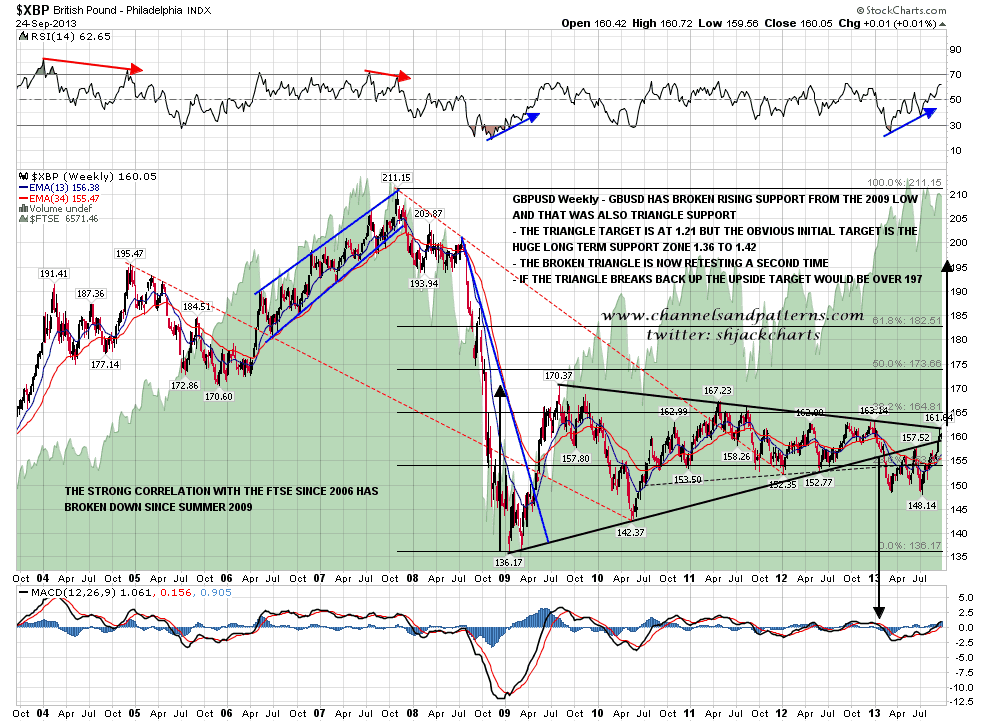
I haven’t posted much in the way of forex charts recently and that’s because there’s currently not much to say. A very big move on USD is likely to start in the near future and it’s currently very hard to say which way that will break. That is best shown on the GBPUSD weekly chart, where the huge triangle is likely to break up or down in the near future towards a target that on an upside break hasn’t been seen since mid-2008, and on a downside break hasn’t been seen since the 1980s. I’m watching with interest until we see a clear break one way or the other. GBPUSD weekly chart:
On other markets I posted bullish charts on ZB and SI yesterday and not much has changed from then until this morning. You can see those charts here – ZB (Bonds), SI (Silver).
I’m leaning bearish into today, and on a clear break below the H&S necklines on ES and SPX (and a wedge break on COMPQ), I would be looking for a move to test strong support in the 1655-60 SPX range. The bulls still have a chance to recover the situation today however, and I would note that overnight ES has made two short term higher highs and a higher low, putting ES in a short term uptrend. If bulls can get an hourly close significantly above the 50 hour MA at 1693 then they have a run at 1697, and then a chance to beat the high yesterday at 1701. That wouldn’t kill the H&S on ES, which has an ideal right shoulder high target at 1703.5, but it would weaken the overall bearish setup coming into today, and I would also note that the declining resistance trendline that I drew on the ES chart above has broken as I have been writing.
