Losing Face
One of the bigger losers on Friday, when the Nasdaq lost 110 points, was Facebook (FB), which dropped 4.61% to $56.75, a buck and change away from the near-term bottom target for the stock hedge fund manager and market technician Tim Knight highlighted in a recent post (“Social Targets”).
Looking Back At A Facebook Hedge
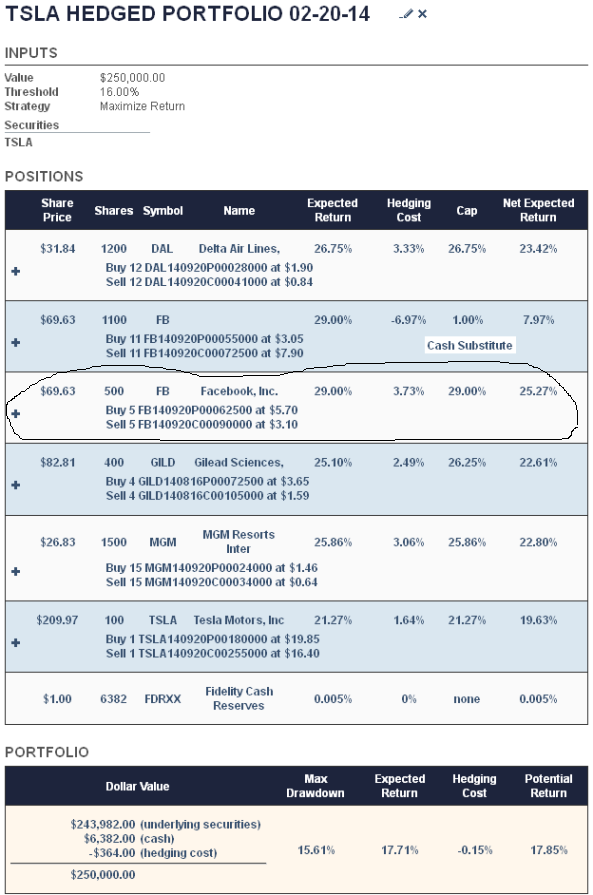
Facebook was part of a hedged portfolio we created with Portfolio Armor on February 20th for an article (“Constructing A Hedged Portfolio Around A Tesla Position”). That portfolio, shown below, actually included Facebook twice, once as cash substitute.[i] In this post we’re going to focus on the other Facebook position though, the one circled below. We’re going to look at how its hedge ameliorated FB’s decline, and the question this raises about when to exit losing positions in a hedged portfolio.

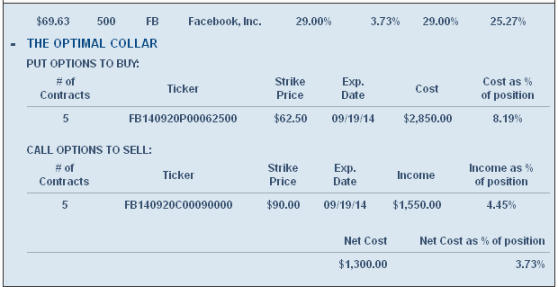
In the portfolio above, each non-cash position was hedged against a greater-than-16% drop. In this post, we’ll look at how that second Facebook hedge would have softened the blow for FB shareholders since then. First, though, here’s a closer look at that Facebook hedge. This is is what you would see on Portfolio Armor when you clicked the “+” sign in the circled position above.

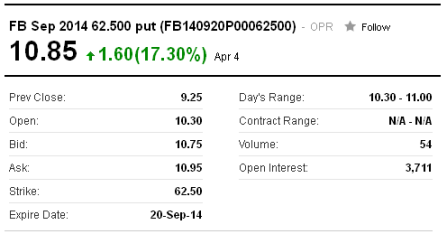
How That February 20th Hedge Has Reacted To FB’s Drop
Here is an updated quote on the put leg as of Friday:

And here is an updated quote on the call leg:

How That Hedge Protected Against FB’s Drop
FB closed at $69.63 on February 20th. An investor who owned 500 shares of it and opened the collar above on February 20th had $34,815 in FB stock plus $2,850 in puts, and if he wanted to buy-to-close his short call position, he would have needed to pay $1,550 to do that. So, his net position value for FB on February 20th was ($34,815 + $2,850) – $1,550 = $36,115.
At FB’s closing price of $56.75 on Friday, April 4th, it was down 18.5% from its closing price on February 20th. The investor’s shares were worth $28,375 as of 4/4, his put options were worth $5,425, and if he wanted to close out the short call leg of his collar, it would have cost him $405. So: ($28,375 + $5,425) – $405 = $33,395. $33,395 represents a 7.5% drop from $36,115.
More Protection Than Promised
So, although FB had dropped by 17.5% at the time of the calculations above, and the investor’s hedge was designed to limit him to a loss of no more than 16%, he was actually down only 7.5% on his combined hedge + underlying stock position by this point.
A Question This Raises For Hedged Portfolio Strategies
If an investor holds all of the positions in the hedged portfolio above until just before their hedges expire, and Facebook doesn’t recover by then, he’d be down as much as 16% on his FB position. A question this raises is whether it makes sense to exit losing positions sooner, to take advantage of the time value of in-the-money put options. Obviously, if you know ahead of time that the underlying security won’t recover before the hedge expires, it would be best to exit sooner. But of course, you don’t know that, so it helps to have a heuristic: in general, is it better to exit losing positions early or hold until just before their hedges expire, to capture a possible rebound? This is something we plan to explore empirically soon, using the results of multiple tests at various starting points during the 10 year period from 2003 to 2013. I’ll post an answer to that question here as soon as we’ve run the tests.
—————————————————————————–
[i] A cash substitute is a security collared with a tight cap (1% or the current yield on a leading money market fund, whichever is higher) in an attempt to capture a better-than-cash return while keeping the investor’s downside limited according to his specifications.

