
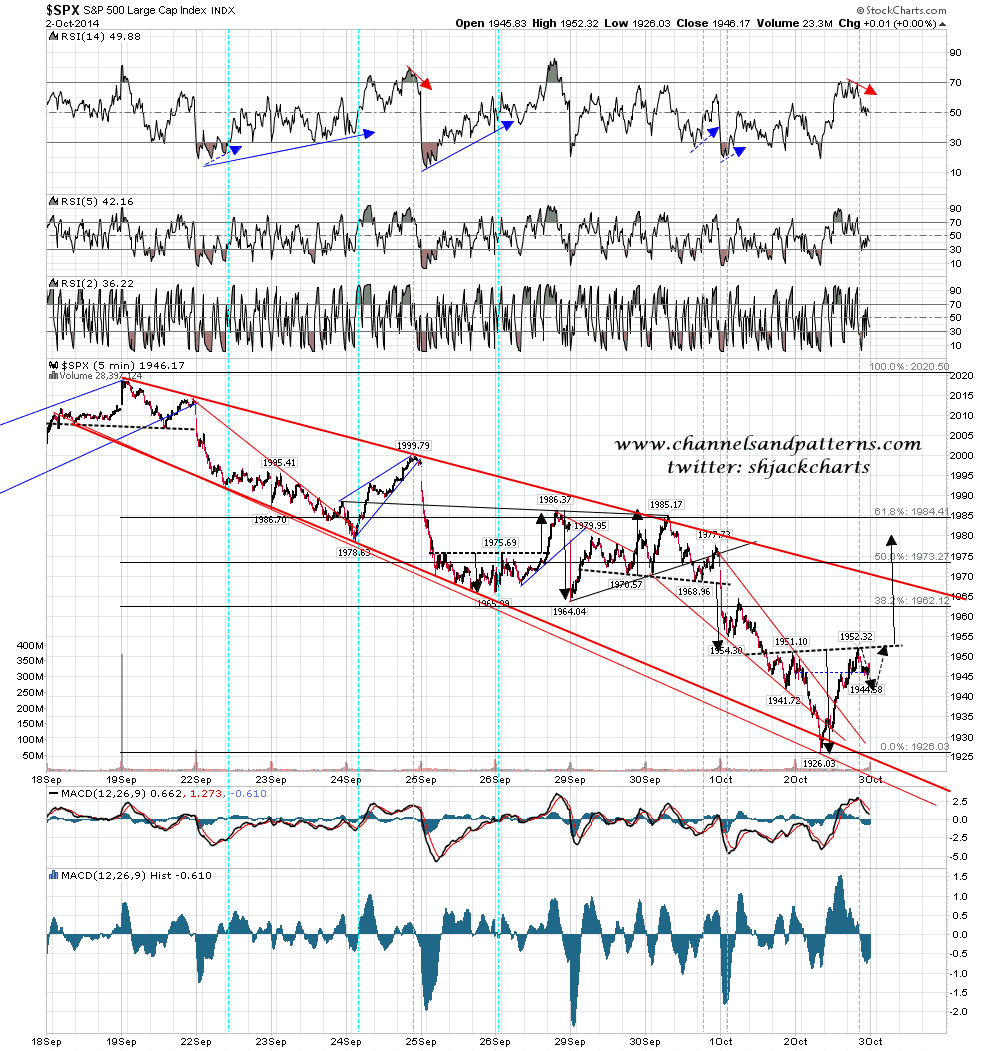
I posted the chart below on twitter last night, and that shows SPX making the double-top target at 1937.70, then underthrowing falling megaphone support before rallying hard to form a nice looking IHS targeting the 1980 area.
I have to say I wasn’t wild about the low, which was in the right area but unusually didn’t show positive RSI divergence on any timeframe, but as long as the IHS breaks up today I’ll be taking that 1980 target seriously, and would note that the 50 DMA is now at 1975, and the 61.8% fib retrace and the daily middle band are both currently at 1985. This target would be a reasonable rally target and this would clear the pattern setup nicely for the next and likely much larger move down. SPX 5min chart:
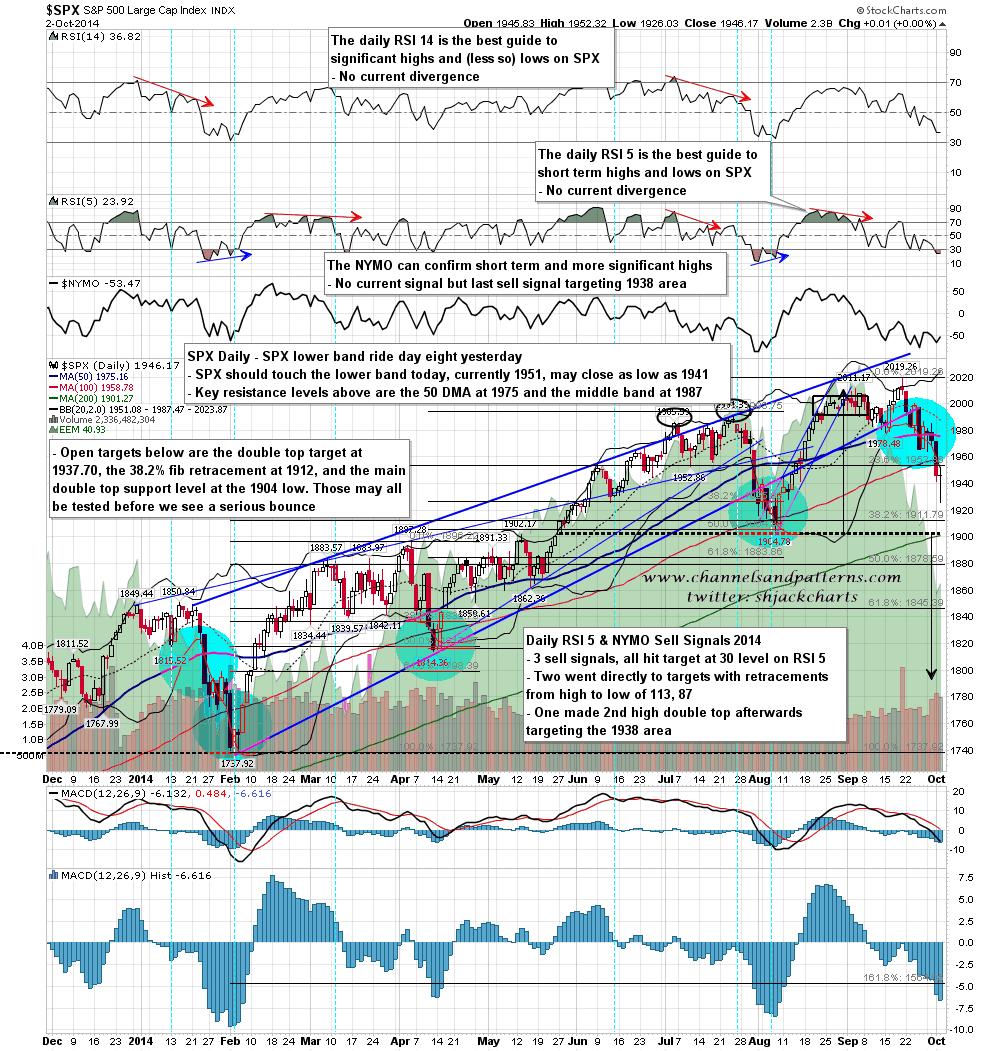
Before SPX can test the middle band however, it must first recover over the lower band, and even after a 21 handle rally off the low yesterday, SPX closed five points under the lower band yesterday for the eighth day of this lower band ride. If SPX can break over the lower band and the IHS neckline today then the levels to watch are falling megaphone resistance in the 1970 area, then the 50% fib and 50 DMA at 1973-5, the IHS target at 1980, and the 61.8% fib and middle band at 1985. 1985 would be my preferred target, with a very serious possibility that the rally high would open and close the day under the 50-DMA at 1975. SPX daily chart:
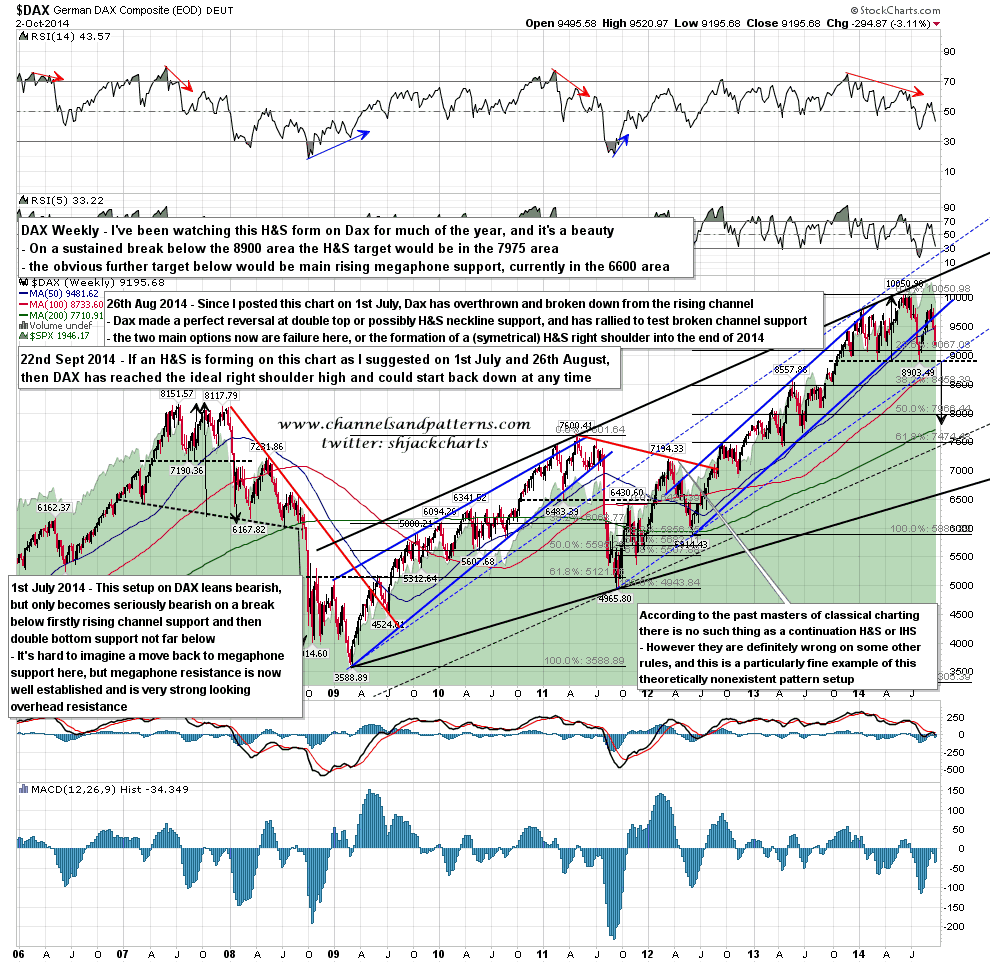
Draghi was talking about European QE yesterday, and as has been the case for a couple of years now, was talking about bold moves in the future, while delivering little at present. He may or may not be sincere about delivering QE in Europe, but regardless of that the setup on DAX here looks toxic, with the H&S that I have been following for much of the year nearing completion, and the obvious target on a neckline break a long way below. DAX weekly chart:
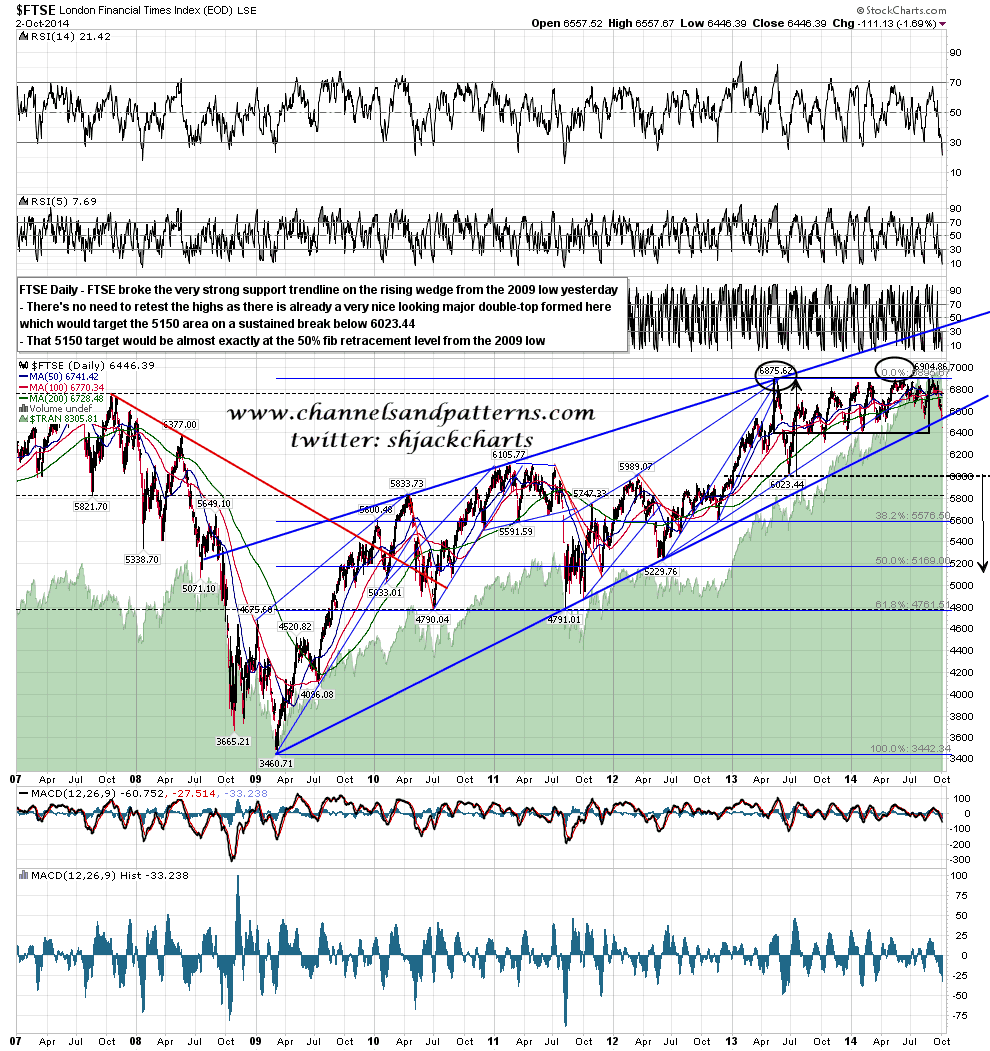
FTSE is only in a marginally better state, and actually broke the strong rising wedge support trendline from the 2009 low yesterday. There’s no need for a retest of the highs as there is a very nice looking major double top forming and this chart reminds me strongly of the Yen chart I posted in late 2012 just before it fell 25% in three months. Not saying that will happen here, but it might. FTSE weekly chart:
On SPX we are still working the falling megaphone. the obvious next target is falling megaphone resistance in the 1970 area, and on a break up, the end of the first wave down would be confirmed and I’d be looking for the 1980-5 area.
Is there a chance that SPX might just keep on going up, and that this retracement has already finished much earlier than I expected. Yes, there is always a chance. I’d give the bulls extra credit for the number of nice bear setups that they have demolished in the past few years and put that possibility at a probably very overgenerous 20%. It has been a bad mistake to ever write the bulls off in the last few years, and I am not writing them off here.
Meantime though, everything is proceeding much as expected, and if the IHS breaks up today then that should follow through to the upside. If the IHS doesn’t sustain a break up then SPX may well move down again to make a better technical low than yesterday’s low. If so my risk marker is at 1940 SPX. If we drop below that level, there will be a serious risk that the rally will have failed and that at least a test of yesterday’s lows is imminent.
