
The following two Year-to-date Daily charts show how much the Russell 2000 Index is lagging behind the Dow 30, S&P 500, and Nasdaq 100 Indices.
The first chart is a simple comparison which shows the percentage gained for each from the beginning of this year.
Small-Cap stocks have, basically, spent a considerable amount of time in negative territory, while trading sideways from the beginning of this year; meanwhile, Technology stocks have been the favourite, followed by stocks in the SPX and the INDU.

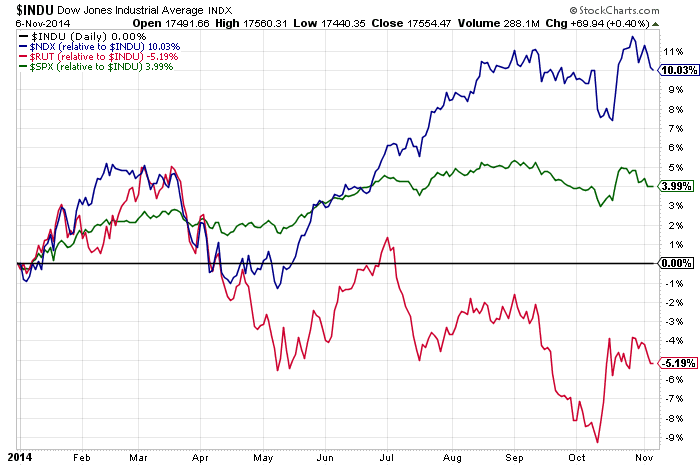
The second chart shows the percentage-gained/lost for the RUT, SPX, and NDX relative to the INDU (which is shown as a horizontal line at the zero level).
As you can see, Small-Cap stocks have been in a downtrend since March in comparison with the Dow, while the NDX is still in uptrend, and, although the SPX is still slightly ahead of the INDU, it has made a lower swing high recently, but has yet to make a lower swing low.
Unless buyers step into Small-Caps with any conviction to slough off any risk-taking concerns and to re-enforce any continued support for U.S. equities, we may see some further weakening creeping into the SPX, with some profit-taking commencing in the NDX.
From the RUT:RVX Daily ratio chart below (note: the RVX is the Volatility Index of the Russell 2000), it would appear that the price level of 60.00 must be held to signal potential renewed buying in the Russell 2000 Index.
65.00 would be the next resistance level to be overthrown, followed by 70.00, 75.00, and, finally, 78.00. We’d also need to see a new swing high established on the Momentum indicator; otherwise, any buying may be quite short-lived. This is one chart to watch in relation to the above two charts to confirm the conviction and momentum of future price action in Small-Caps.

