
The tape didn’t actually move much yesterday, but nonetheless the bears had a very decent technical day. On SPX It looks very much as though the possible falling wedge I posted yesterday morning may be in play, and if so that is very significant, because in this context that would be an EW ending diagonal, a terminating pattern that in turn is the final move within the much larger rising wedge / ending diagonal from the October low. I’m very much liking the odds of putting in the spring high in this area.
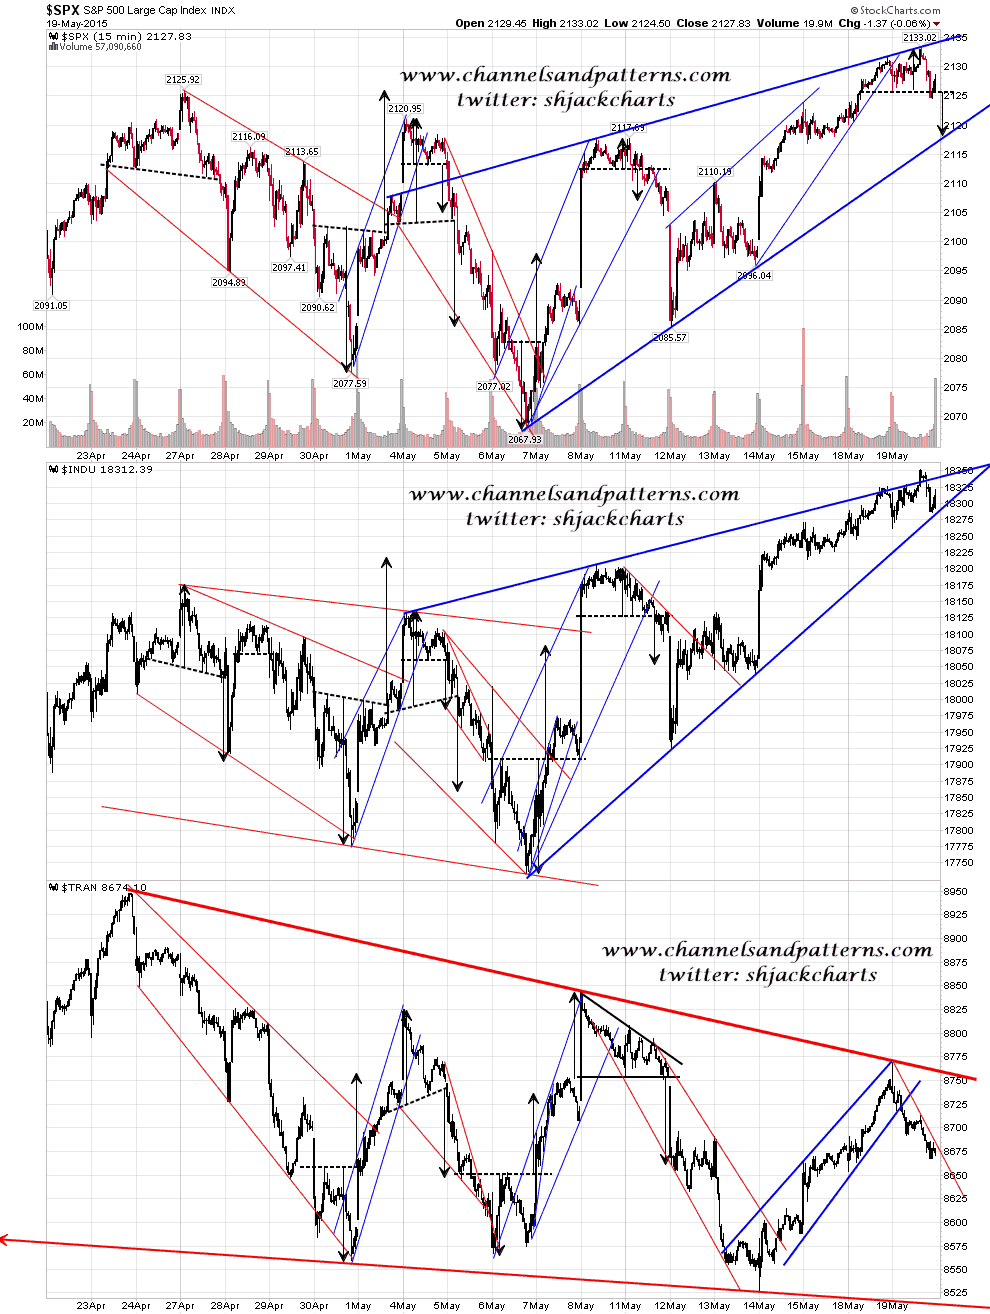
Indices are looking increasingly bearish here. The appear to be rising wedges on SPX, INDU, RUT and NYA, and at the time of writing only SPX and RUT haven’t broken rising support from the lows on 6th May. The short term high may not quite be in yet, but it looks close, and I now have SPX on both 15min and 60min RSI sell signals. What I would like to see next is for SPX to test rising wedge support to confirm or break it, and that’s currently in the 2118 area with my trend health bellwether the 60min 50 MA slightly below at 2115. Scan 3x SPX INDU TRAN 15min charts:
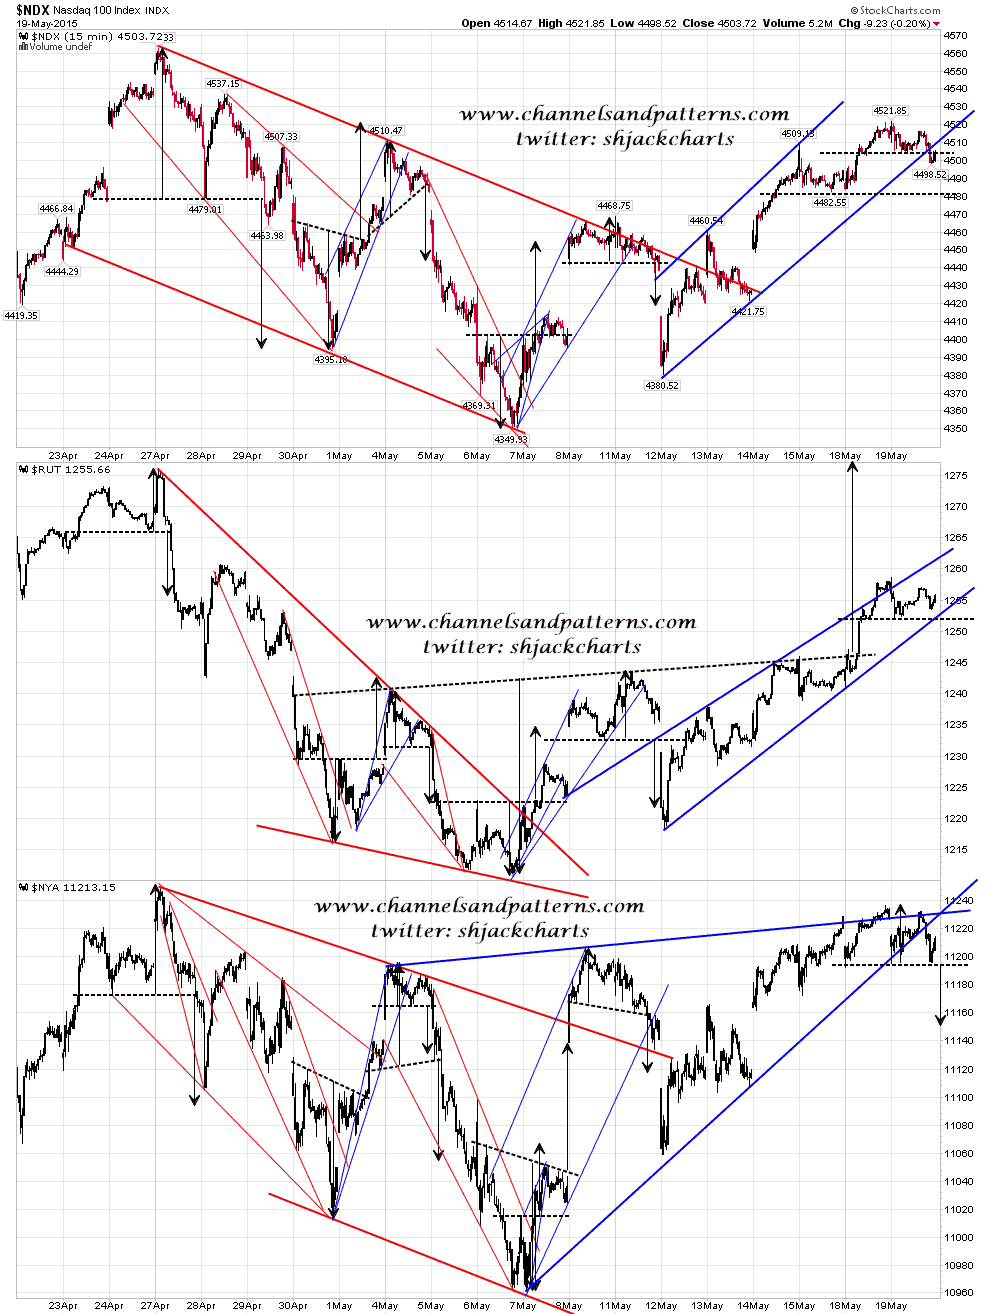
Scan 3x NDX RUT NYA 15min charts:
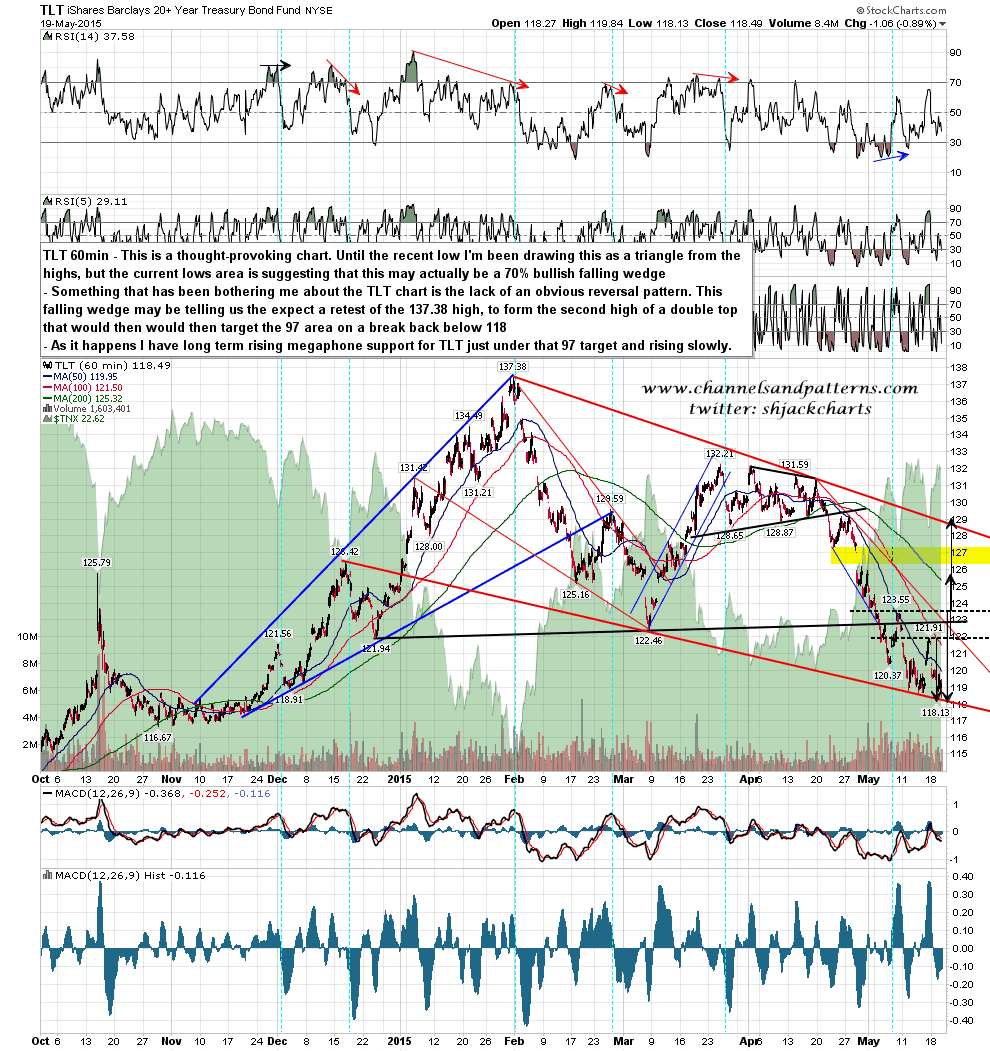
I’ve been giving the setup on bonds here some thought and while I am still expecting the current low areas on TLT and ZB to hold, and for a strong rally to happen here, I’m wondering now whether that rally might run all the way back to a retest of the 2015 highs to establish the second high of a double top. There are a couple of reasons for this. The first is that I’ve not been that happy about the lack of an obvious topping pattern on the bonds chart, particularly TLT. The second is that the current TLT low makes a perfectly classic lower trendline for a falling wedge. The resulting double top would also target the 97 area, which is the lower trendline on the huge long term rising megaphone on TLT which is the pattern that I used to call the 2015 high on TLT. Altogether this would be a technically ideal scenario from my perspective and it could happen. You can see that chart from my post on 3rd February here.
Particularly with expecting serious turbulence in the equity markets in the near future I am very much wondering about the possibility that bonds may retest the 2015 highs on this setup and the flight to safety trade. We shall see. TLT 60min chart:
We may see a new all time high made on SPX today and if bulls can follow that through into the close then this picture might start looking less bearish. As it stands though the next short term high looks close and I like the odds for that being both the spring and 2015 high on SPX. I’m leaning short today and looking for a test of the 2118 level on SPX. The stats for tomorrow are firmly bearish and if bulls can’t impress today I think we might well see SPX trend down tomorrow.
