
Obviously the bears have had serious issues achieving anything recently, and yet again today they have delivered their signature matching lows at the current lows of the day, but there is a decent chance that there is at least some more retracement coming in the next day or two, with all of the hourly charts on SPX, NDX and RUT currently on RSI 14 sell signals. I’m not expecting anything impressive, and the structure here is suggesting that will be at least one more leg up after that, so if seen this larger retracement should be a dip buying opportunity into new all time highs on SPX and NDX, and possibly on RUT as well.
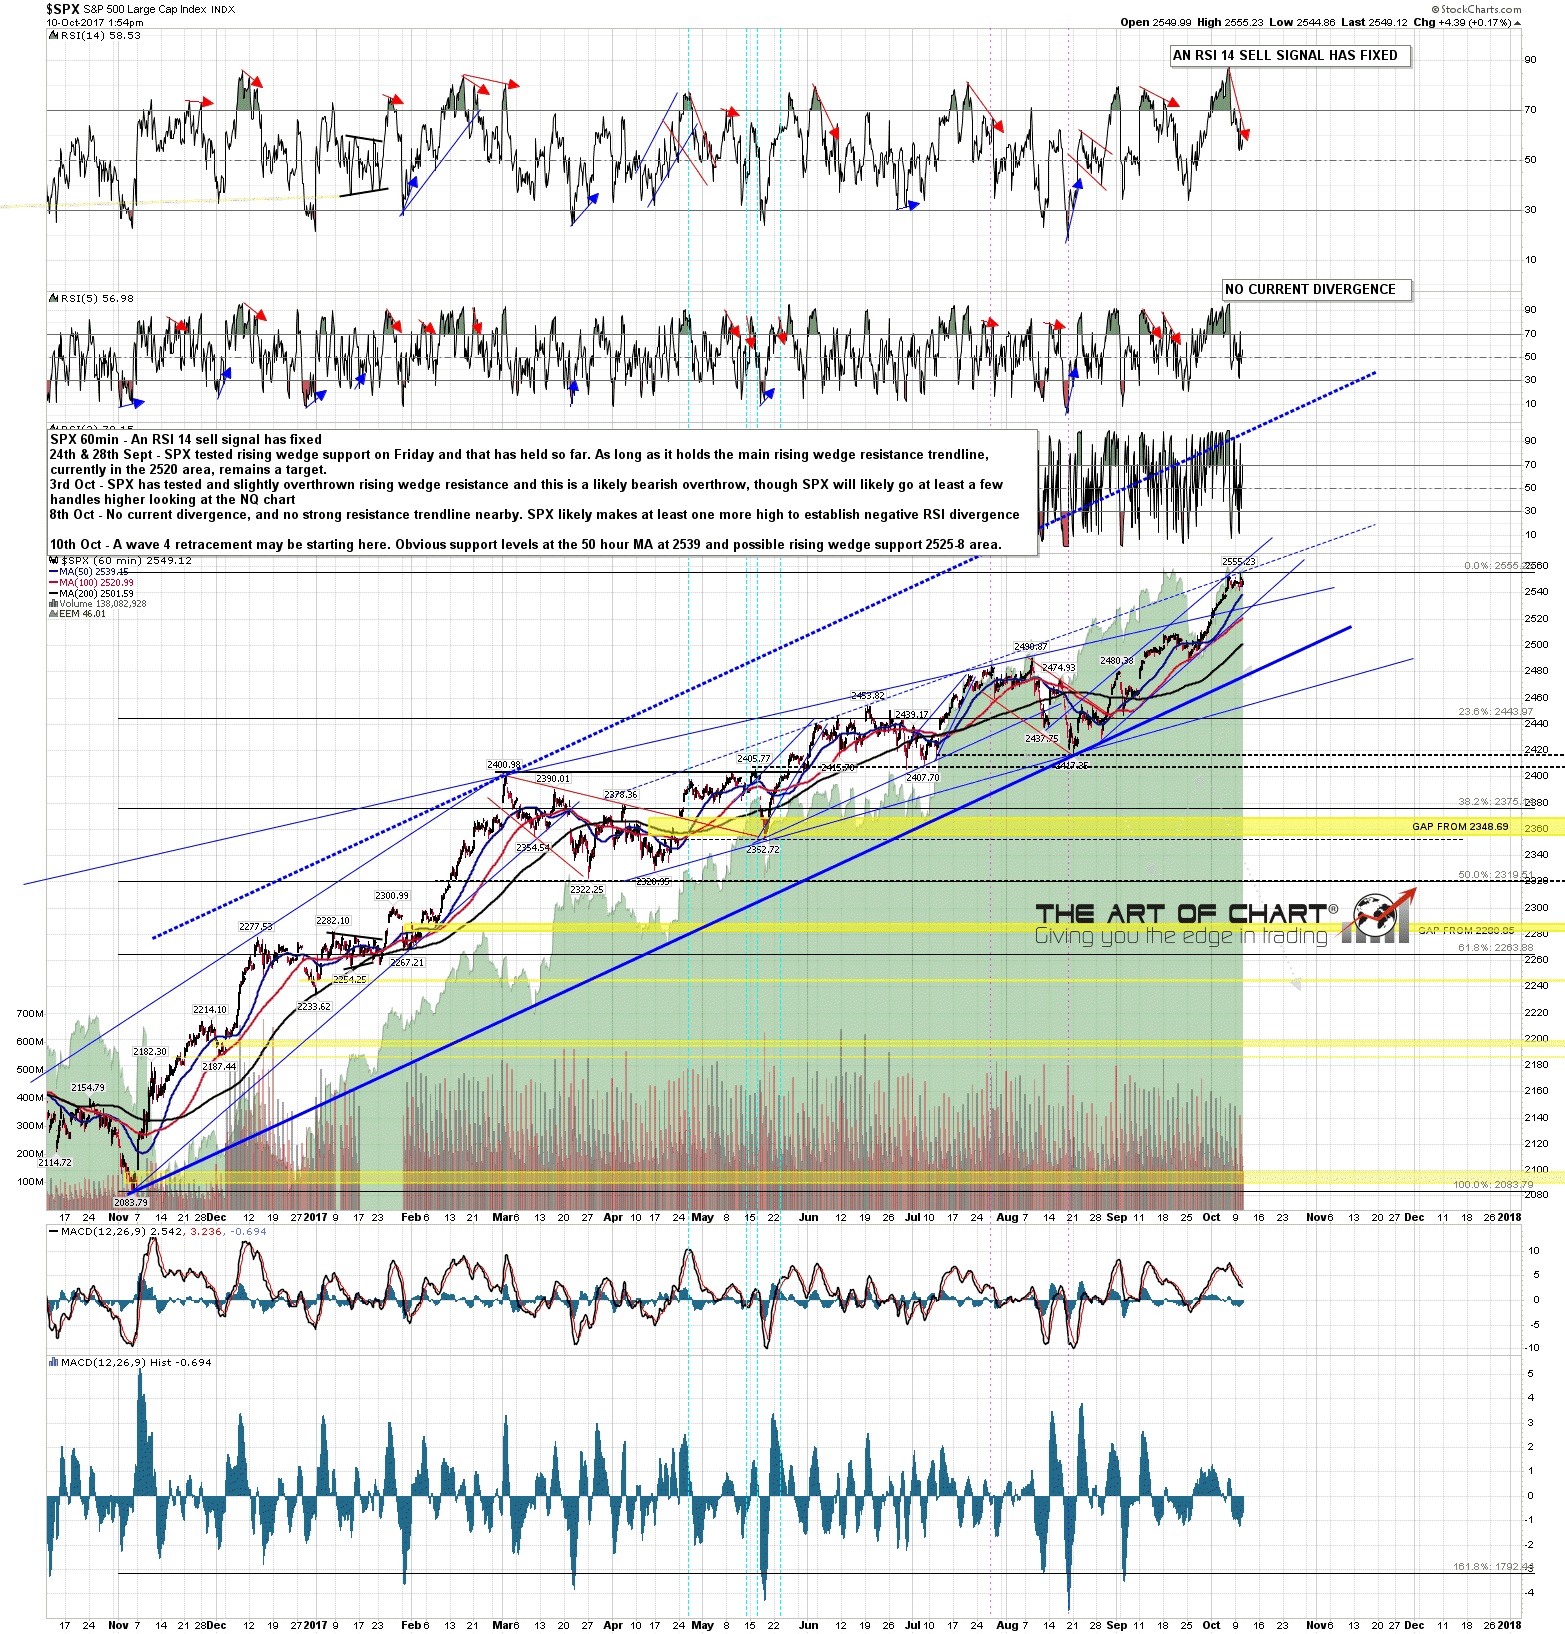
On SPX the obvious support levels are the 50 hour MA in the 2540 area and possible short term rising wedge support in the 2525-8 area. SPX 60min chart:
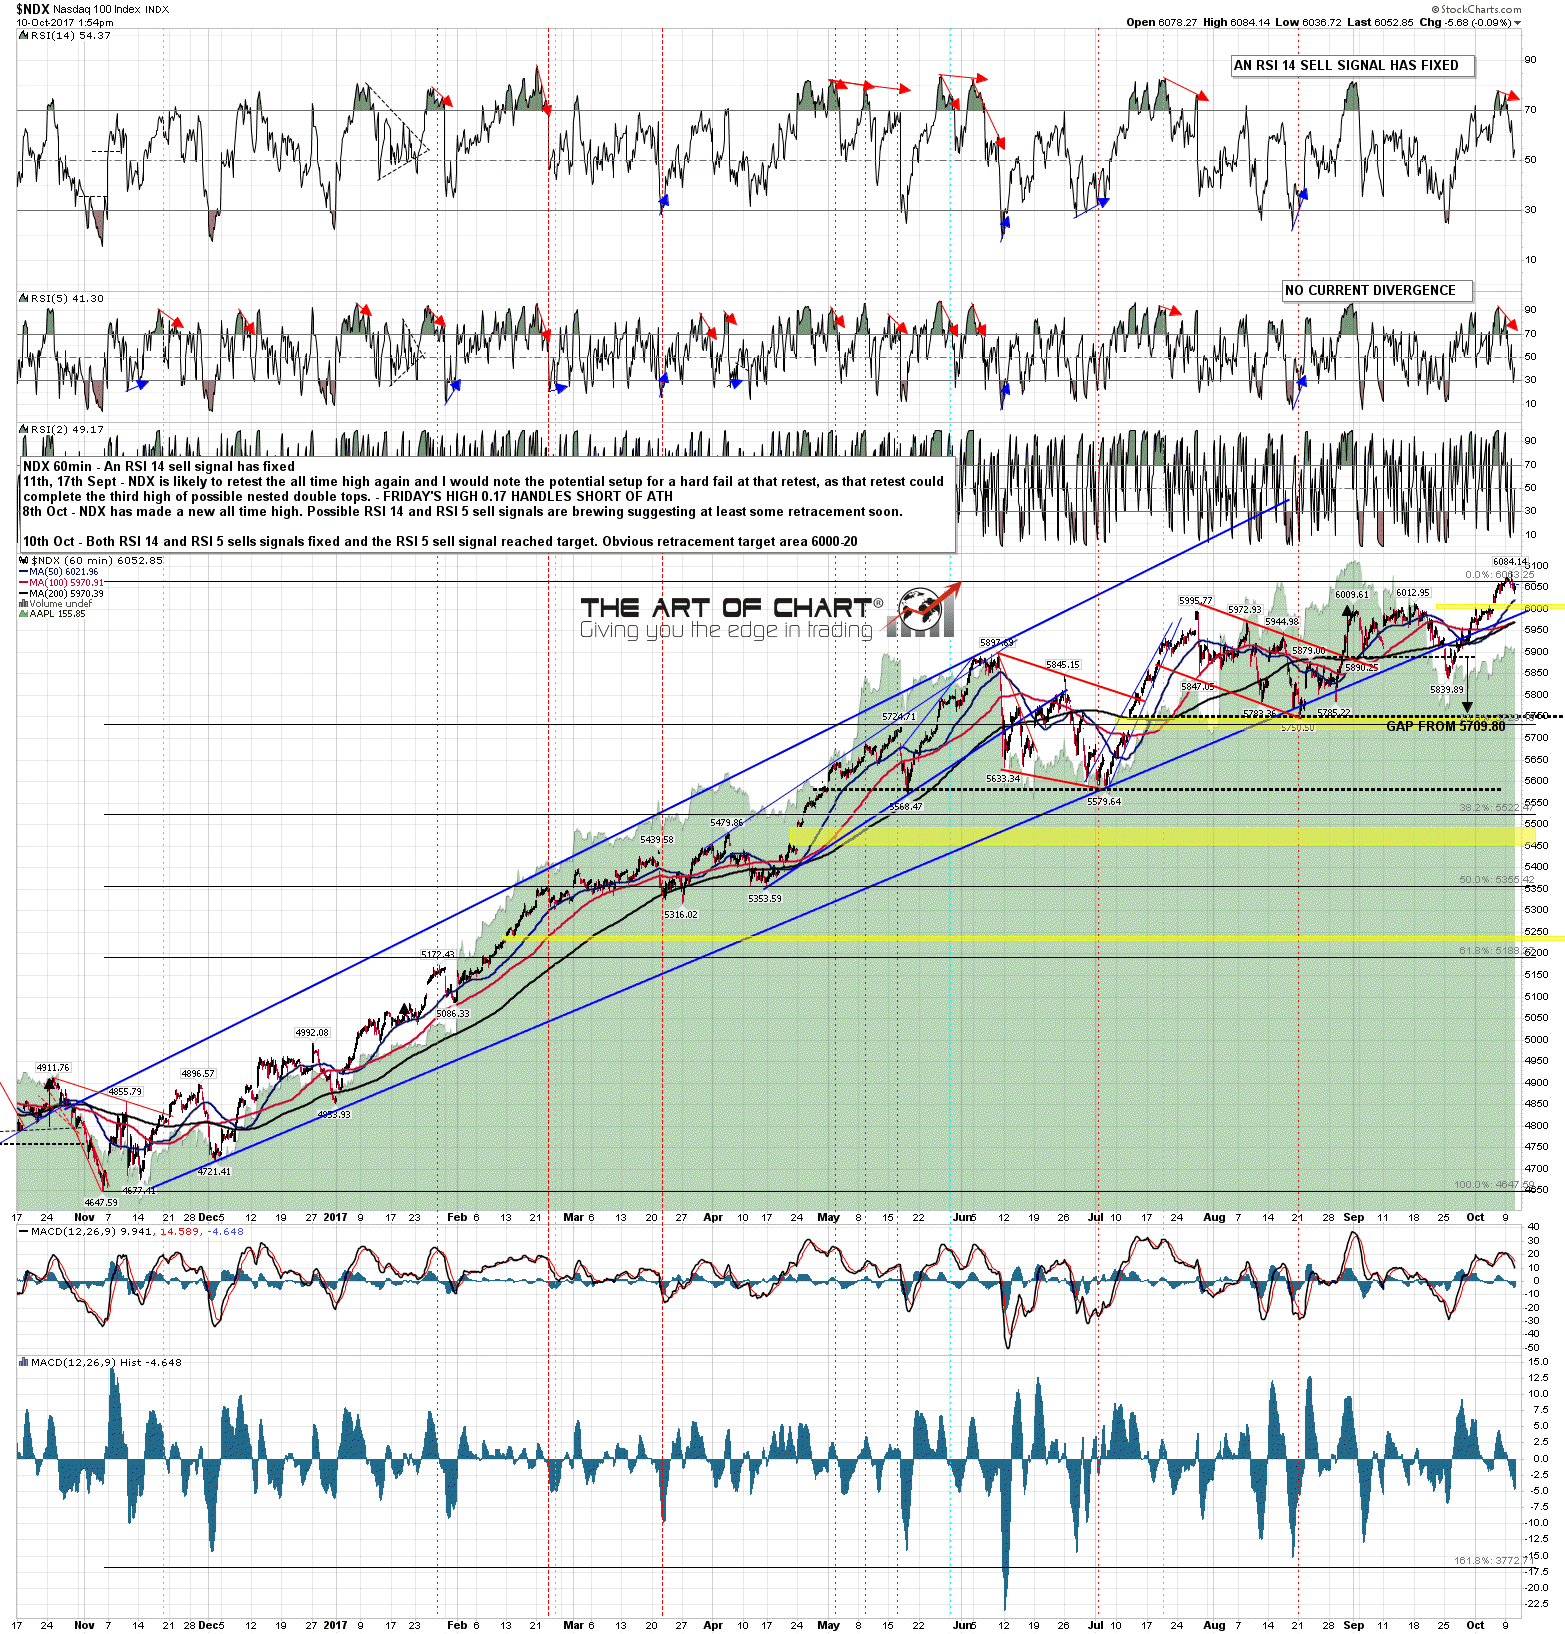
The obvious support area on NDX is the 6000-20 area above the breakaway gap into these new all time highs. NDX 60min chart:
There is a possible small double top here on RUT and a decent looking possible rising channel. RUT has been trading ahead of the other two indices I think so we may not see another new all time high on RUT on this move. RUT 60min chart:

The ES, NQ and TF futures charts below were done an hour before the RTH open for Daily Video Service subscribers at theartofchart.net. If you are interested in trying our services a 30 day free trial is available here.
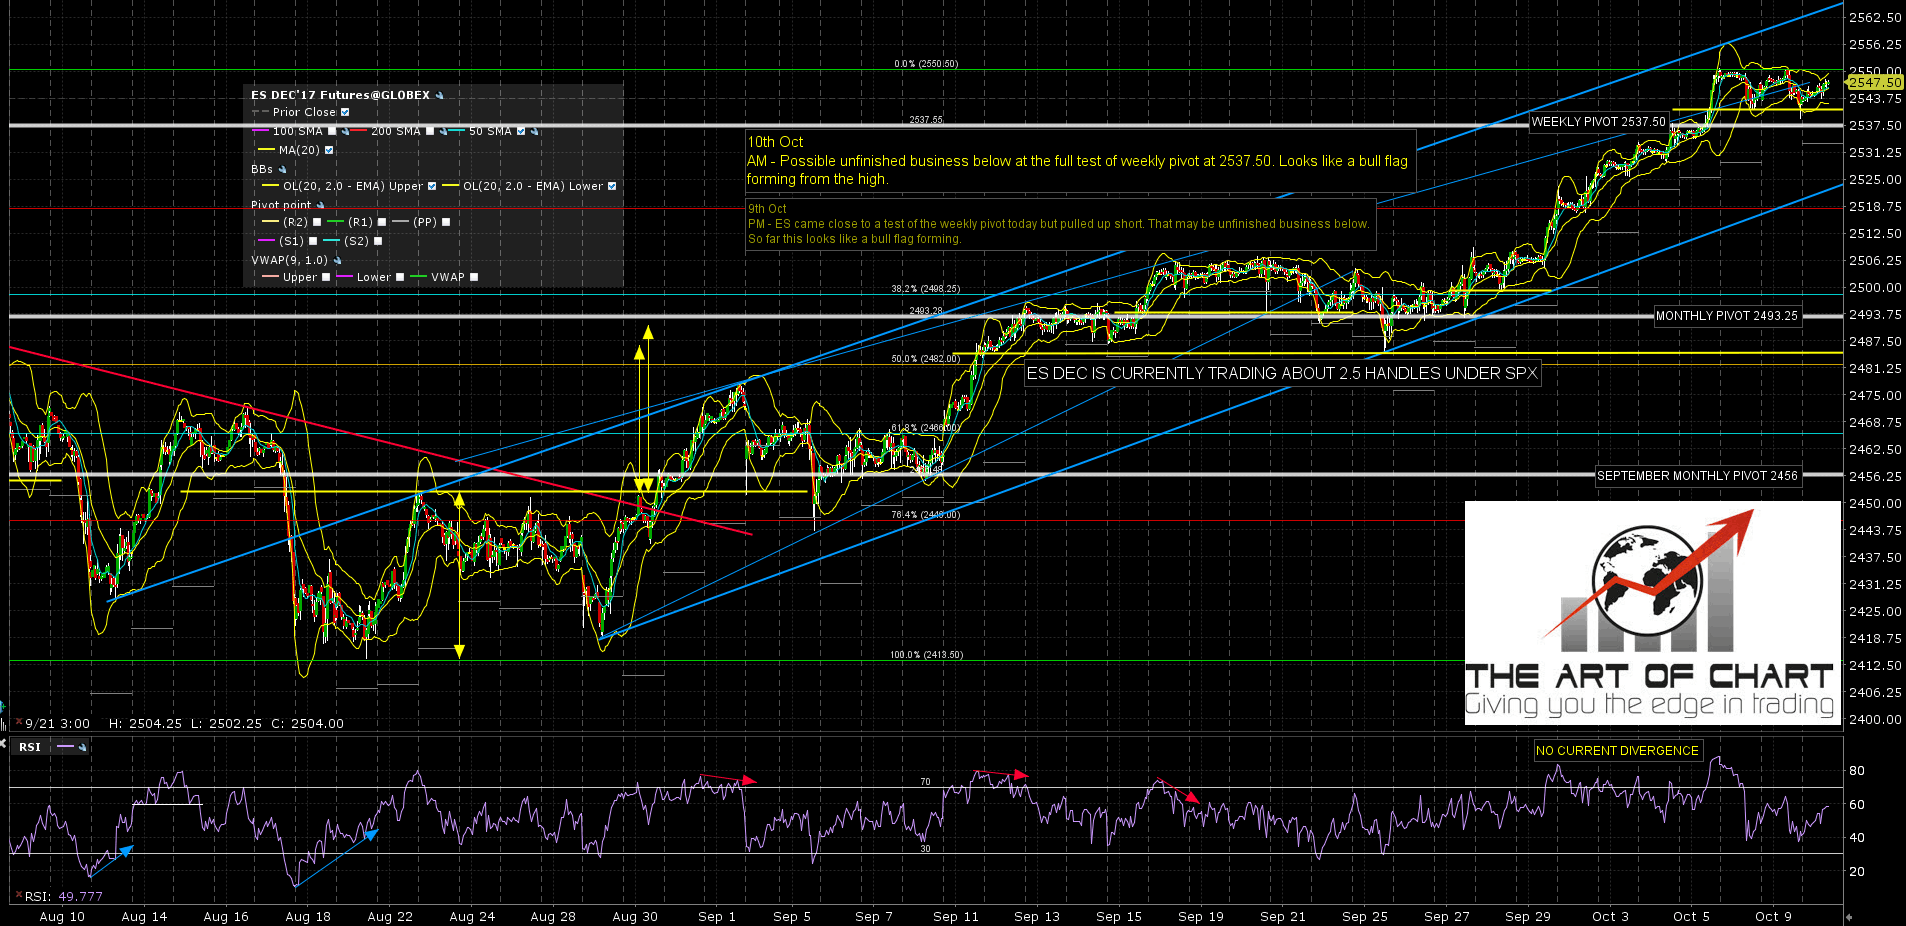
I have the obvious rising resistance on ES currently in the 2566 area. I’d be redrawing that if we were to see a test of rising support, currently in the 2524 area, before a hit of that resistance trendline. ES Dec 60min chart:
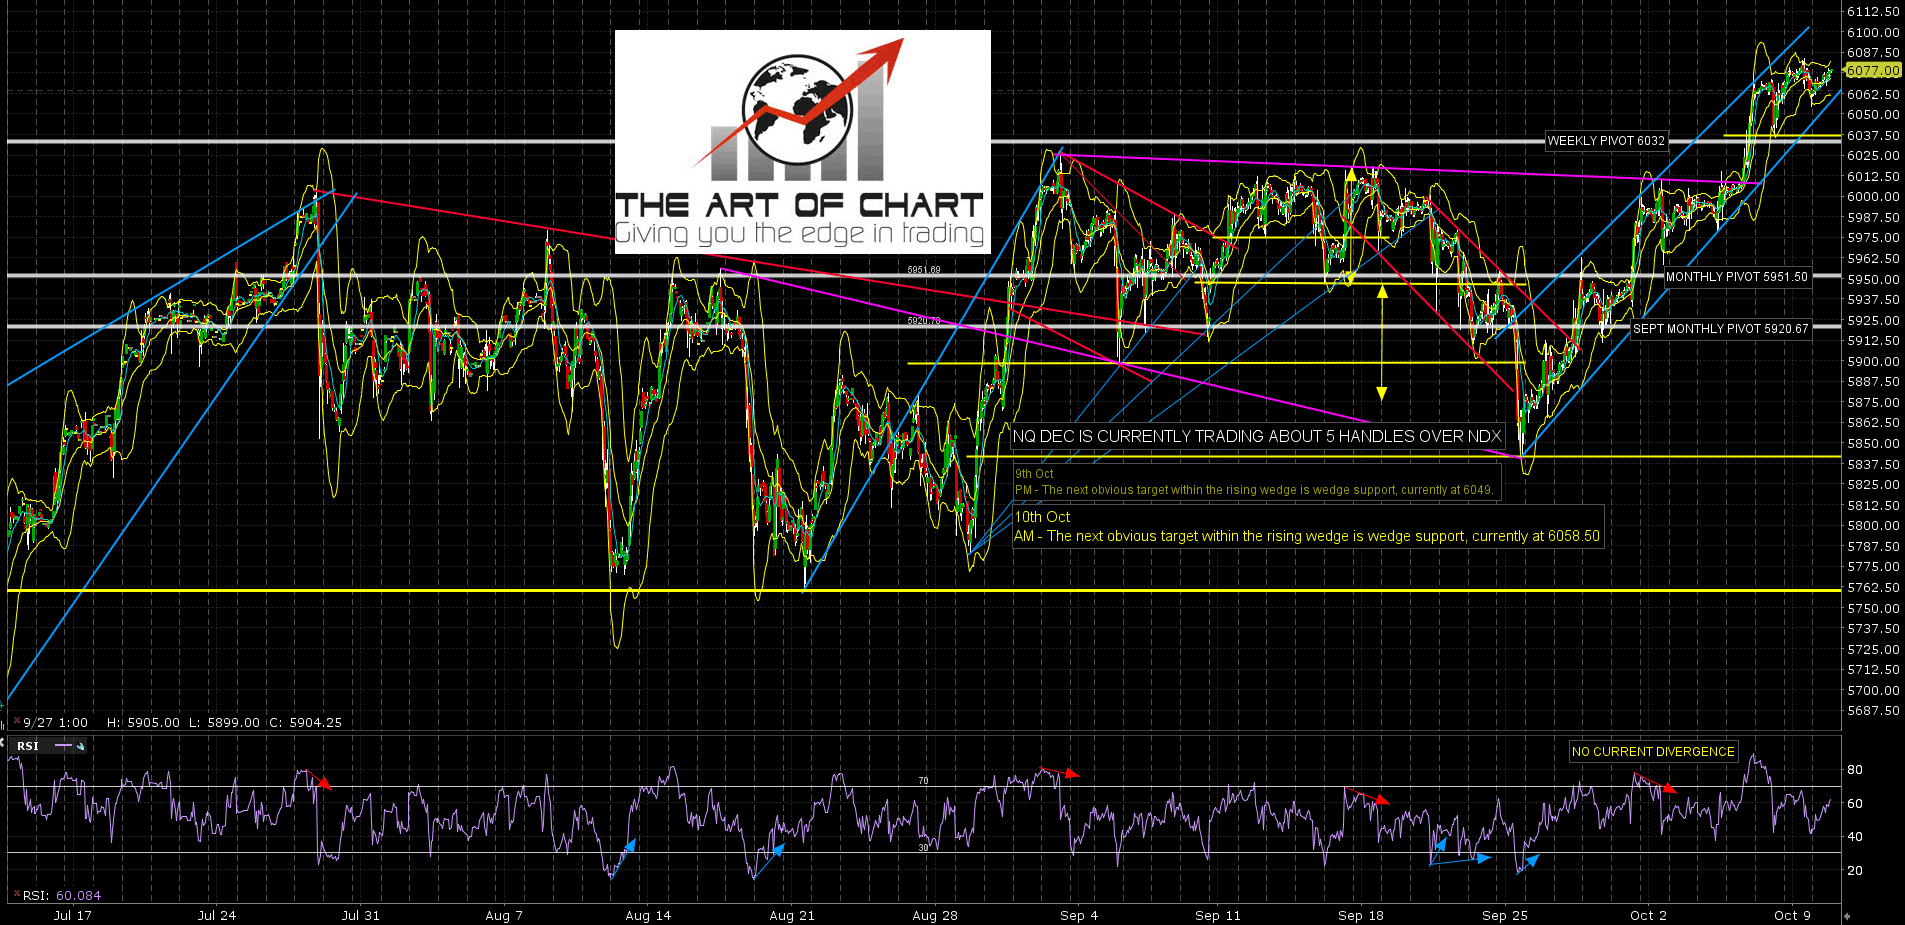
NQ has broken short term rising support since this morning and may be putting in the right shoulder on a small H&S that on a break and conversion to resistance of weekly pivot at 6032 would look for a target in the 5987 area. NQ Dec 60min chart:
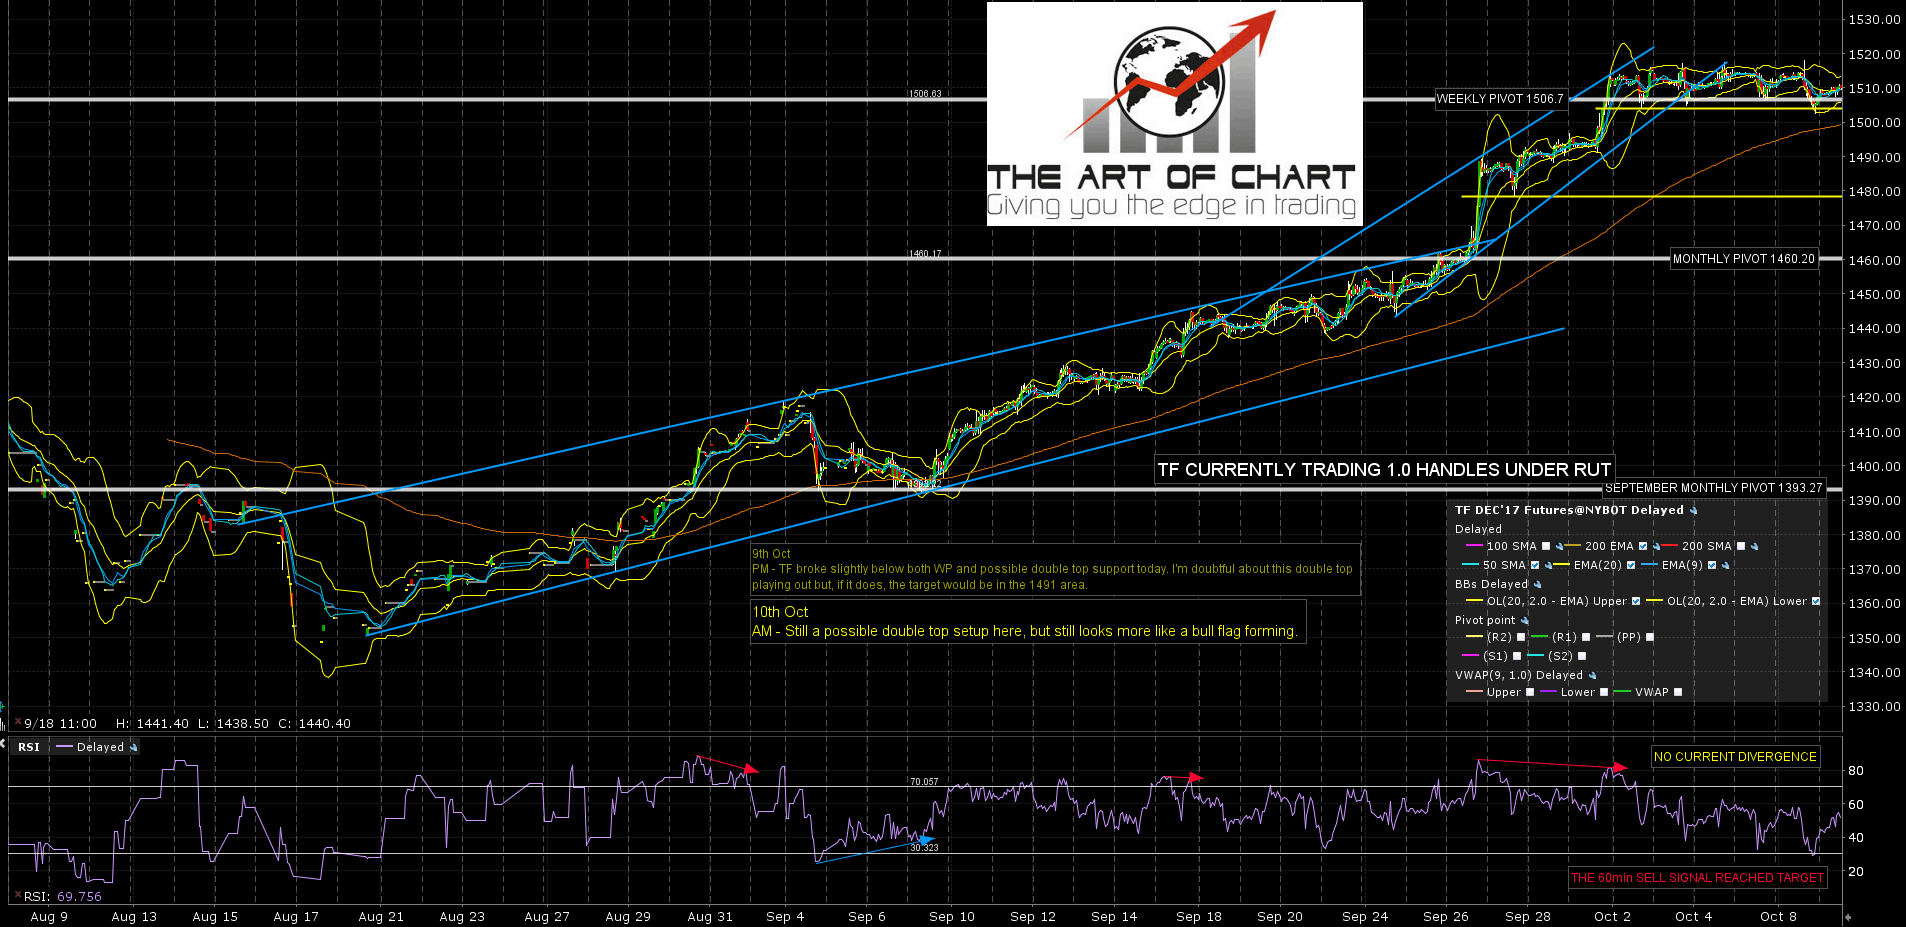
There is another possible H&S forming on the TF chart and on a break and conversion to resistance on the TF weekly pivot at 1506.7 that would have a target in the 1490 area. TF Dec 60min chart:
Stan and I are not looking for a possible swing higher here. The structure strongly suggests another leg up before we see that. Any decent dip here, if seen at all, is likely a buying opportunity.
