There was a time last year that new features on Slope of Hope and SlopeCharts were happening so quickly that it almost got annoying. I love new ideas, and I love product development, and once we get on a tear, we blast past everyone else.
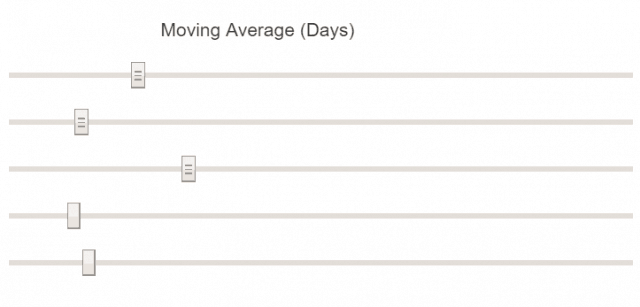
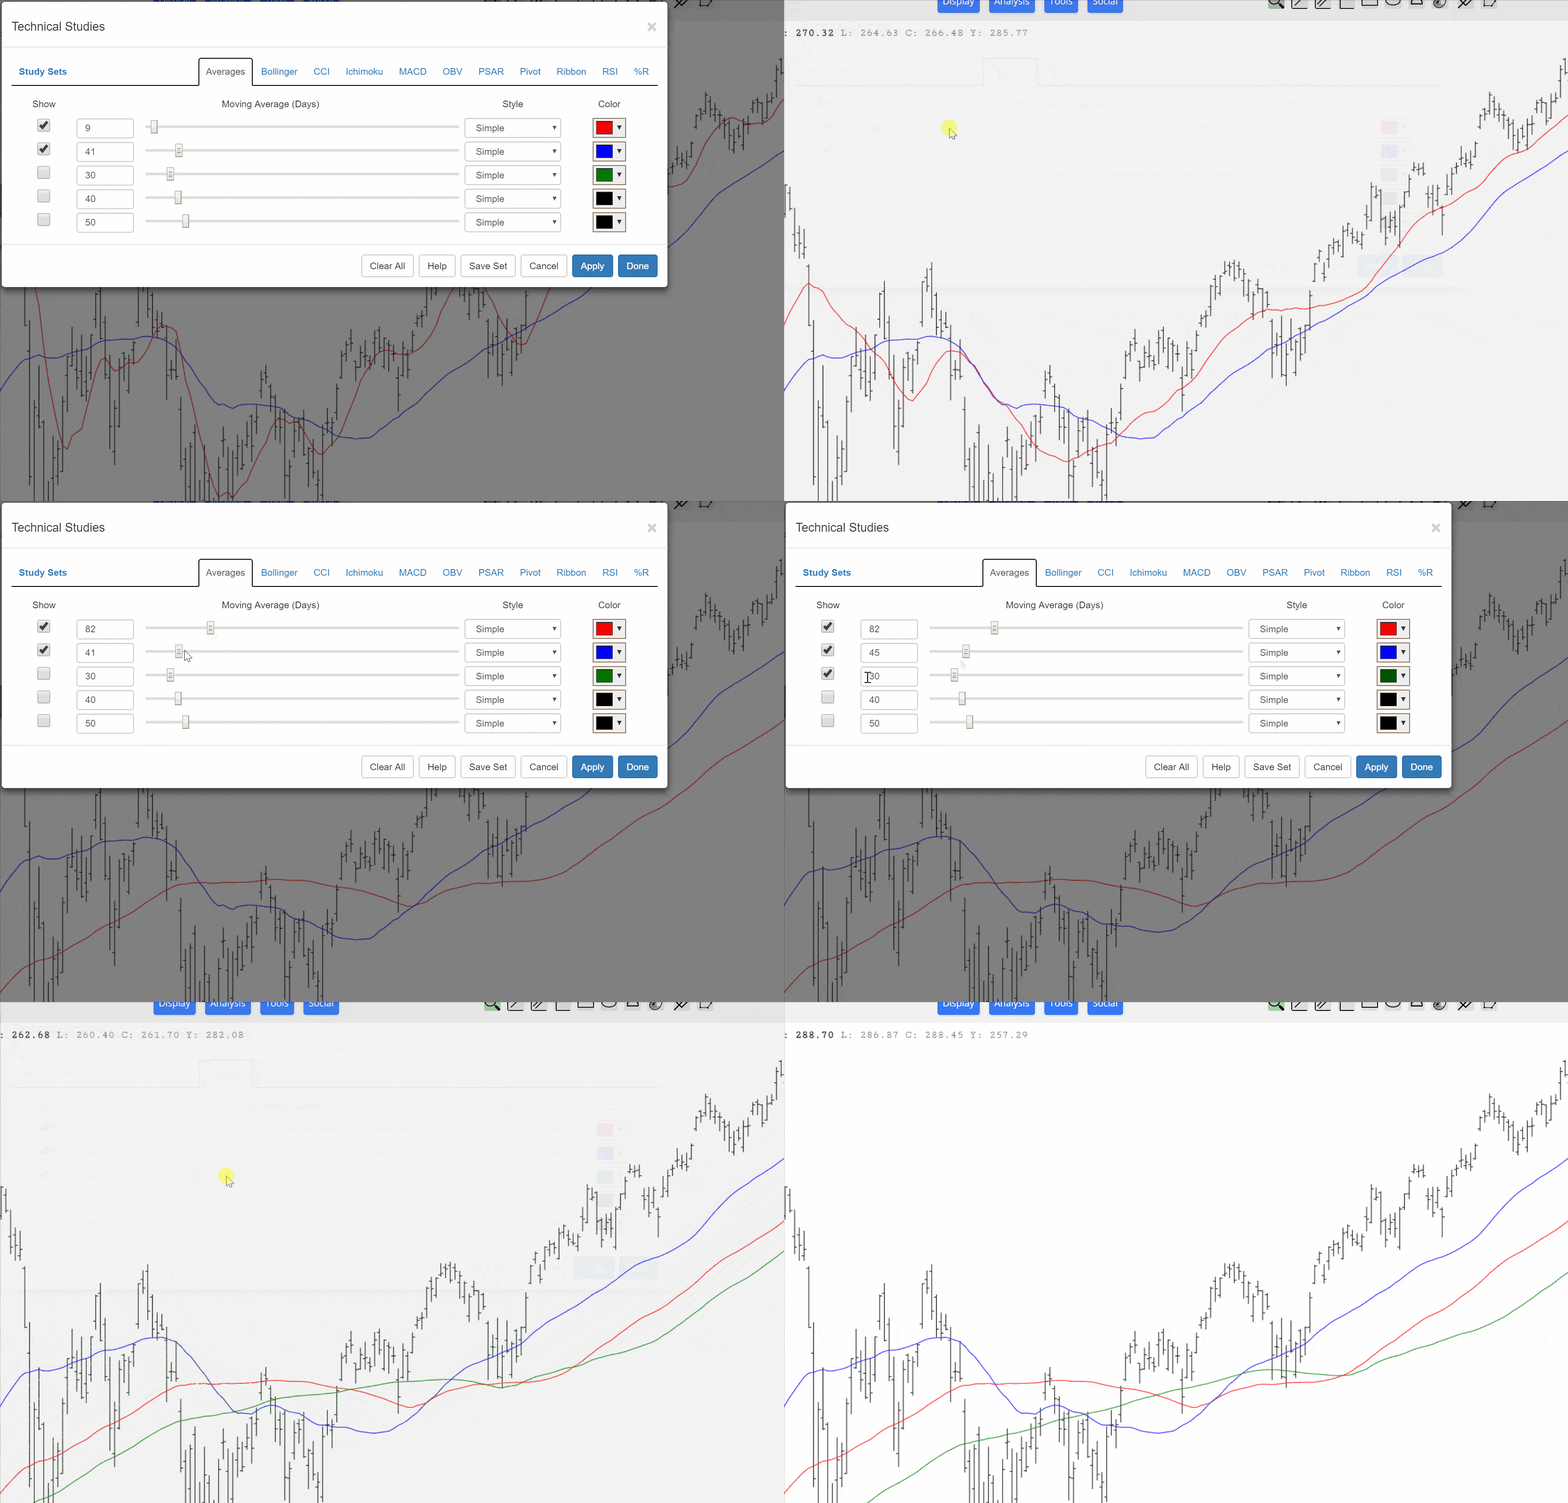
The last few months we’ve been largely stalled, however. That’s going to change, though, starting right this second. What I’d like you to do is fire up SlopeCharts and go to Analysis—>Technical Studies. You will see something new in the dialog box.

This is a nice illustration of how quickly things move. Last night, I was reading one of the books that The Director was nice enough to send me as a Christmas gift. Although it had absolutely nothing to do with the book, as I was reading it, a light bulb popped over my head.
My idea was to create an entirely new real-time method of expressing technical indicators. We started off with moving averages. Take a look at this:

Let me say this: I cannot BELIEVE it took me all this time to think of this idea. I haven’t seen it anywhere else, and if it exists, please tell me, because I am curious. If it doesn’t exist anywhere else, Good God, I guess the rest of the world is just as dumb as me. But I also expect in short order they’ll rip off my idea, just like all the others. Just about every cool feature in modern charting came from Prophet at some time or another.
Anyway, check it out. This is BRAND NEW, and if people embrace it, I intend to extend it to all the indicators. I might write more about this tomorrow.

