
I find this exciting (although I’m a deeply troubled person, so it could be just me). Anyway, looking at the long-term chart of the Dow 15 Utilities, I notice that there are five instances in which prices tagged the red trendline I’ve drawn were all followed by deep and sustained bear markets. Remember to click any chart in a post to make it gigantic.
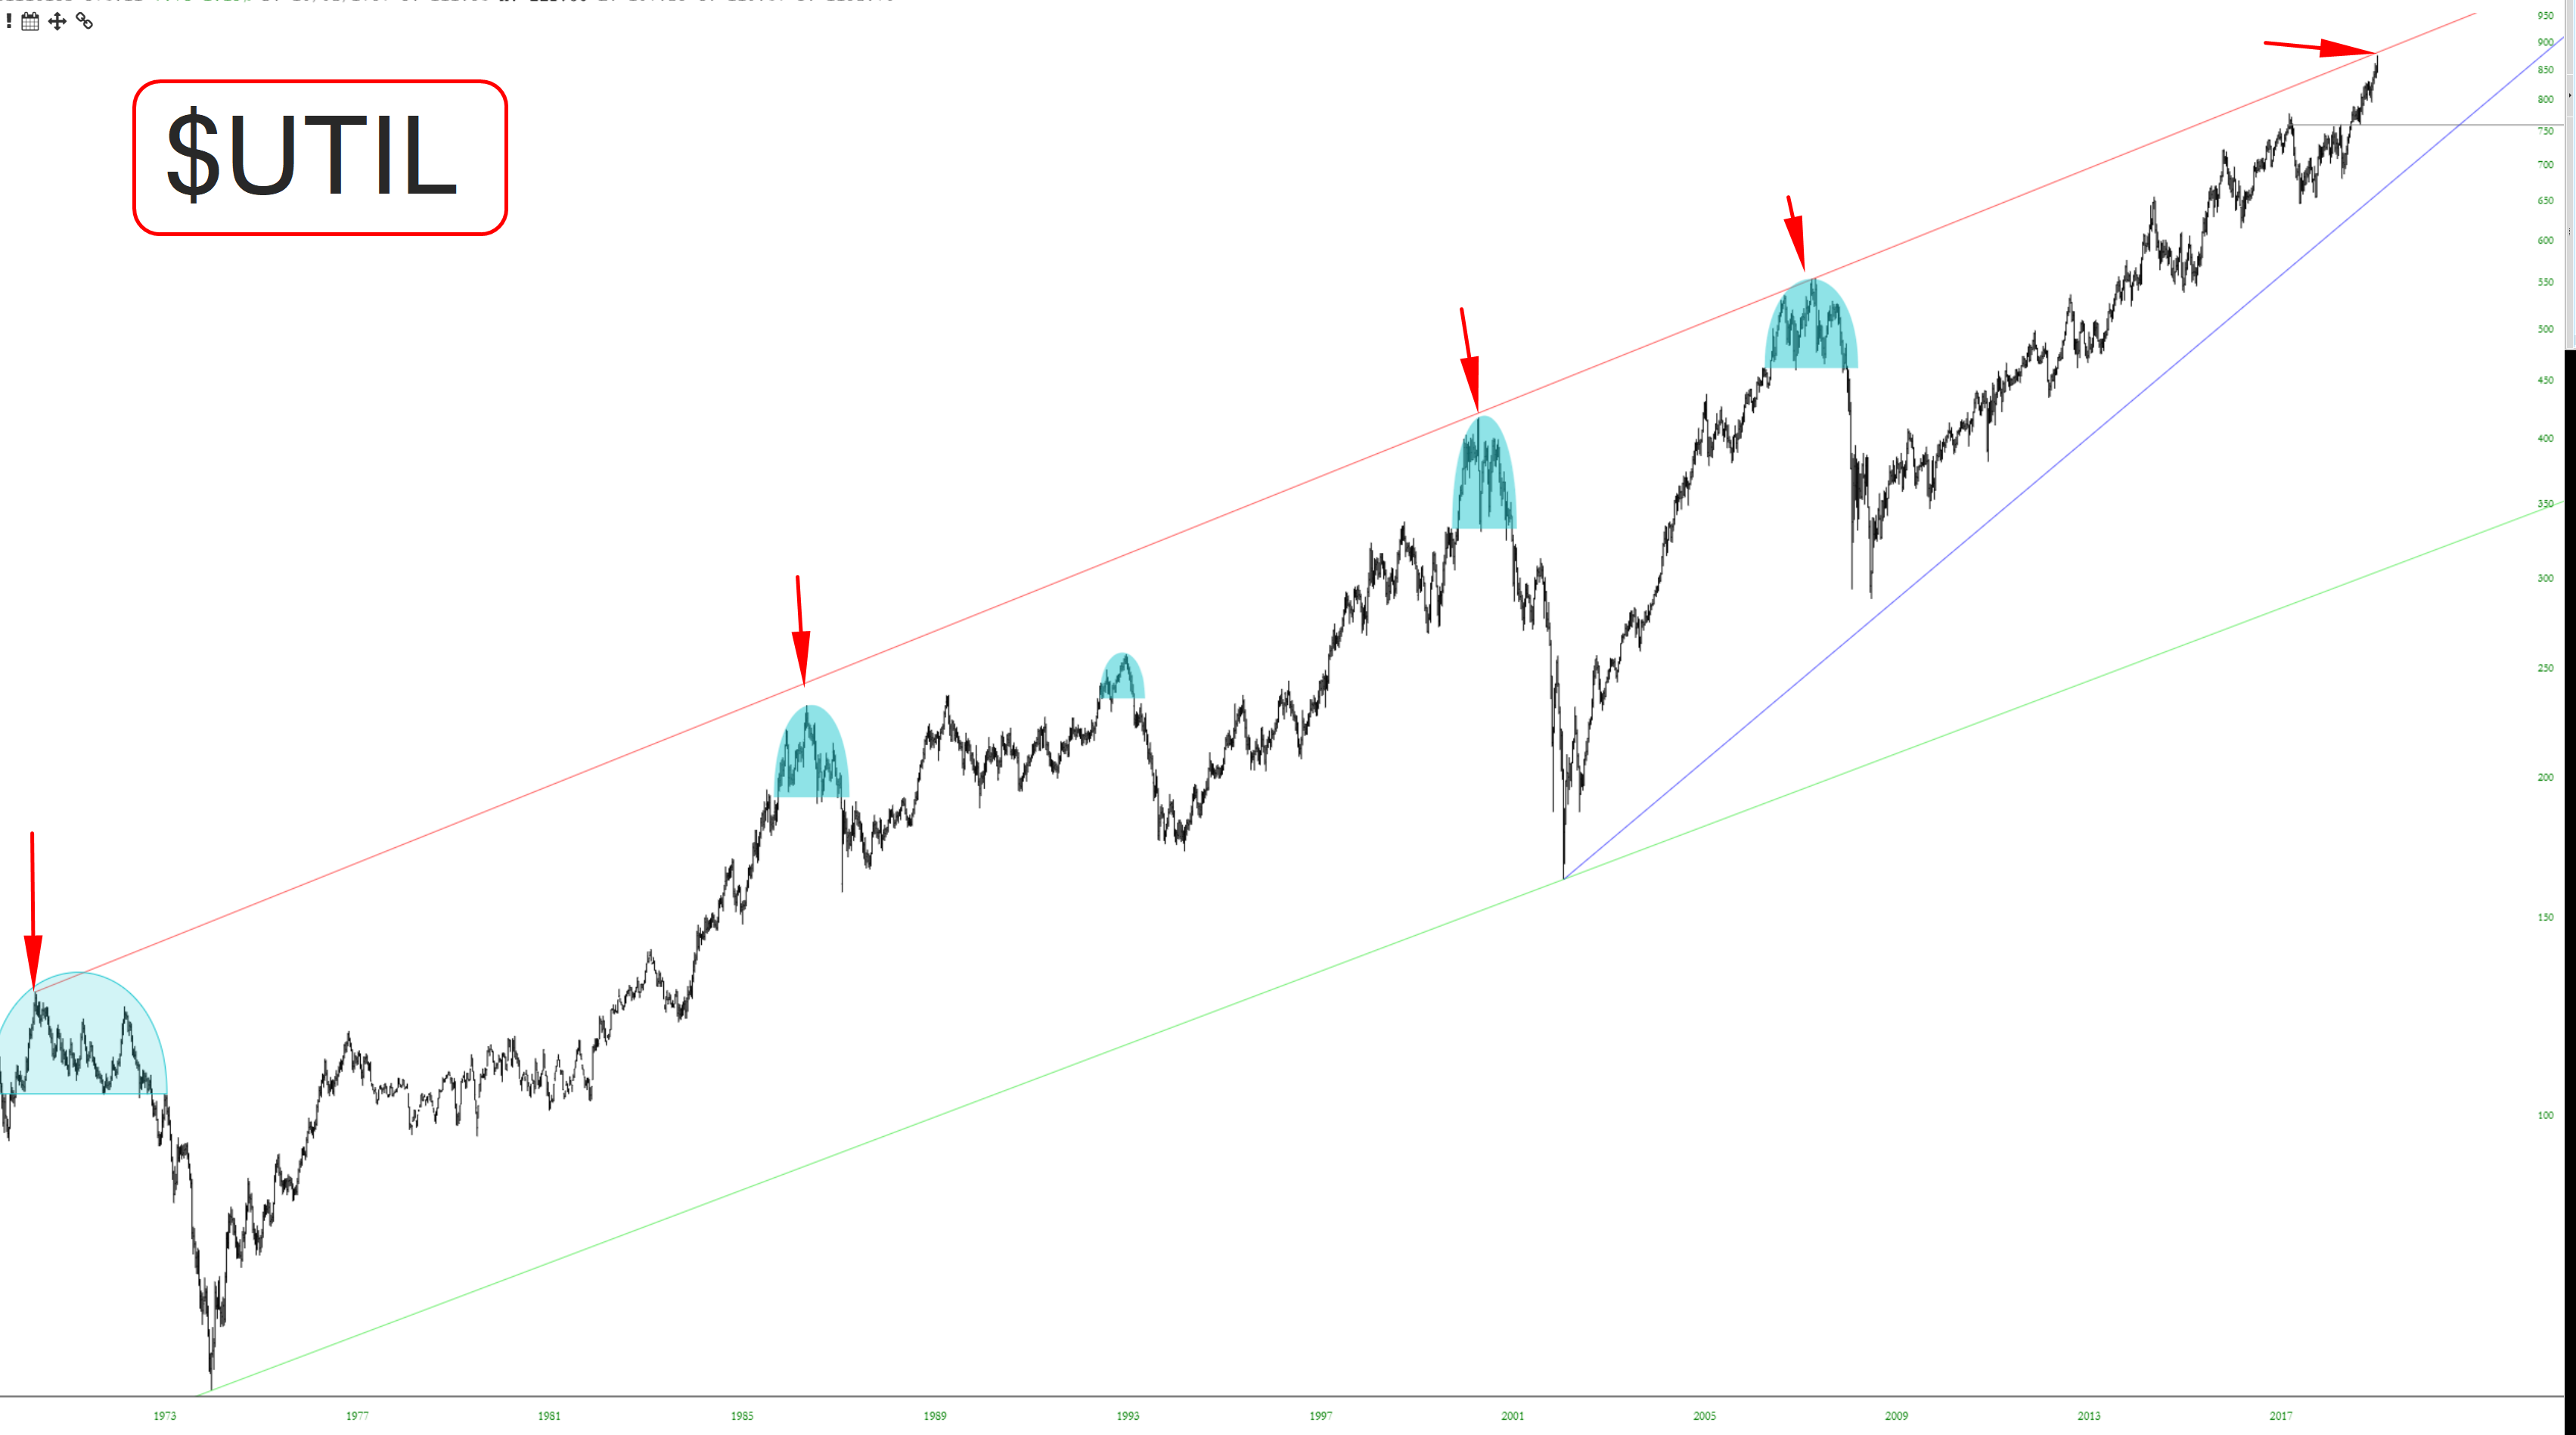
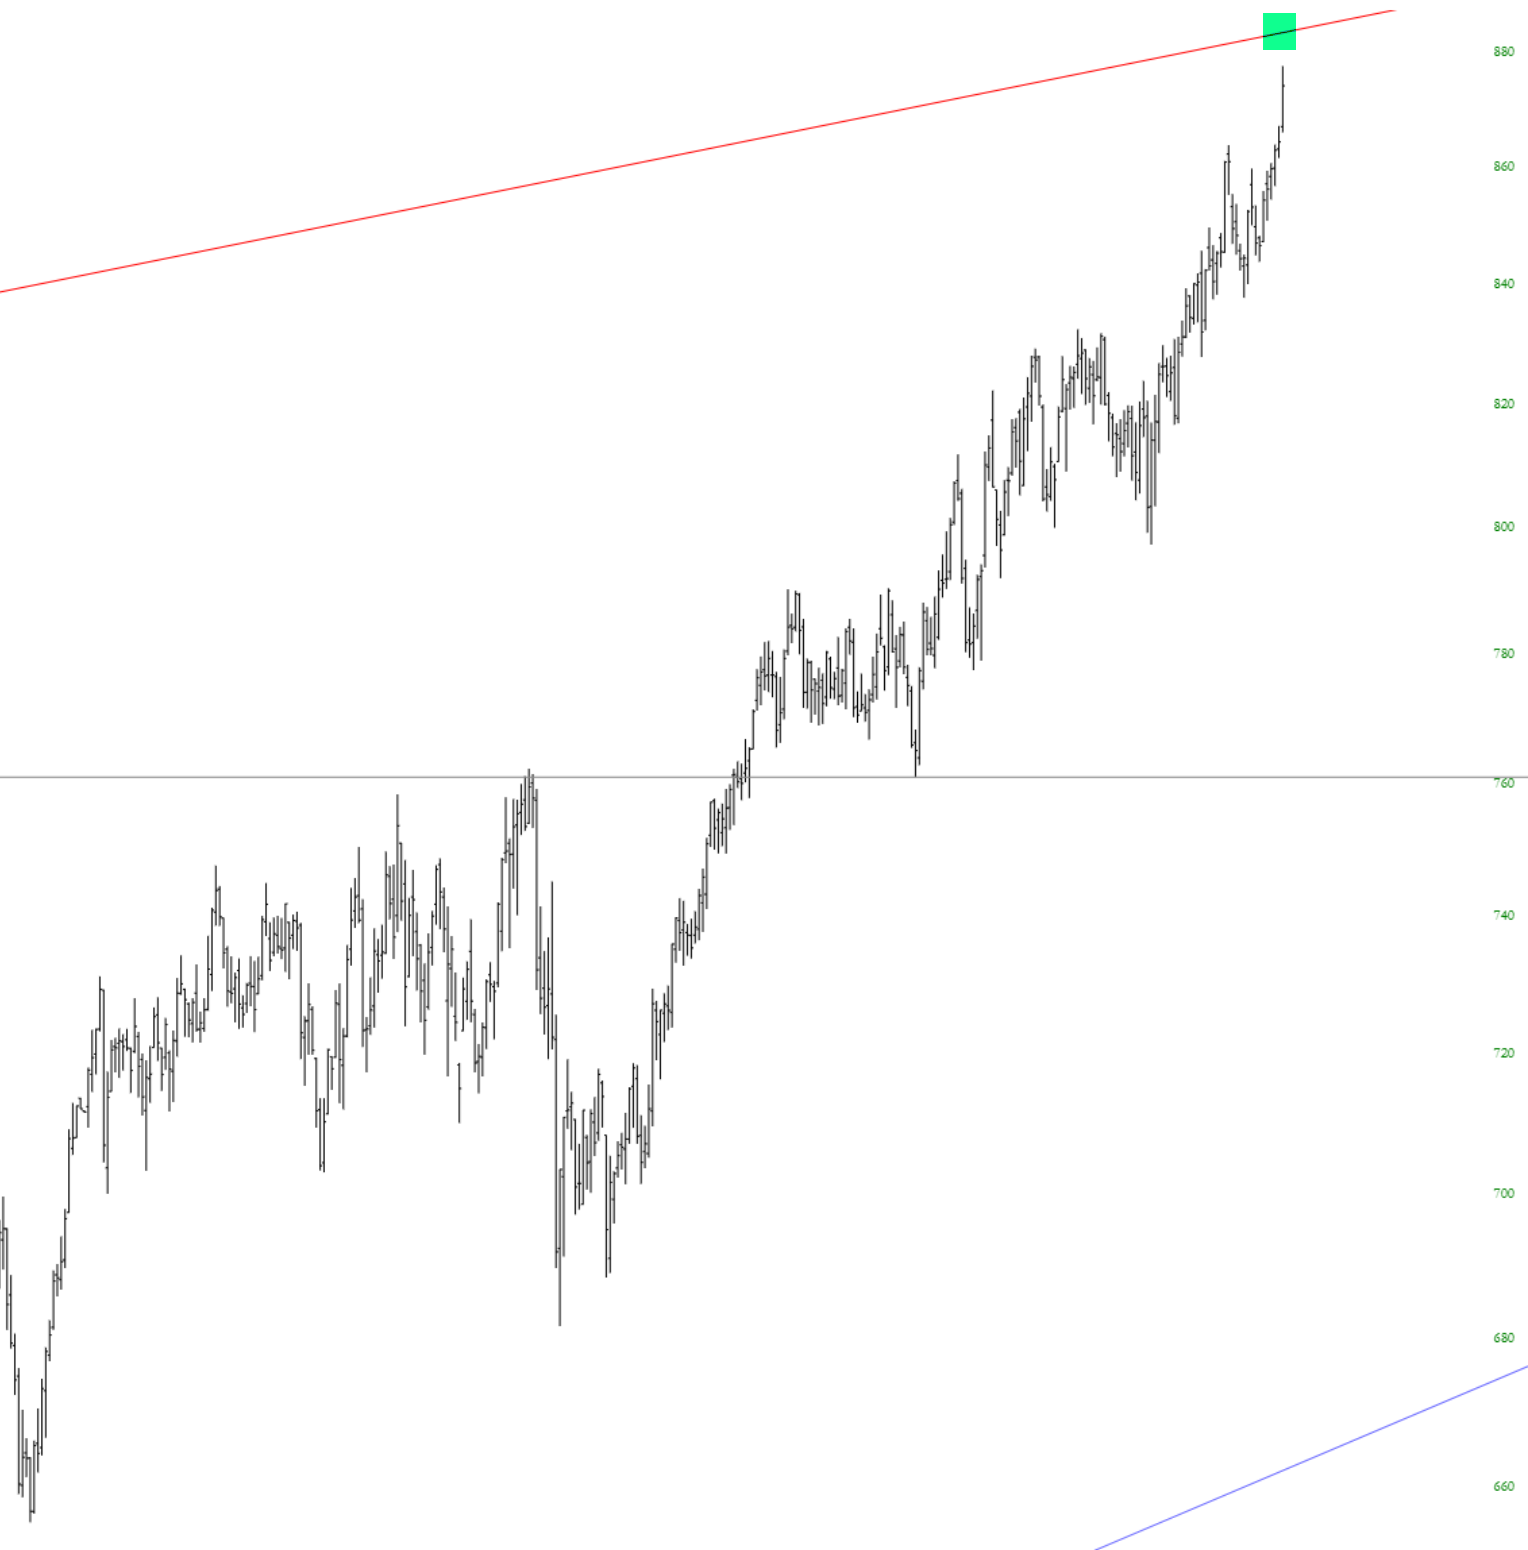
Actually, that’s not quite true, because the most recent instance (that is, the 5th one) is just about now, so who knows what will come next. Plus, it hasn’t quite tagged it yet. But God knows it is very, very close. (God is a Diamond member, so I’m sure of it).
I’m not suggesting being short the Utilities. That has been a foolish play for over a decade. I am saying, however, that the long term perspective is awfully intriguing.
