
I’ve got something to tell you about which is one of the coolest things we’ve created in years. For its introduction, I am making them available to all users, including those who have not yet elected to become premium members.
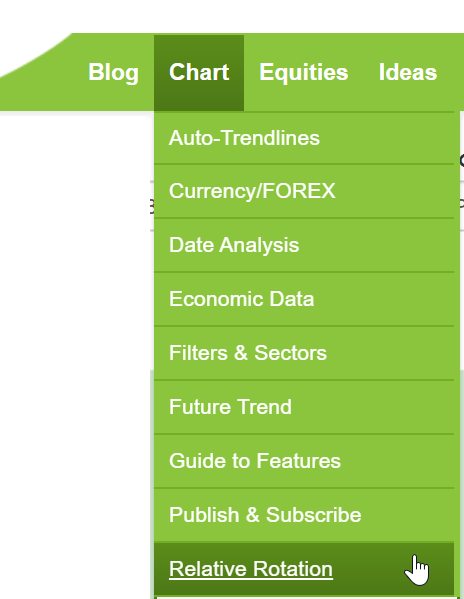
Slope of Hope offers a very different perspective into equity market movement by way of Relative Rotation Graphs, which are here and also accessible from this menu item below. (Note that the term “Relative Rotation Graphs®” and “RRG®” are registered trademarks of RRG Research)
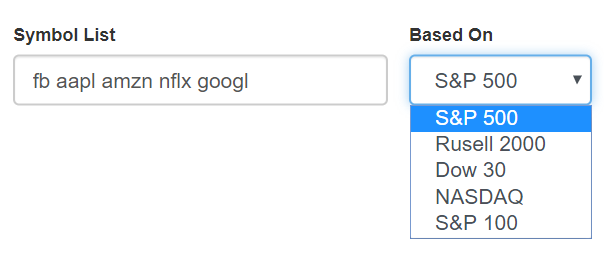
Using this page is simple. Just enter one or more stock symbols and press Enter. Typically, the S&P 500 is used as the basis for the calculations, but you can choose any of the other cash indexes in the dropdown as well, should you prefer a different basis of comparison.
You will be presented with a four-sector grid with the symbols that you entered as well as “tails” indicating their prior path.
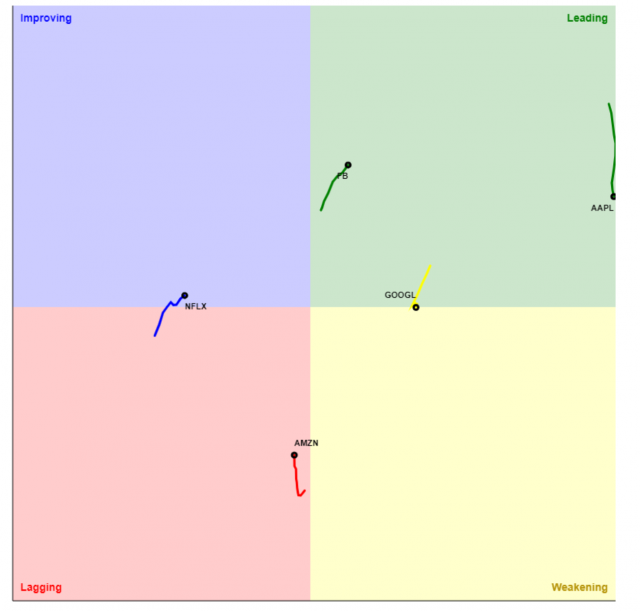
The quadrant’s characteristics are fairly self-explanatory. Ideally, financial instruments would work their way clockwise (although it rarely happens perfectly) from Leading to Weakening to Lagging to Improving.
The position along the x-axis is based on the relative strength of the stock as compared to the basis index. The y-axis is based on the momentum of that relative strength (in other words, is the “Strength” getting stronger or weaker?)
These values are above or below 100, which means the exact center of the quadrant is equal to (100,100). What this means is:
Leading – both values are above 100
Weakening – the momentum has sunk beneath 100
Lagging – both momentum and strength are under 100
Improving – strength is still sub-100 but momentum is above it
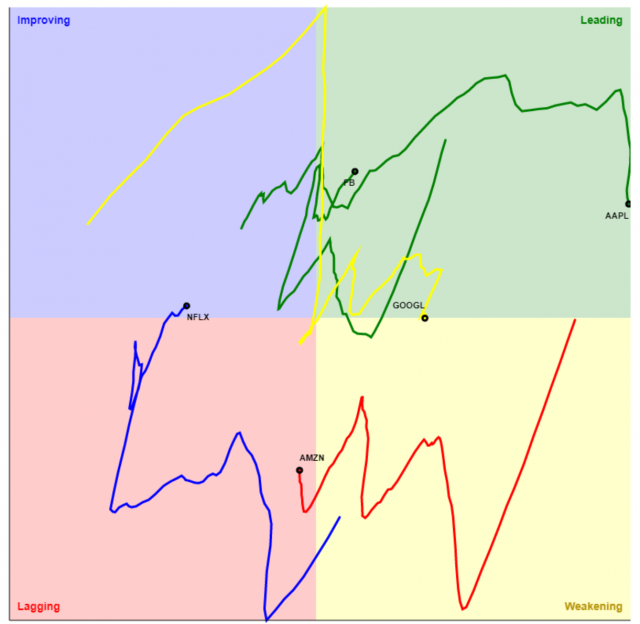
In the example above, the fabled FAANG stocks (FB, AAPL, AMZN, NFLX, GOOGL) have been entered and four of them have a neat symmetrical relationship to one another, each in a different quadrant. AAPL, the odd man out, is located far off in the “Leading” quadrant (which, given its astonishing and persistent strength as of this writing, makes sense).
The black dot represents the current position of the equity, and the tail behind it shows its recent past positions. You can alter both the length of the tail (representing just how much time in the past is portrayed) as well as the end date used for the black dot’s location by way of the two slider controls.
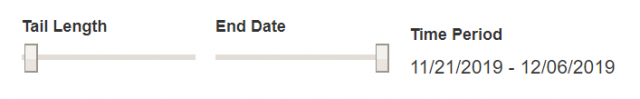
For example, dragging the Tail Length slider to the right would substantially increase the amount of time represented, altering the presentation to something like this:
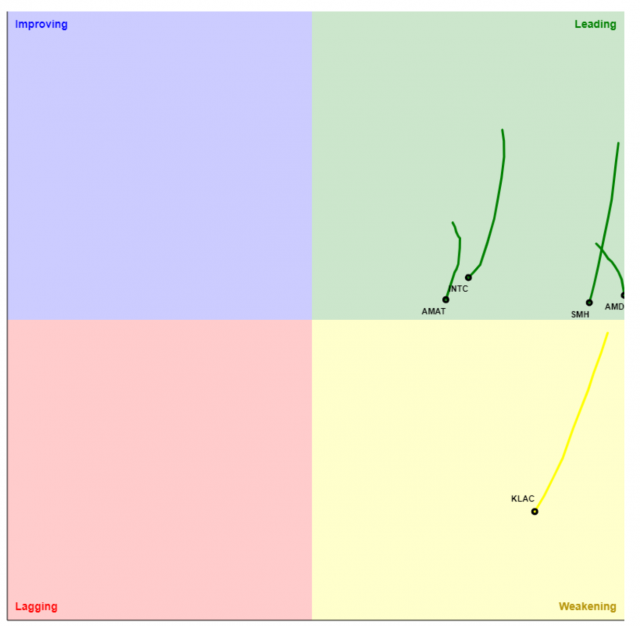
Of course, different mixes of symbols will create very different configurations. Below is the RRG of five semiconductor-related securities. Not surprisingly, they are all more or less similar in terms of their behavior, although one of them, KLAC, appears to be entering the Weakening quadrant with far more speed than its peers.
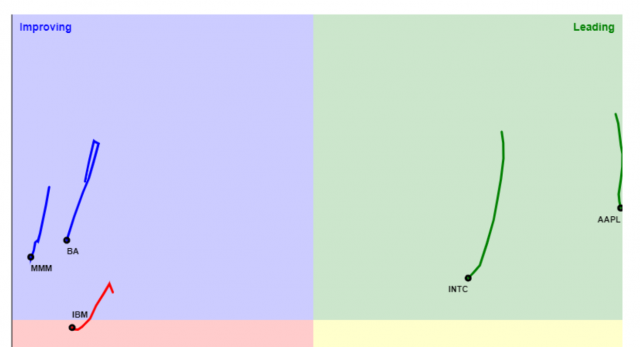
Another mix of symbols, shown here, has symbols drawn from greatly different industries, so there is a greater divergence in location and path.
What can be particularly fascinating about these observations is to witness the direction, speed, and location changes over the course of time. By dragging the End Date slider, you can witness this and completely control the speed and direction of your exploration of the recent past for the financial instruments portrayed.
You can also do this automatically by way of the Animation control. There is a Speed slider bar next to the Go button which can make the animation go slowly (left side) or quickly (right slide). Drag it to the position you want, then click Go to start the animation. The moment you do, the button changes to Stop, so that you can cease the animation by clicking Stop.

Here is what the animated version looks like with a basket of diverse stocks from one watch list.
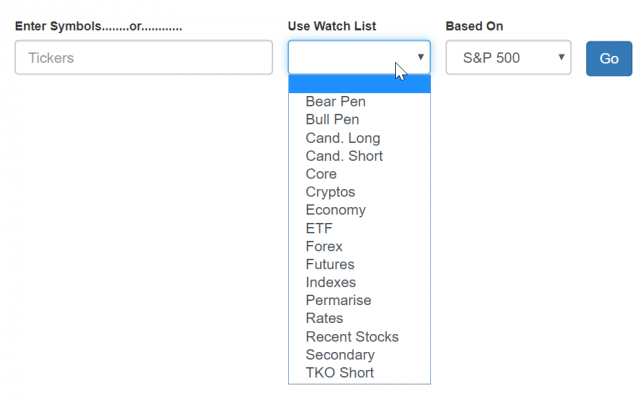
Lastly, you can make use of any of your own watch lists to auto-populate the symbol entry. Take care not to use a watch list with too many symbols, as there will be so more information on the display as to be useless. However, you can garner some fascinating insights with your custom-made watch lists coupled with the power of the RRG that Slope has developed.
So try them out and let me know what you think!
