I wanted to show how a couple of SlopeCharts features can be used together to helpful effect: first, the Price Cone, and second, Option Dots. I’ve used them in the chart below with high-flying stock Tesla. The price cone illustrates the options market’s assessment as to likely price movement in the next 30 days (an enormous range, for obvious reasons) whereas the option dots show the various put and call options available at different price points.
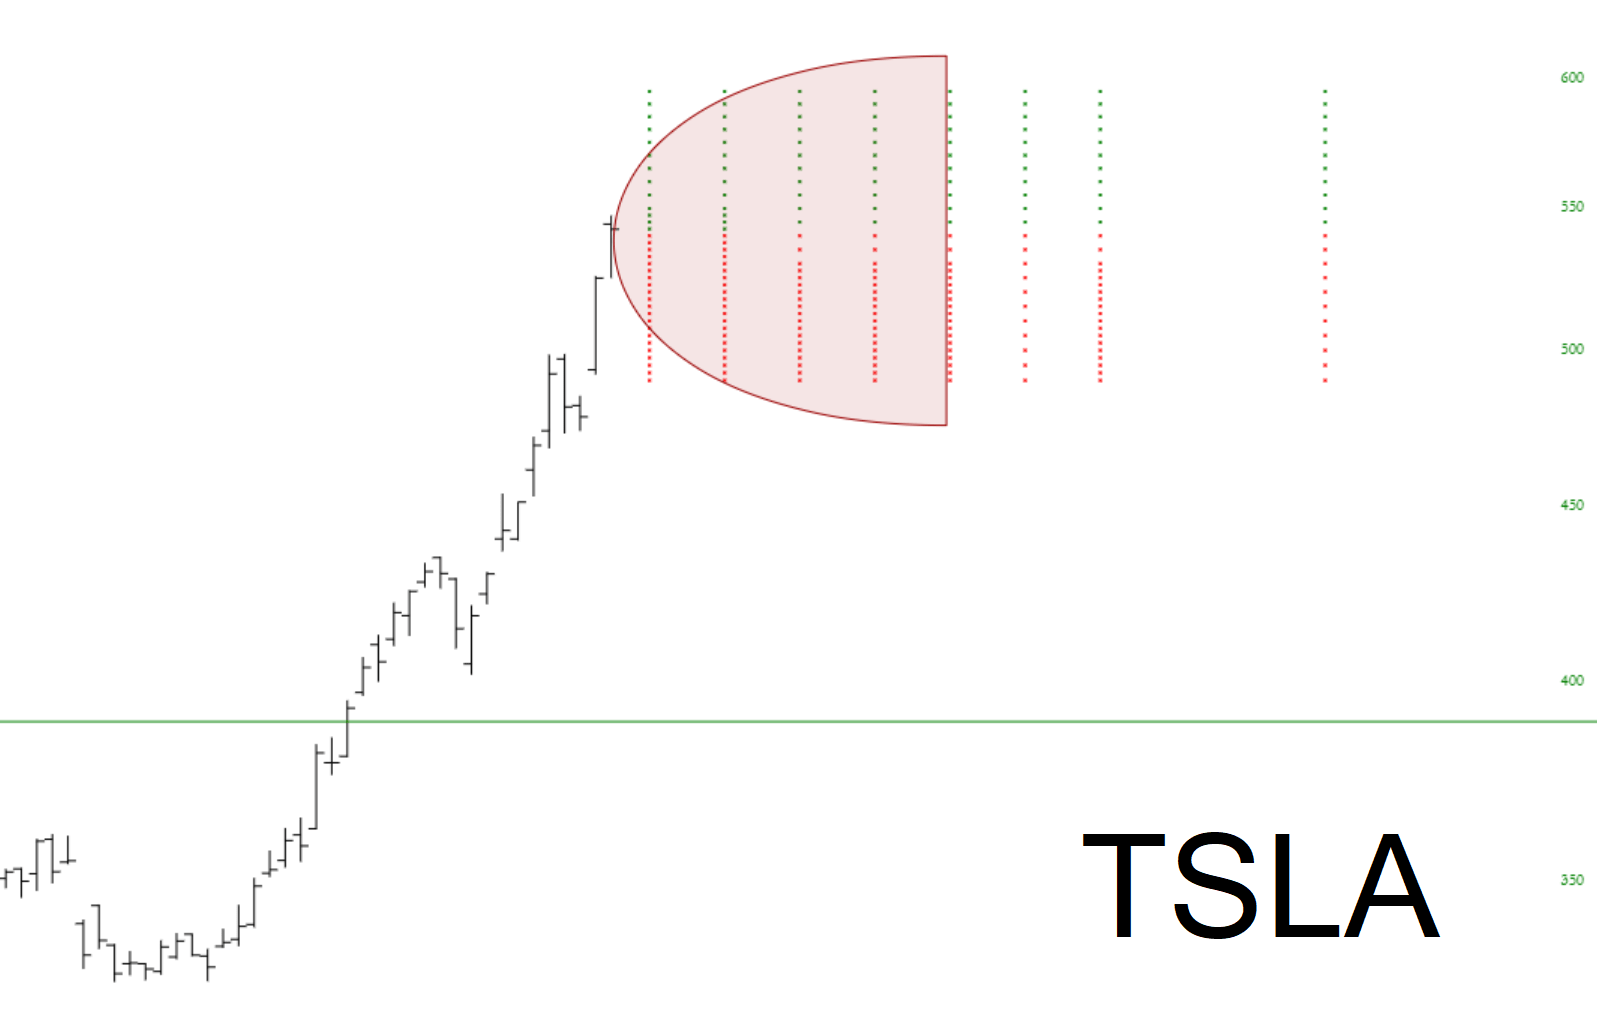
Given Tesla’s absolutely meteoric rise (and short squeeze), I’ve got to believe that there are some rich opportunities for options traders at present price levels. This is a monster!