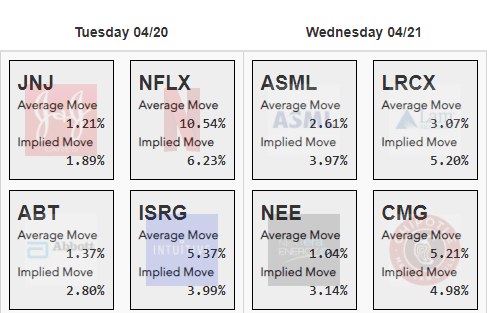
We are delighted to let you know about yet another Slope creation – – a new page dedicated to showing you, in an easy-to-read, attractive format, an earnings calendar focused on volatility data. The page is very similar to the existing Graphical Earnings Calendar, but it has two vital pieces of information beneath each symbol:
- the Average Move that the stock makes between the day prior to earnings and the day after;
- The Implied Move based on the implied volatility data of the options values.
