Be Protected When The Bear Comes (image via TMZ).
The Risk Of Declining Volatility
In our last post (“Indicator That Signaled Corrections In 2010 And 2018 Flashes Red Again”), we mentioned Leuthold Group Chief Investment Officer Doug Ramsey’s warning that the negative Marshallian K indicator (a measure of liquidity) might presage a correction. ZeroHedge shared another warning on Thursday, via the Swarm Blog (“Haters Gonna Hate: What Volatility Charts Tell Us About The Next Big Spike”). In a nutshell, decreasing volatility (VIX compression) means the market is more vulnerable to a volatility spike:
Today, we have a unique opportunity to observe one of the biggest speculative bubbles ever, and to understand how financial markets evolve towards critical points. […]
The VIX compression patterns help us to understand what is going on. After a major spike, the market remains nervous for a while, and people hesitate before buying the dip. However, the VIX gradually decreases, despite further spikes that will get smaller and smaller. As investors become more confident, more people will rush to buy the dip as soon as a correction occurs, meaning that a larger proportion of the system becomes seller of lower levels of volatility.
Therefore, it does not take much for the market to get crushed, as its tolerance to a volatility spike has become extremely low. And the question of what will trigger that critical point becomes meaningless.
From a scientific perspective, dip buyers can be treated as negative feedback loops that help the system to return to a form of “equilibrium” after a perturbation. As VIX spikes get smaller, the probability of critical slowing down increases. In plain English, this means that loss tolerance is decreasing in the system, and that even a small pullback can trigger a catastrophic crash as negative feedback loops no longer work.
Navigating A Speculative Bubble
If you agree with that characterization of the current market as a speculative bubble, you’re left with the question of what to do about it. We shared our preferred approach in a post last month (“Building A Bear Proof Portfolio“). In short, it’s to buy and hedge a handful of names that a) we estimate will do well over the next several months and b) are relatively inexpensive to hedge. The goal here is to do well while the market goes up, and limit your downside if it tanks.
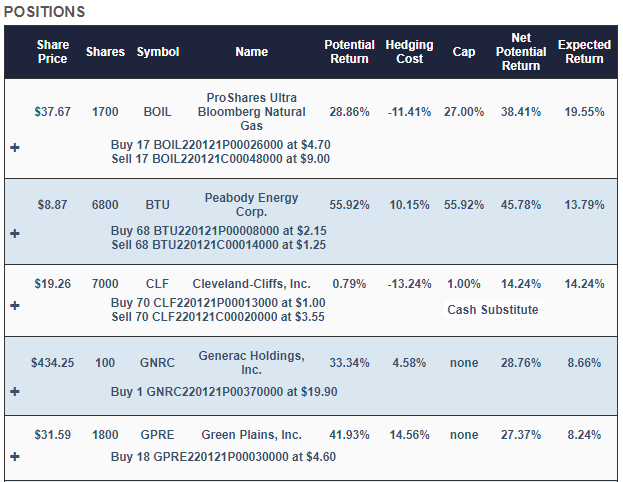
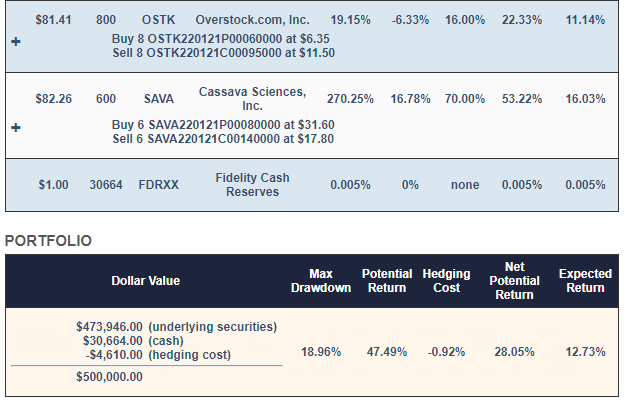
Using that process, this is the portfolio our system generated for someone with $500,000 to invest who was unwilling to risk a decline of more than 20% in the event of a catastrophic crash:


Screen captures via Portfolio Armor on 7/19/2021.
Why Those Stocks?
Each trading day, our system analyzes total returns and options market sentiment to estimate potential returns for thousands of stocks and ETFs. The ProShares Ultra Bloomberg Natural Gas ETF (BOIL), Peabody Energy (BTU), Generac Holdings (GNRC), Green Plains (GPRE), Overstock.com (OSTK), and Cassava Sciences (SAVA) were selected because they were among our top names: the ones that had the highest potential returns, net of hedging costs. Our system started with roughly equal dollar amounts of each, and then rounded them down to round lots, to reduce hedging costs. It swept up most of the leftover cash from the rounding-down process into a tightly hedged Cleveland-Cliffs (CLF) position, to further reduce hedging cost.
Why Those Hedges?
On our website, if you click the plus signs in the portfolio above, the positions expand to give you a better look at the hedges. For example, this is what the GNRC position looks like expanded.

GNRC is hedged with an optimal, or least expensive, put option. Most of the other positions are hedged with optimal collars. Our system estimates returns both ways to determine which type of hedge is best. We elaborated on that process in a previous post: When To Hedge With Puts Versus Collars.
Enough Details: How Is It Doing So Far?
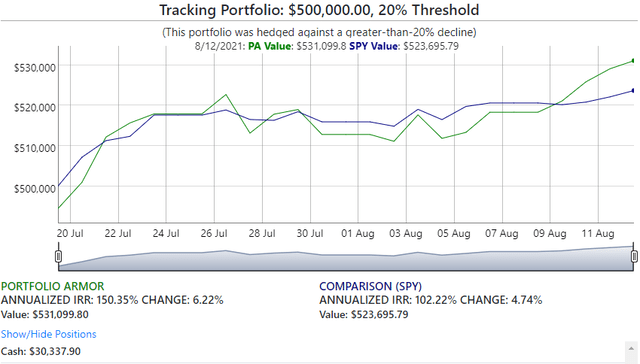
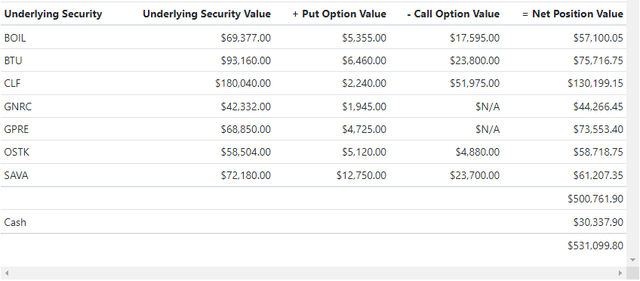
Net of hedging and trading costs, it was up 6.22% as of Thursday’s close, versus SPY which was up 4.74% over the same time frame.


So far, so good.

