Back around the year 2000, I was strolling around the neighborhood when I saw an Open House sign about a block from where I live. It was a Sunday, the traditional day for open houses, so I thought I’d just look around and see what it was like and what it cost.
In the backyard there was the smiling real estate agent, but what caught my eye was something which surprised me: a coffee cart. A really nice one, too, with a barista at its side. There was a short menu of drinks he could make, and I thought to myself, “Cool, a free drink!” So I got myself a latte and pretended to be a potential buyer as I looked around. At the time, I thought it was pretty clever for a real estate agent to spend the extra money to make a house visit something pleasant.
Well, that bright young man became a real estate superstar. Ten years later, he was the top agent (out of 1.2 million) in the entire country, and he has gone on to create a miniature real estate empire here in the Silicon Valley. His name is Ken DeLeon, and he regularly sends out very slick marketing materials, including full-blown color magazines, to all the houses in the area. I got one recently and wanted to share a few pages with you.
You have probably figured out by now that I like charts a lot. Ken’s stuff is always packed with charts, so I find it quite interesting (particularly since most of my net worth is tied up in Bay Area real estate).
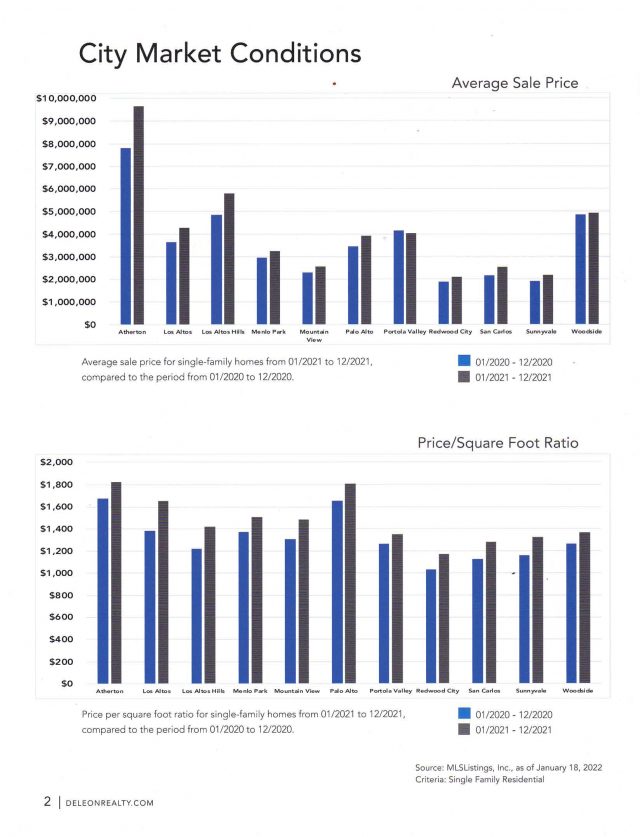
Here, for example, we see a city-by-city breakdown of what prices in 2020 were (blue) compared to 2021 (grey). Every single one is higher, with Atherton in particular (being the de facto venue for venture capitalists and rich businessmen) absolutely roaring.
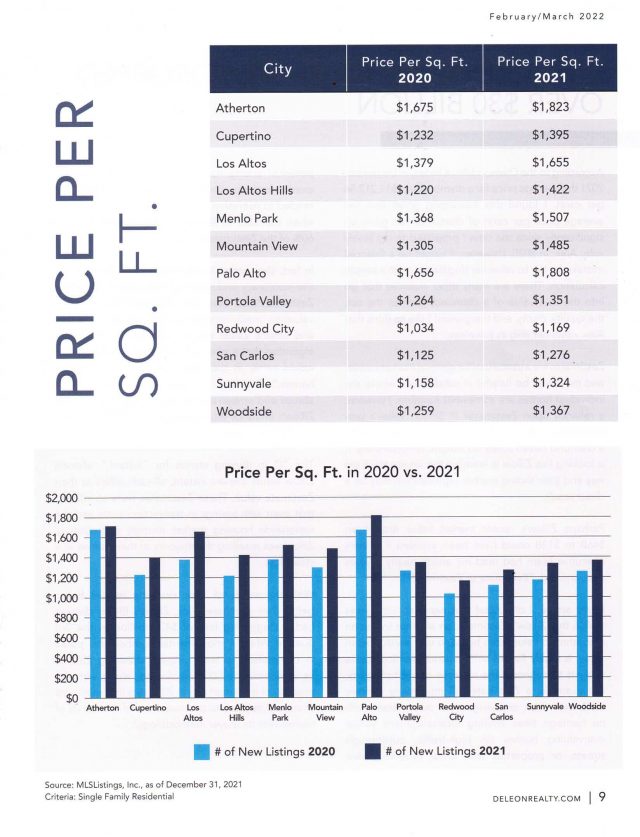
What’s more interesting, though, is the per-square-foot price, since that normalizes the information. You see, Atherton property is all at least one acre (which in the Bay Area is colossal) and tend to be VERY big homes, so the $10 million price tag can be a bit deceptive. The price for a square foot of a Palo Alto house ($1800) is, in fact, identical to the same square foot in the big-ass Atherton mansion.
OK, it’s not to the penny, but awfully close! I find this particularly striking since we’re acquiring another house elsewhere in the country, and the square foot prices there (which is considered a red-hot market) is maybe $230.
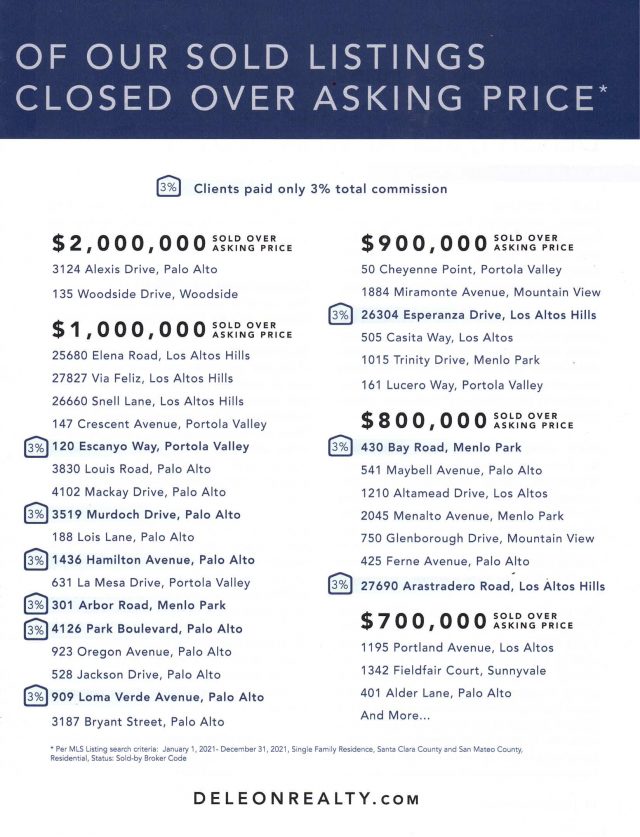
What is eye-popping is, in spite of the high prices how much HIGHER the executed prices are. Here’s a page showing how far above the asking price stuff was sold. There’s actually a $2,000,000 and up category.
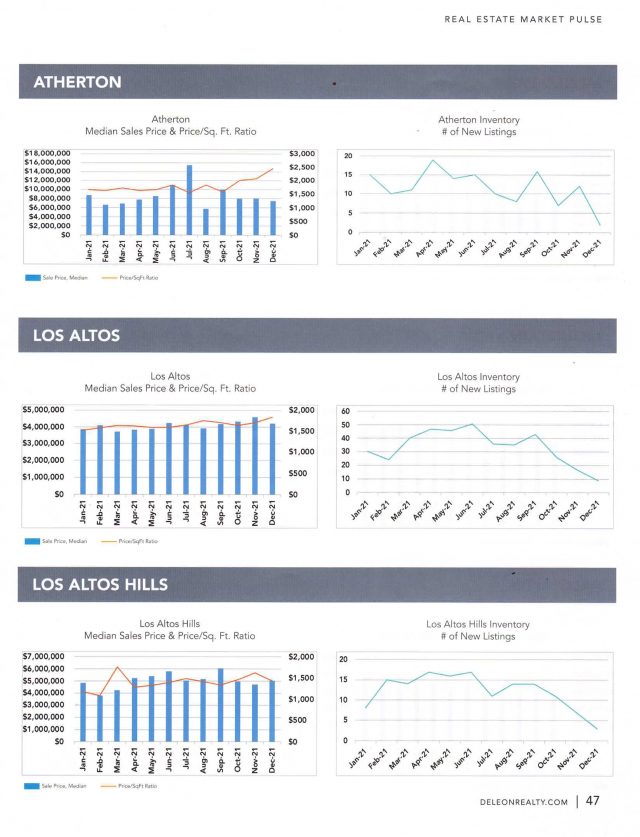
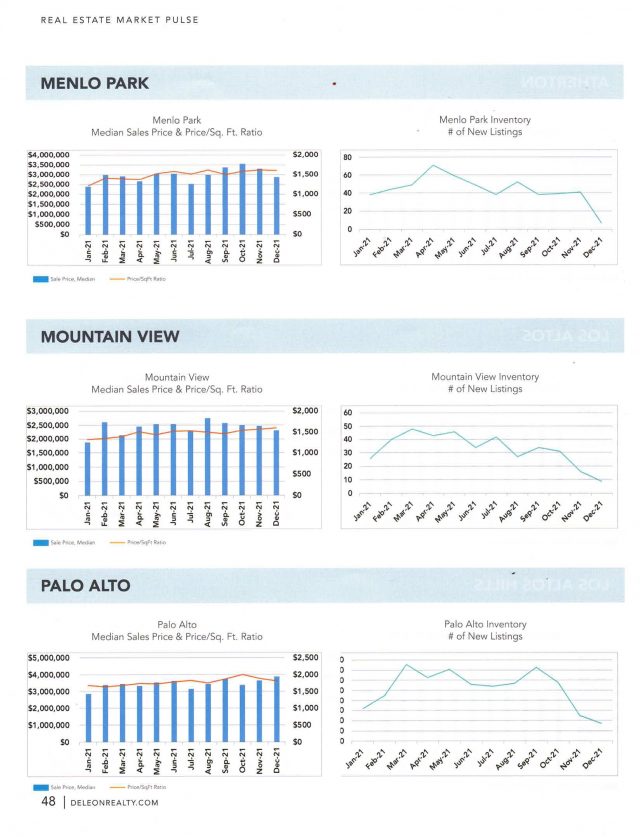
But Slope is all about historical price charts, right? So here are some of those. The plunging “# of New Listings” isn’t very meaningful, since people don’t sell homes in December, but the price charts are pretty cool.
And, a bit closer to home………..
You may not realize this, but Platinum members even have access to real estate data down to the city level! Here, for instance, is the not-easy-to-remember symbol FR:ATNHPIUS19147A which is a chart of Palo Alto real estate (by way of a house price index).
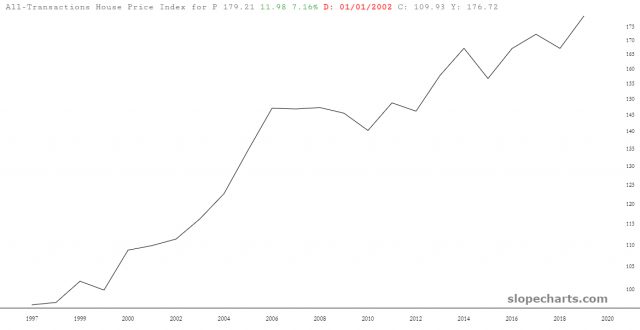
So, permabear that I am, it’s obviously heartening to see the prices of dirt, lumber, and nails keep going higher. And I know what people are thinking: “Oh, it’s so overpriced! In Bumblefuck, Iowa, I could get a mansion for $50,000!” I heard that in 1991, which I bought my house for half a million bucks and was told by my own mother it was the worst decision of my entire life.
The cool part is that a housing crash wouldn’t even matter. It would suck, but I’ll live. The reason is I feel like a guy who bought AMZN in 2002. Bring on the crash – -no worries!

