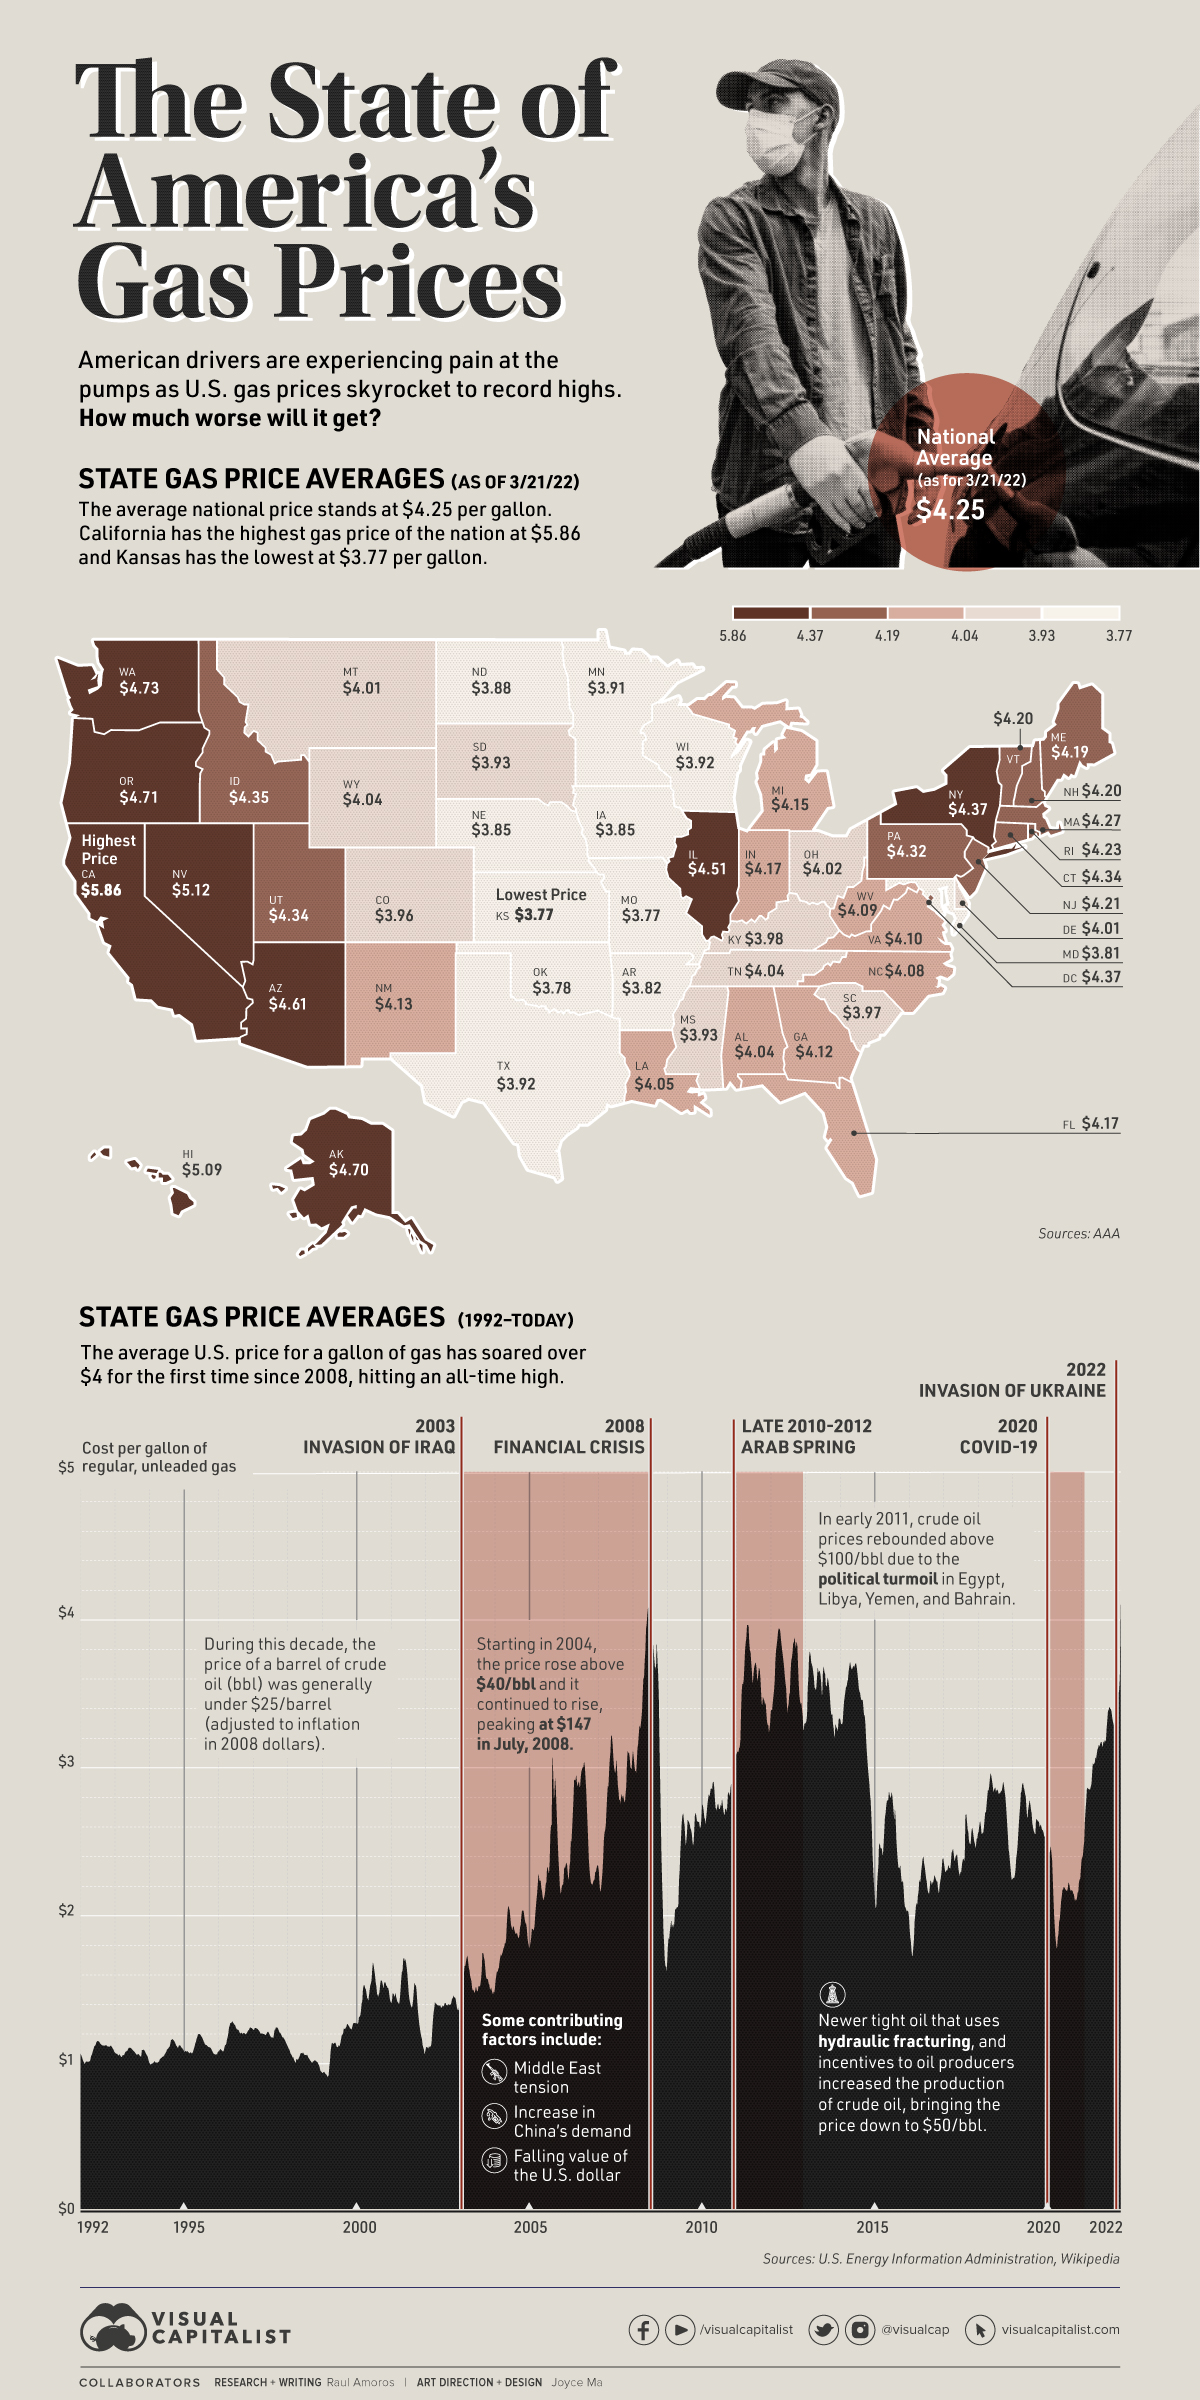
I’ve been watching them change the gas prices around here on practically a daily basis, and on the whole gas is about $6.20 per gallon in the Bay Area. Here’s a nationwide view:
Slope initially began as a blog, so this is where most of the website’s content resides. Here we have tens of thousands of posts dating back over a decade. These are listed in reverse chronological order. Click on any category icon below to see posts tagged with that particular subject, or click on a word in the category cloud on the right side of the screen for more specific choices.
I’ve been watching them change the gas prices around here on practically a daily basis, and on the whole gas is about $6.20 per gallon in the Bay Area. Here’s a nationwide view:
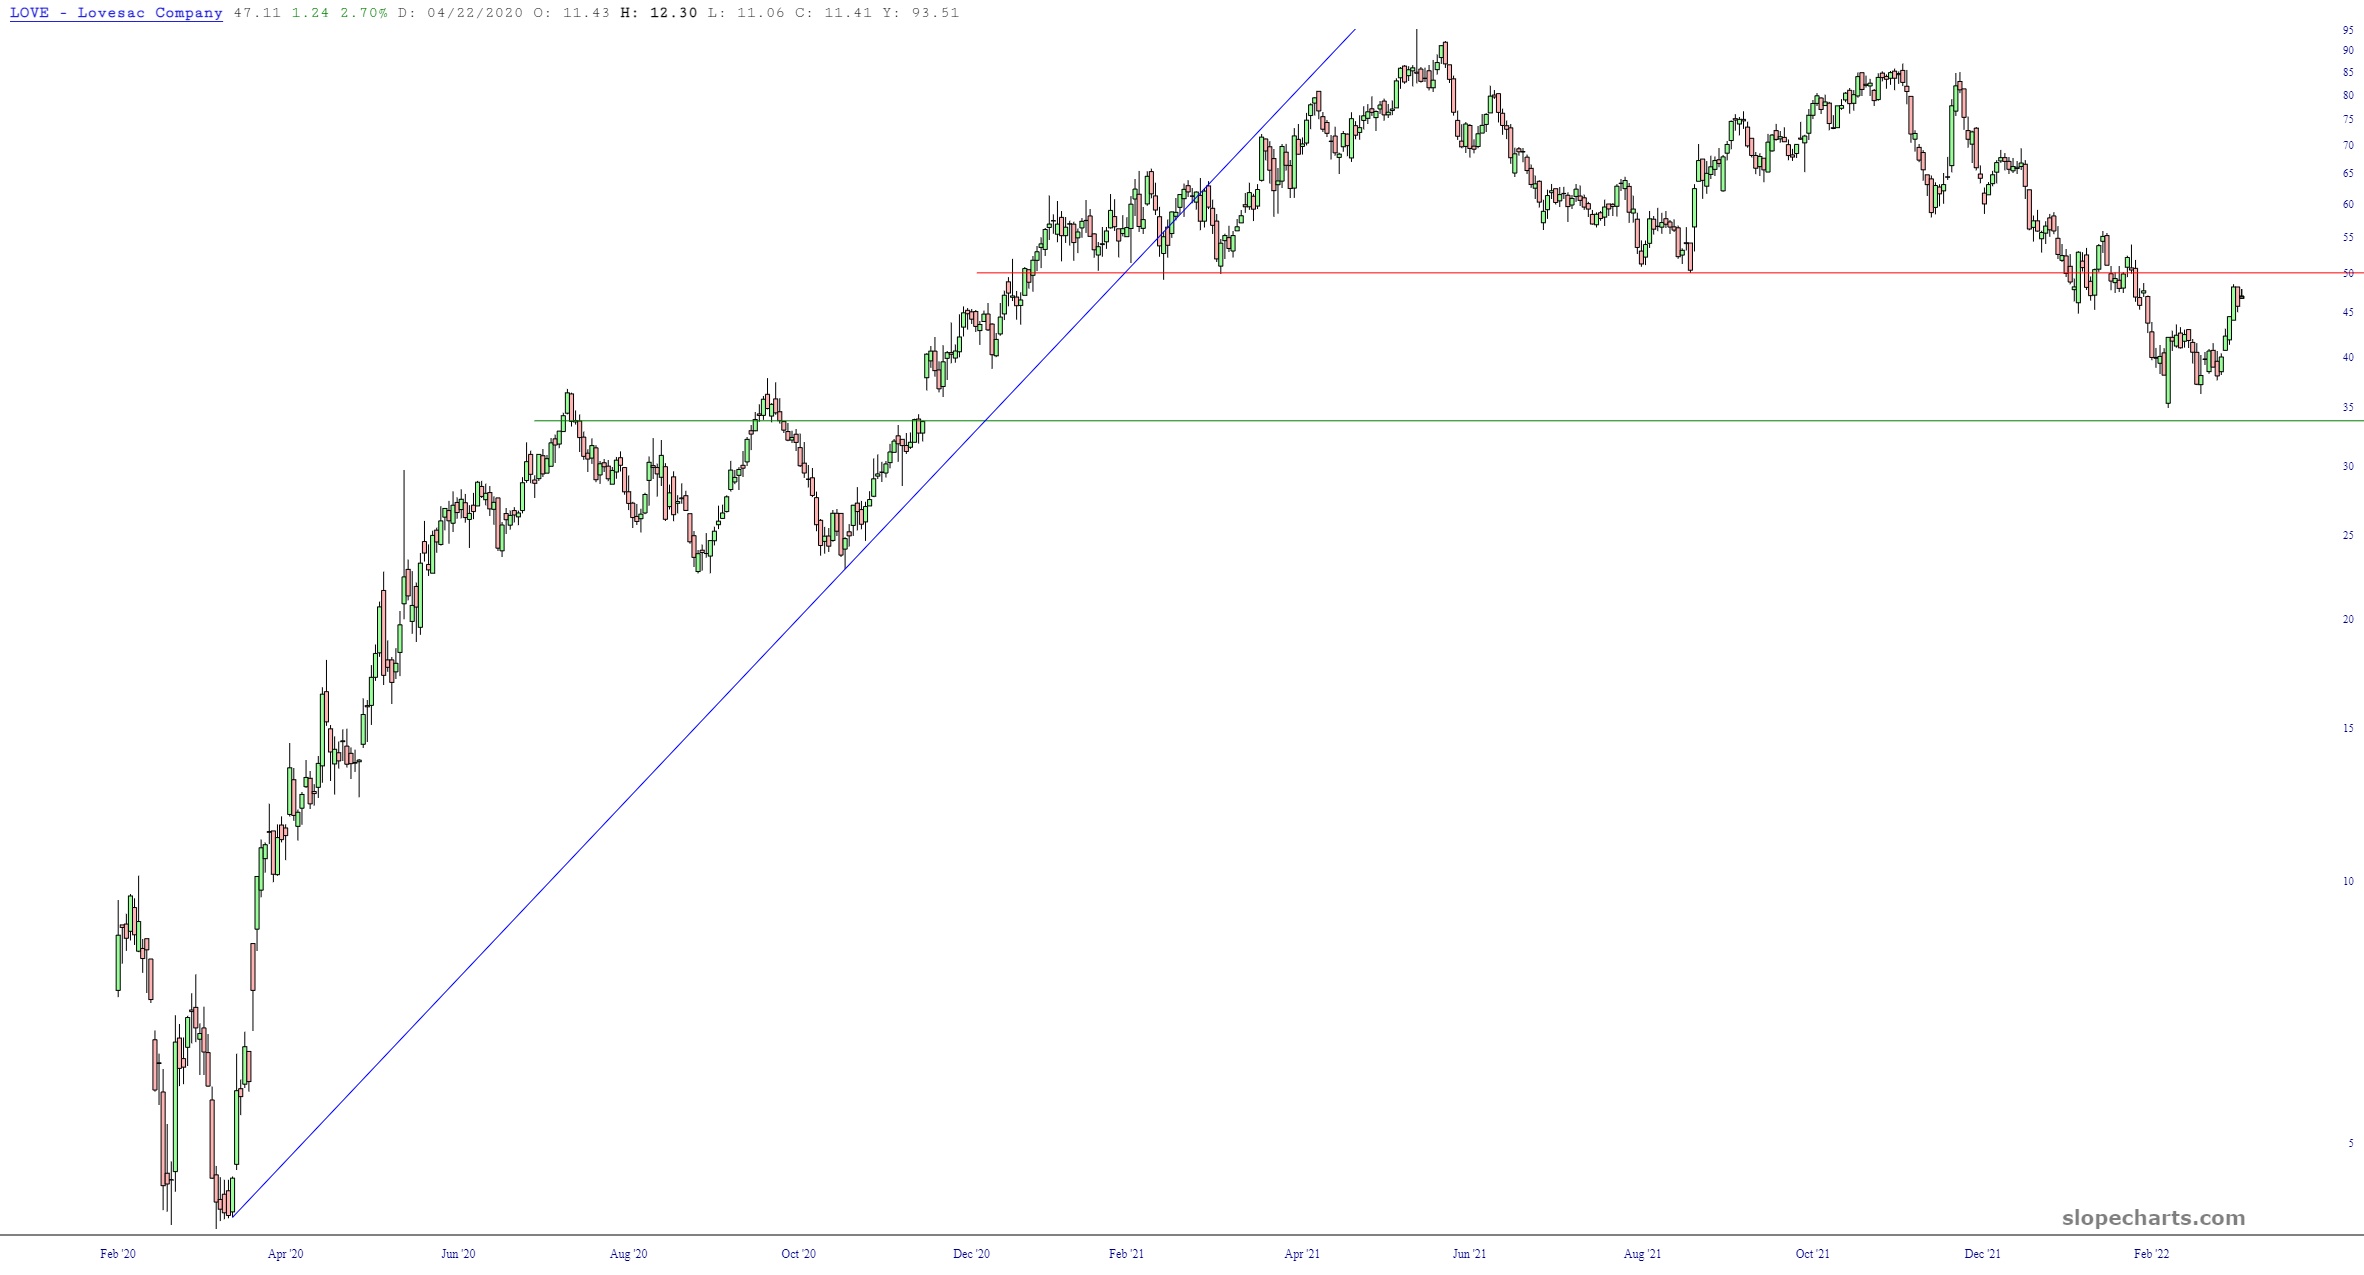
I would like to humbly suggest that Lovesac (which has no P/E I can share, since there is no “E”) is at or near its exhaustion point. Its ticker symbol is LOVE.
Please note, Gold and Platinum members, a premium post just for you.
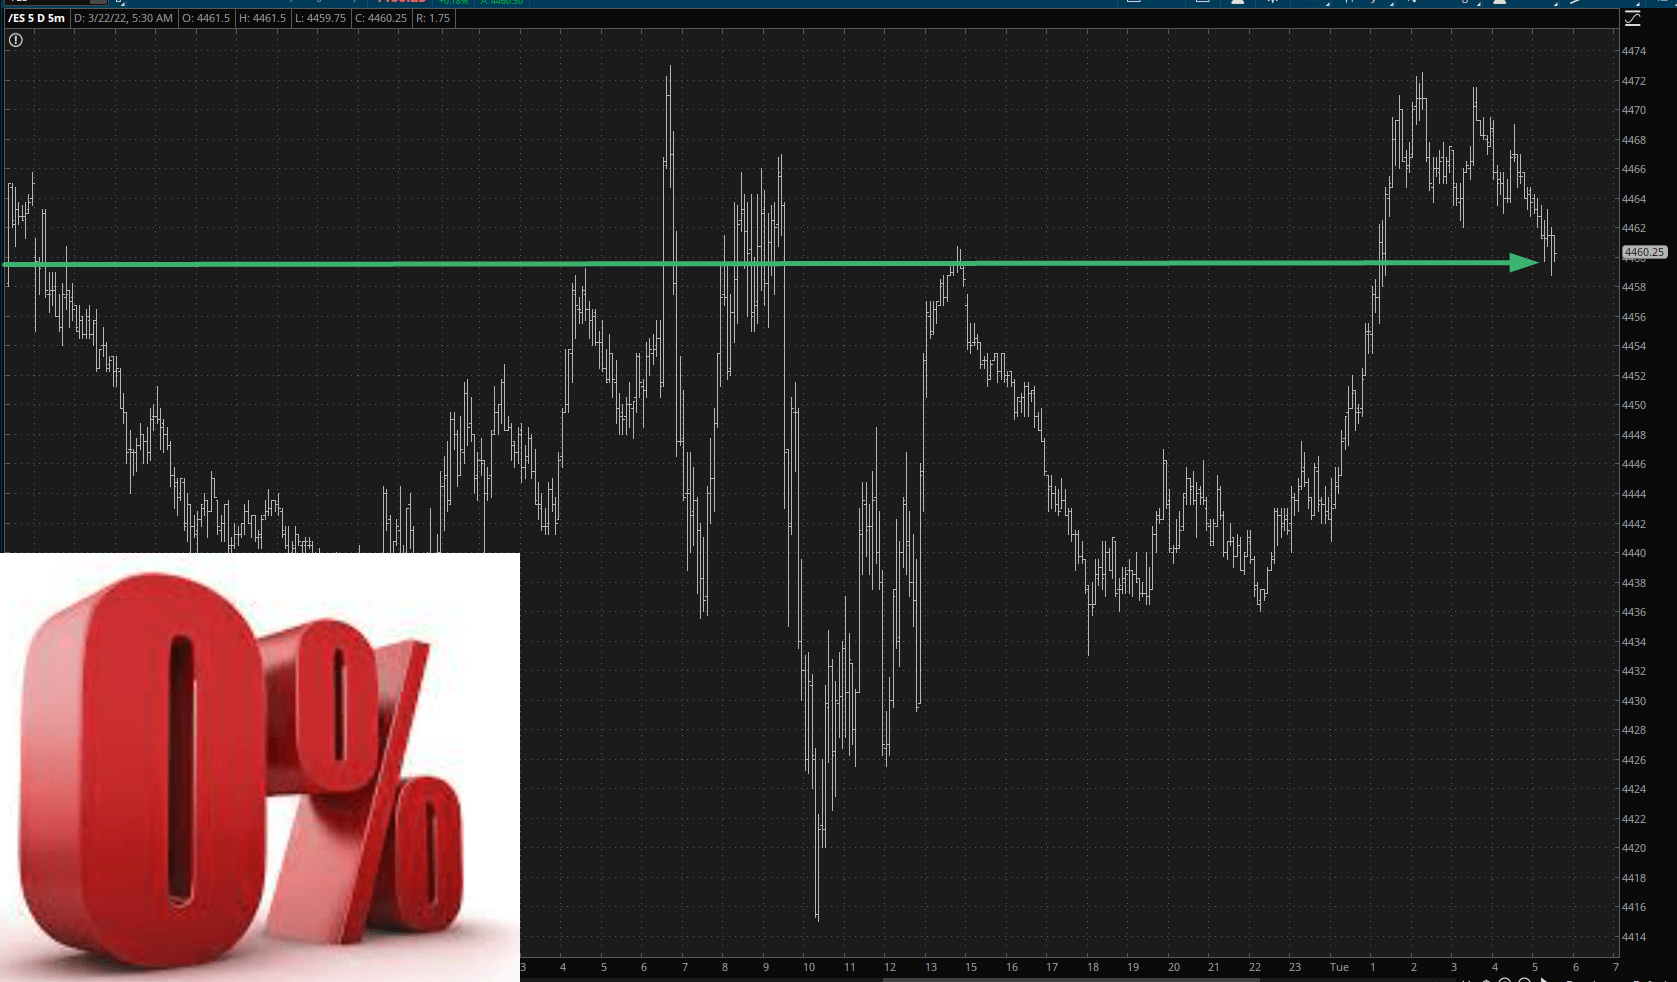
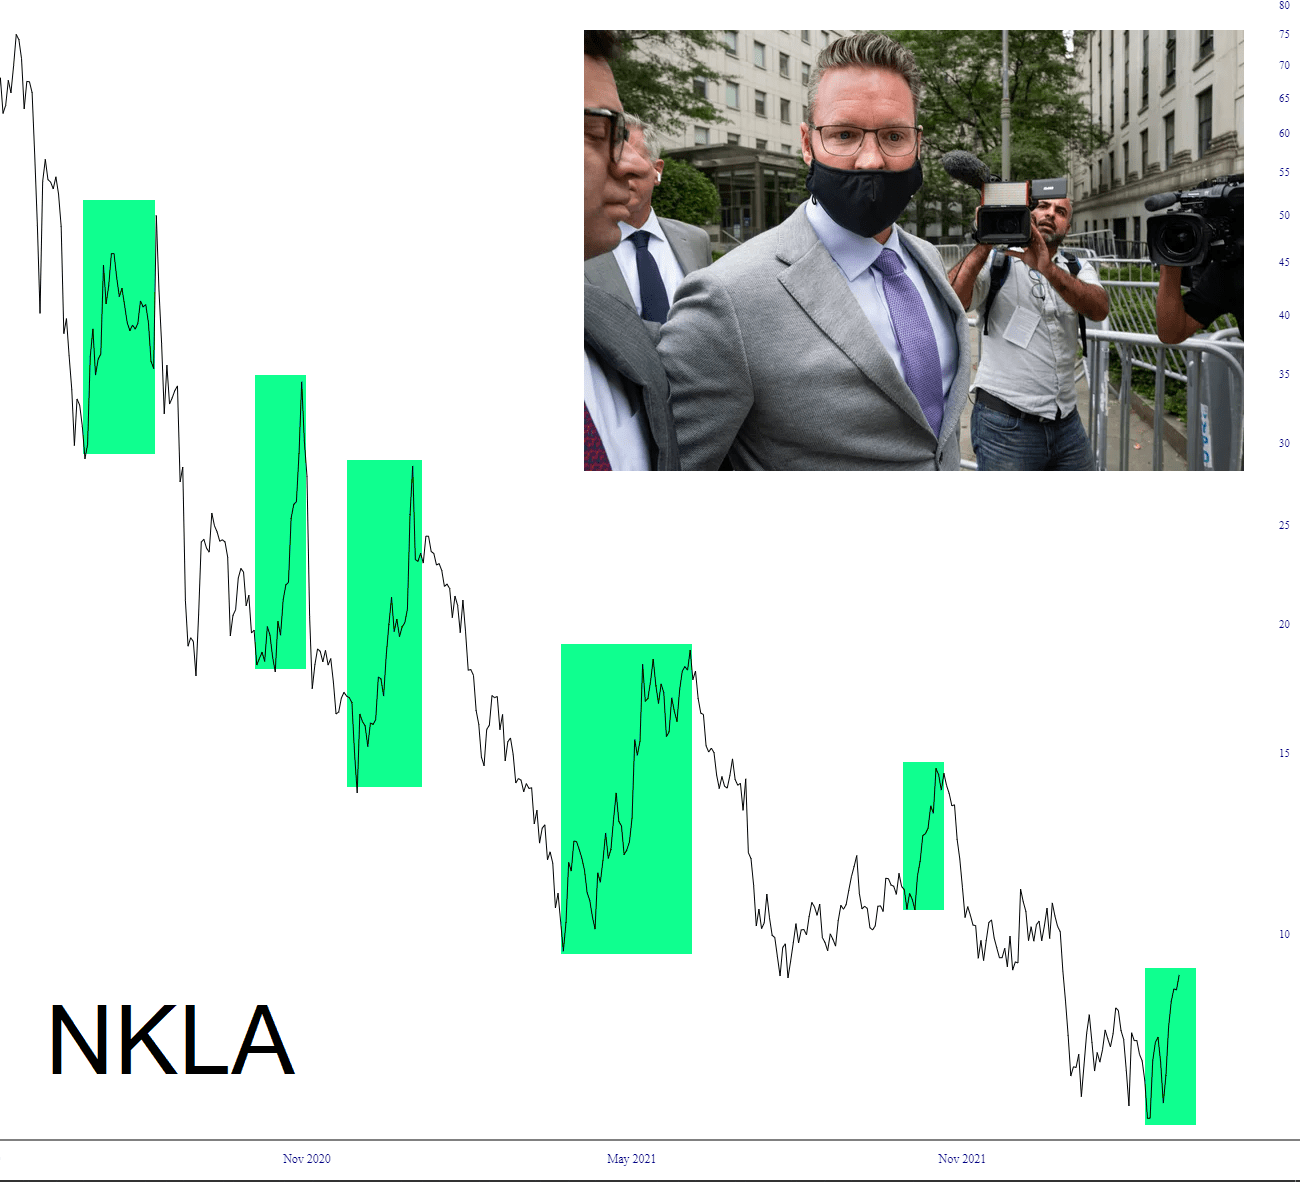
What we see below isn’t the exclusive domain of beleaguered Tesla wanna-be Nikola (NKLA). It is present on plenty of stocks which, on the whole, have been falling for many months. Just about the only thing in its favor at this point is that it’s so close to $0.00, there just isn’t too much farther it can fall from its latest dead cat bounce. Suffice it to say that, for the sixth time, shareholders figured the bottom was in.
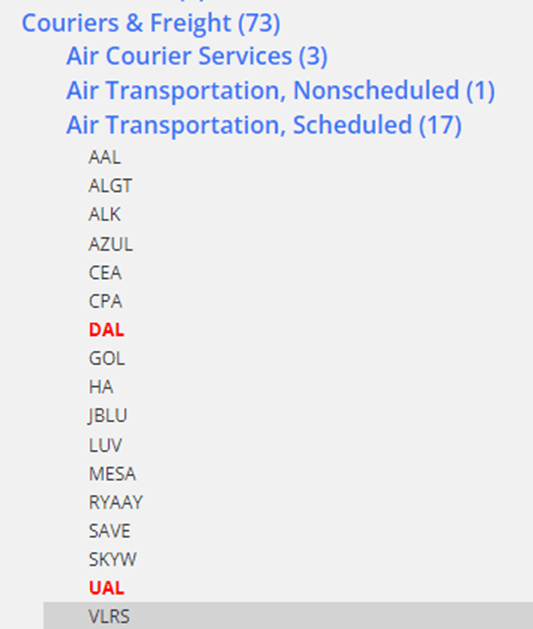
In the confines of my (currently suffering) bearish portfolio are a couple of airlines – – American and United. By using the Sectors feature in SlopeCharts, I decided to thumb through all the airlines to see what interesting short set-ups might be out there.