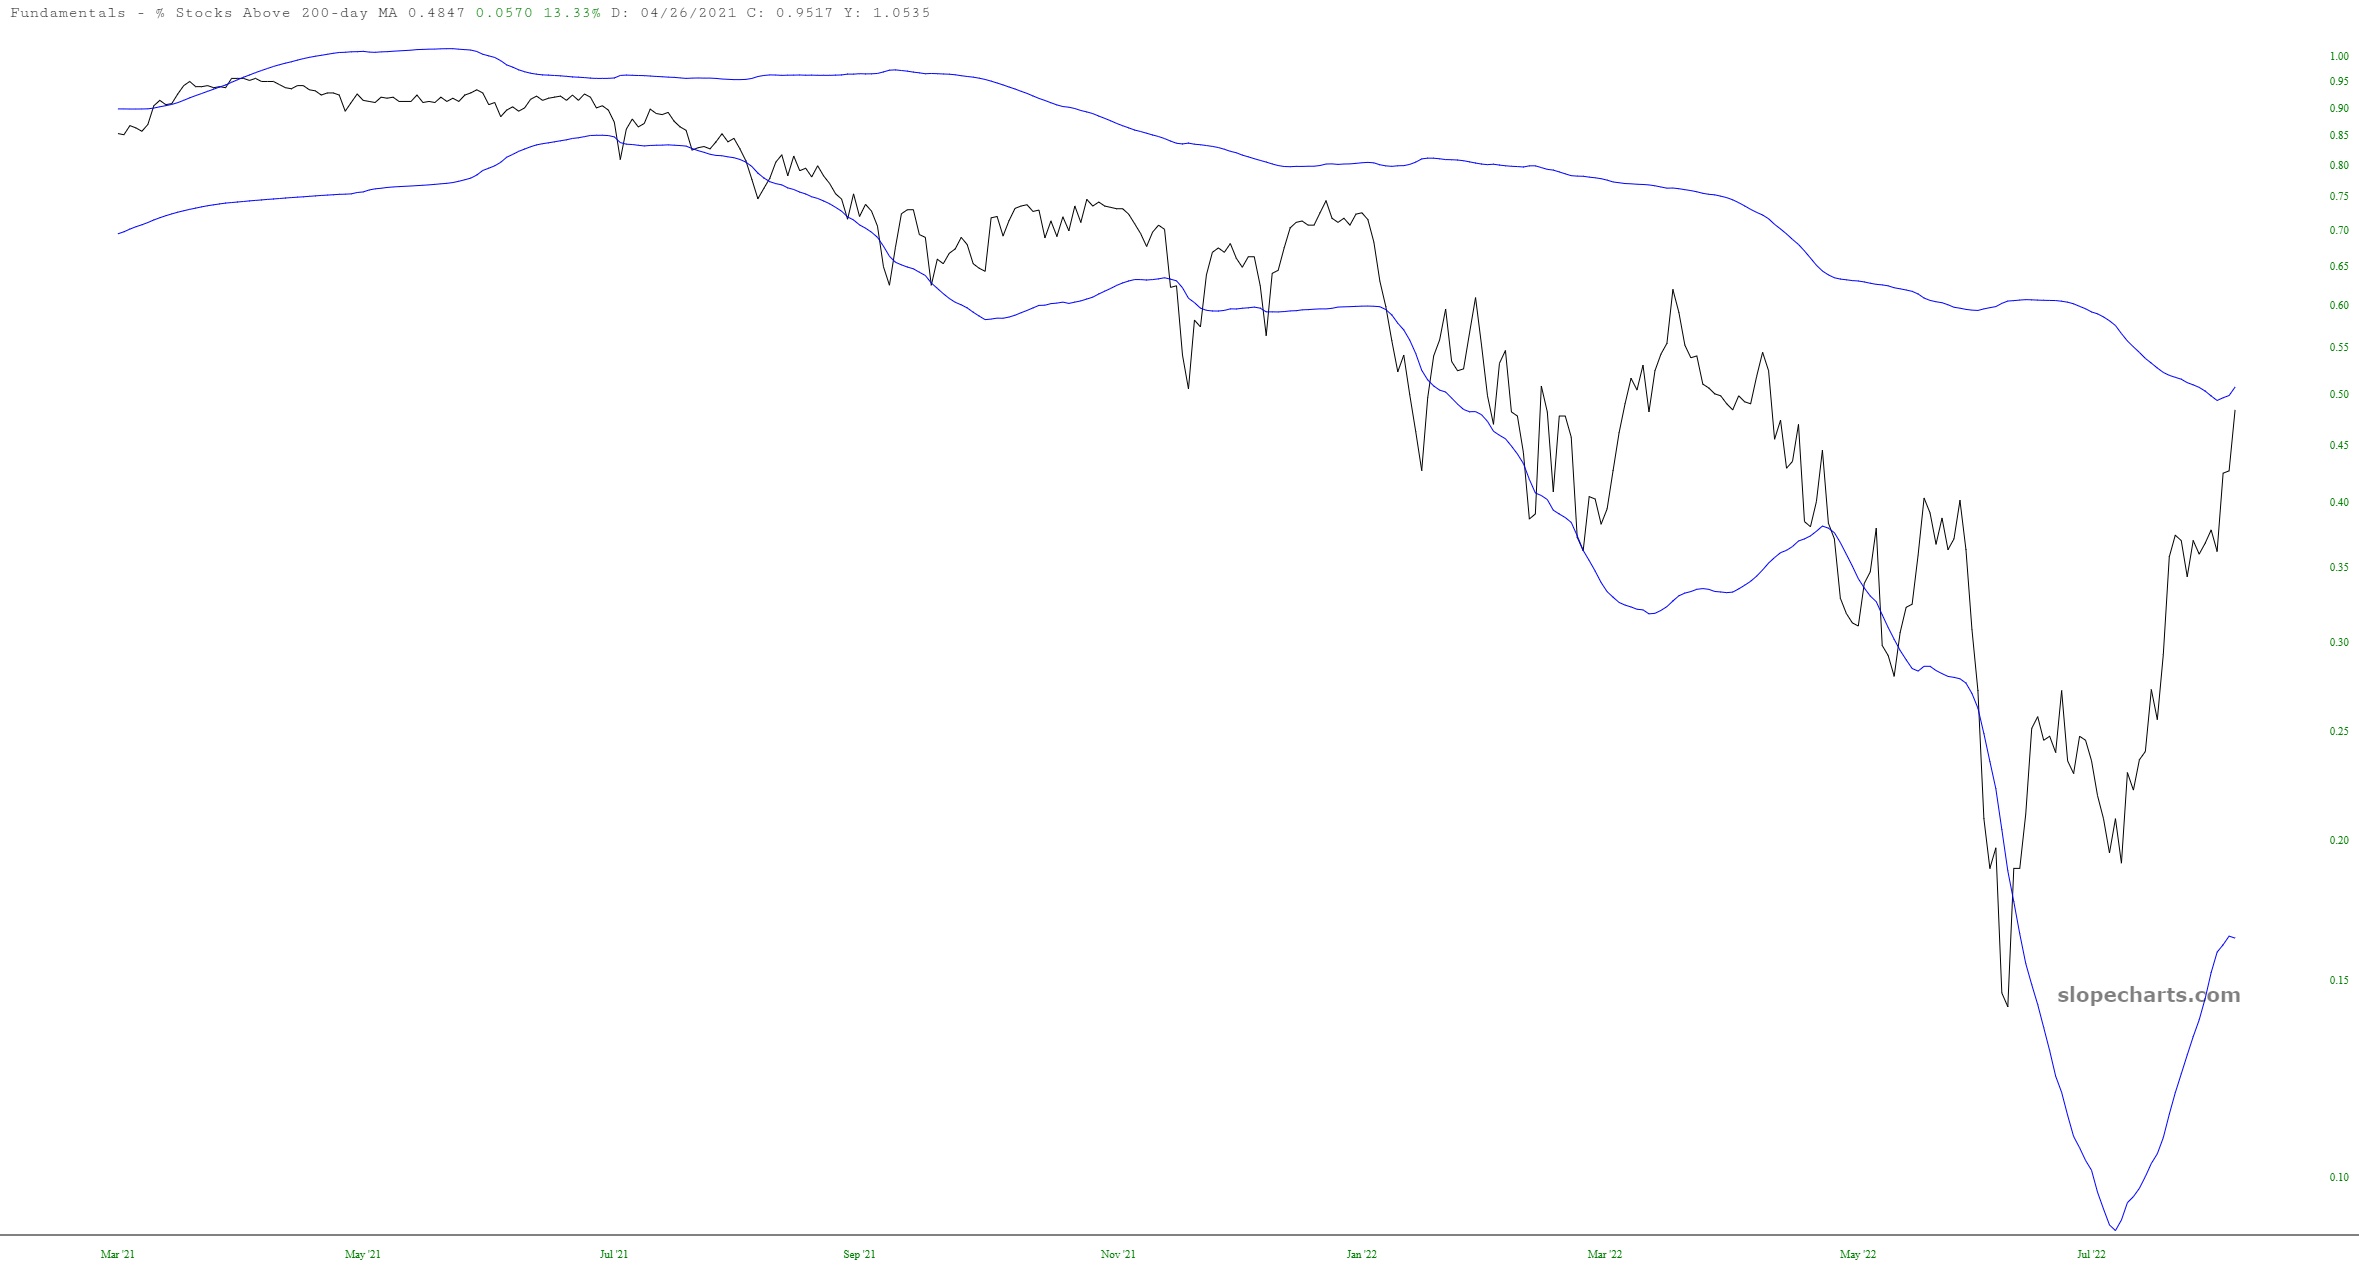
Here’s something I’ve never tried. Below is a very simple chart made up of two line graphs. The black line chart shows the percentage of stocks that are above their 200-day moving average. For obviously reasons, it has made a “lower high” recently. The blue lines are slow-moving Bollinger bands. I think this succinctly illustrates how crazy-overbought we are.