
Gold has burned me a few times this year. I caught a decent run on it as it reached its final peak when Russia invaded Ukraine earlier this year, but it has consistently failed me since then (I think I broke even after all was said and done). As such, I haven’t paid too much attention to it other than to watch it try to make a move on some volatile days. I did, however, pay attention to the past two tests of 1680, the latest of which broke down through.
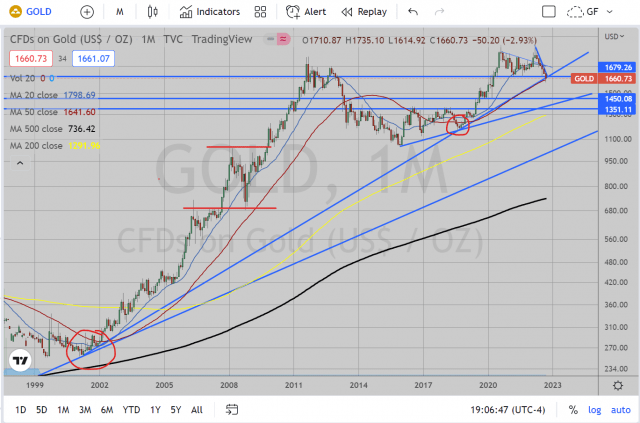
I wanted to show the monthly so you can see the ascending trendline starting from 2001 through the September 2018 low. It’s also a little difficult to see but the 50 month EMA is right there along with this trendline right now. On a monthly view, Gold has successfully tested this average and trendline and successfully closed this month pretty much right there (hard to tell this zoomed out. What I find really interesting, from a macro point of view, is that despite Gold’s reputation as a safe haven it seems to have been falling along with equities most of this year since the March peak.
I think a big reason for this is the strength of the dollar. But I always want to consider simply the mindset of the investors. Everyone who piled into Gold after the Ukraine invasion was expecting this to run through to new highs immediately. But Gold had other plans and has been dropping down instead. This felt a little familiar and it brought me to look at the little chunk of time from March 2008 to October 2008. This was an interesting time in our markets because equities were weakening at the time. So one would think that while stocks were decreasing Gold should be increasing, right? But instead, from March to October of that year, this dropped along WITH stocks, from 1032 to 681, a 34% drop! So much for safe haven.
But when the market finally imploded in October, the Gold bottom was in and it pretty much ran up over the next 3 years to new highs at 1920 in September 2011 (more than triple). And here we are now, with a very weak stock market, teetering on the precipice, and Gold is again acting weak along side it. Now, I’m no economist so I can’t reveal some underlying architecture on how this Gold market functions. I just like things that rhyme. And if the market sentiment is anything similar to the way it was in 2008, then investors are beginning to unload their holdings to raise cash, safe haven status be damned. A 34% drop from the March market peak of 2075 is just about 1369. I’ll refer back to this shortly.

From a more technical perspective, there was clear medium term support at 1680 since the breakout in Mid 2020 (due to COVID). However, this most recent descent led to simultaneous breakdowns through (1) this support level, (2) the 200 week EMA, AND (2) the trendline dating back to 2001. These are three big breaks, which sends a clear message on sentiment for this stuff. In terms of potential targets, there seems to be wide open space down to 1450, or even the breakout level from the basing pattern between 2014-2019 at 1350 (This is awfully close to that 1369 potential drop mentioned after the monthly chart). You’ll also take care to notice the break down through the 200 week EMA last week and the retest green candlestick this week.

Lastly, on the daily we can see that action on the ground level, so to speak. This breakdown beneath these trendlines/support levels stayed cleanly beneath the descending trendline from the March 2022 peak. In the circled portion, you can see the trade down, consolidation attempt at support between 1660 and 1680, and finally the drop and pop back up to retest these levels from the underside. In addition, it is beneath the 20 day EMA while the descending trendline also coincides with the 50 day EMA.
To sum up, this seems to me a clean invitation to short this thing with a clear stop area above 1680 if you are playing real tight. As Gold can be volatile, however, I’d also look at the descending trendline as resistance should 1680 fail to hold, about 1720. From a risk reward perspective, I’m looking at a little more than 1:4, (Loss of about 60 points of room upside before it hits my stop versus potential average target of 1400, or 260 points). From there, even if decide not to or simply can’t short then I’d love to pick up some Gold long at 1400. The technical support is just too pretty down there for the potential upside
