The phrase for this title is usually reserved for pleasant memories and daydreaming of events one wants to happen, but I am using it as more of a relief for something which has not happened. I was concerned with the pattern we have been putting in the past two days in SPX. I posted this picture earlier today, but I am posting it again as a reminder:
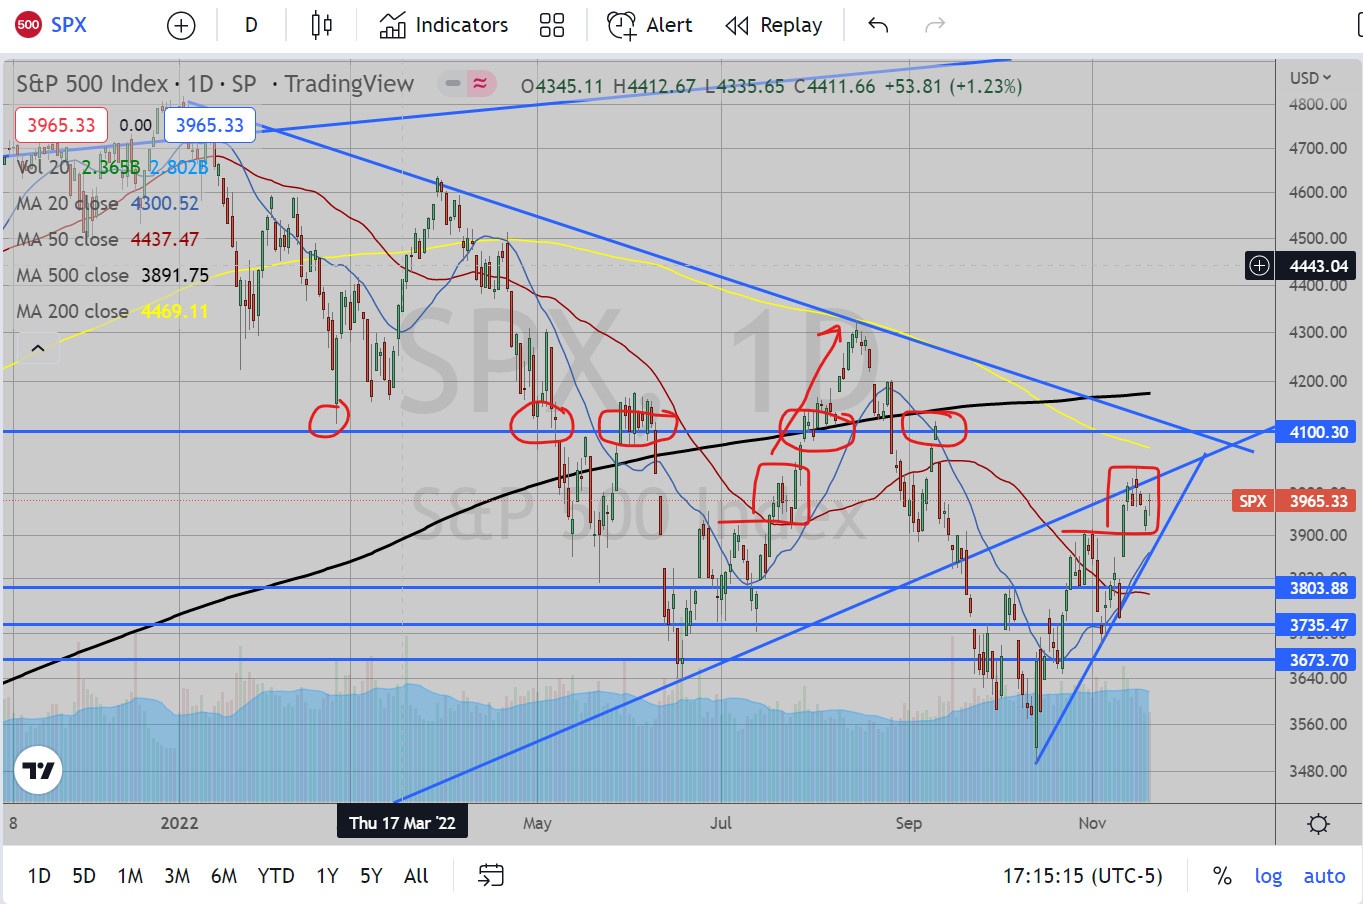
The July Breakout above 3920 was annoyingly successful from a technical perspective as SPX broke out to test 4012 then a textbook retest of the breakout level of 3910.74 (within 10 points, close enough) then gapped up and ran all the way to the mid-August highs. Now here we are in this November breakout with eerily similarity not only in the pattern, but even the same exact levels as July!
There is the breakout above October highs at 3906 to the November peak at 4029, the pull back and retest at 3906 Thursday and then a gap up Friday. I was extremely apprehensive going into today at the prospect of another gap up and run as I did not want another 2-3 weeks run like we had in August. So, small victories are victories nonetheless in that we kind of just petered out with Friday’s candle.
There are a few notable differences that make me rest a wee bit easier than in July. First, when we broke out in July we had been just coming out of a prolonged 6 month downtrend. The breakout above 3920 coincided with the break above not just short-term resistance since late May, but also the 50 Day EMA. Everything was coiled to make a run (20-20 hindsight is possibly the greatest superpower every trader has). In contrast, however, this November breakout is occurring in more of a sideways moving market since June. The run up since the CPI numbers was a big stretch and we are far above daily averages with the 20 Day EMA at 3866 and the 50 Day EMA all the way down at 3790. There is also a lot of overhead technical resistance from recent months that should serve as firm ceiling on continued buying.
I decided to draw a fib retracement zone from August high to October lows as this seemed to really encompass a lot of price action going as far back as April when we broke down into this zone. Using this Fib zone there is a 61.8% retracement level at 4008. There is the COVID low Ascending trendline which we are currently retesting (also lining up around 4k). There is the overhead 200 Day EMA around 4067 as of today.
Then finally there is the next big round number 4100 which also has been tested and chopped around since April/May. All this is to say “look at that resistance!”, but as we also know the market may decide to cut through all that quick and easy (a little too easy sometimes). But to bring this all back to my first point, a gap up and run could have happened today but it didn’t. SPX was perfectly primed to run up and leave bears puking for Thanksgiving. But we instead got this doji star pattern today.
This is very heartening because it may mean the buyers are petering out a bit. We shall need to see how next week pans out, then finally the so-called potential “Santa Claus Rally”. A break beneath 3900 is needed to place this breakout attempt into firm “failed breakout” territory.
Now, not to sound like a broken record, I have not been short the SPX since the November breakout. This hit my stop and I exited. That sucked. As I stated in prior posts, however, I devoted my buying power to getting shorter TSLA. It has been so weak and performing so much better than my SPX short that I realized I should have been shorting it this whole time.
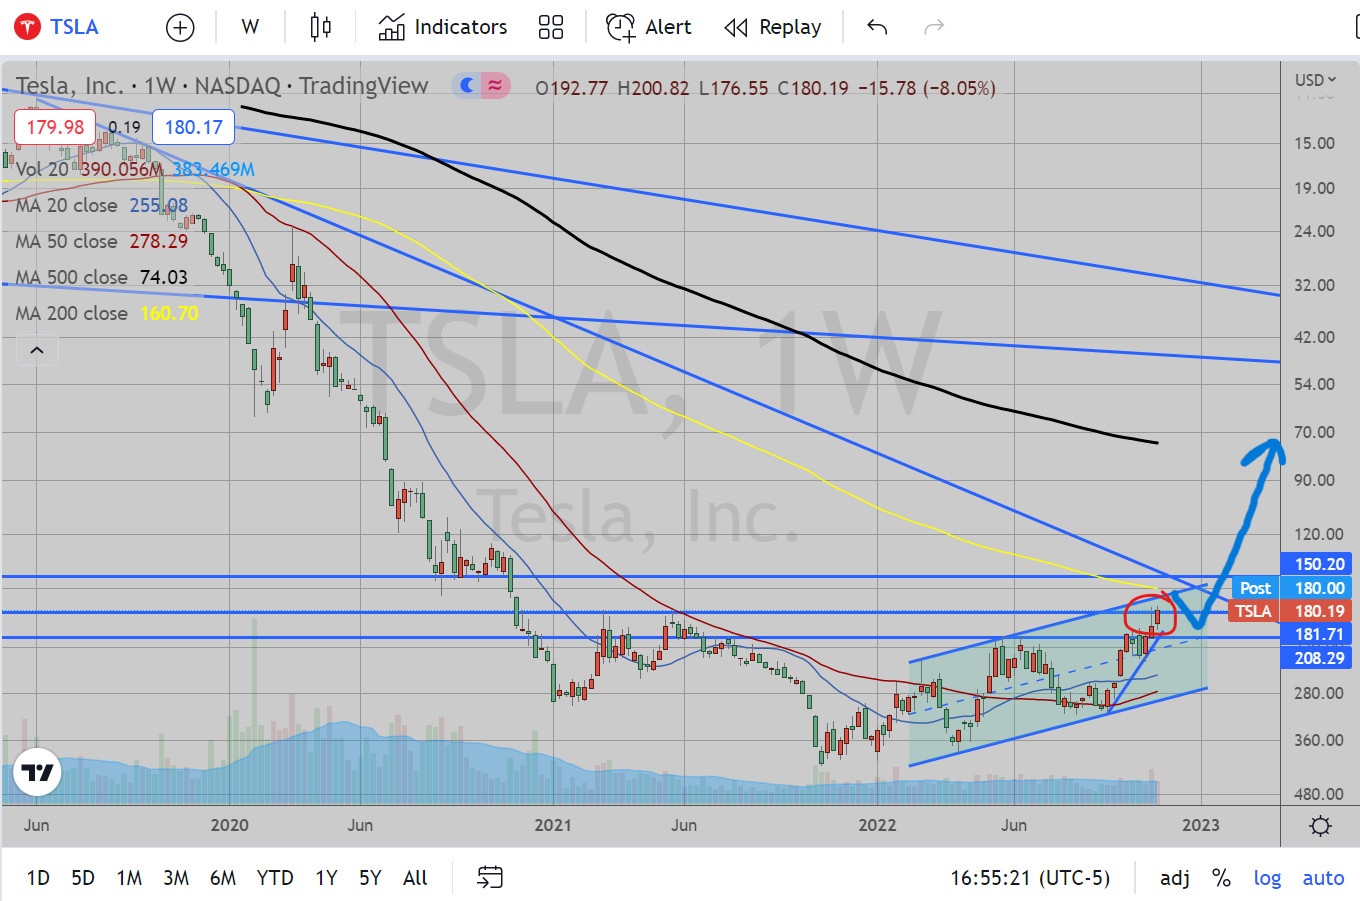
This week in particular has been a very interesting one because today’s close has successfully closed this at the previous support level at 180. What makes me excited about this short is that it looks like it really is just getting started. I purposely inverted this chart to make this point. Doesn’t that look like a perfect basing pattern?
With a weekly close at the “top” of this pattern, above those weekly averages. In terms of the technical support levels, we have this channel that we’ve been in since the peak (a very wide channel). There is the 200 Week EMA at about 160, and the Ascending trendline from the June 2019 lows and the previous resistance in late 2020 at 150. I’m expecting this to hit between 150 and 160 very soon where I will cover a good portion of my position, perhaps in the next two weeks. I’m then looking for this to bounce back to 200-208 area where I will load back up and am looking for this to drop. I don’t think this is done. If this can then successfully break down, I’m looking at targets around $60, the ascending trendline from September peaks in 2014 through June peaks 2017.
There you have it folks. I know I treaded some old ground here, but today’s action on SPX seemed noteworthy and the TSLA weekly bar close was too pretty not to comment.
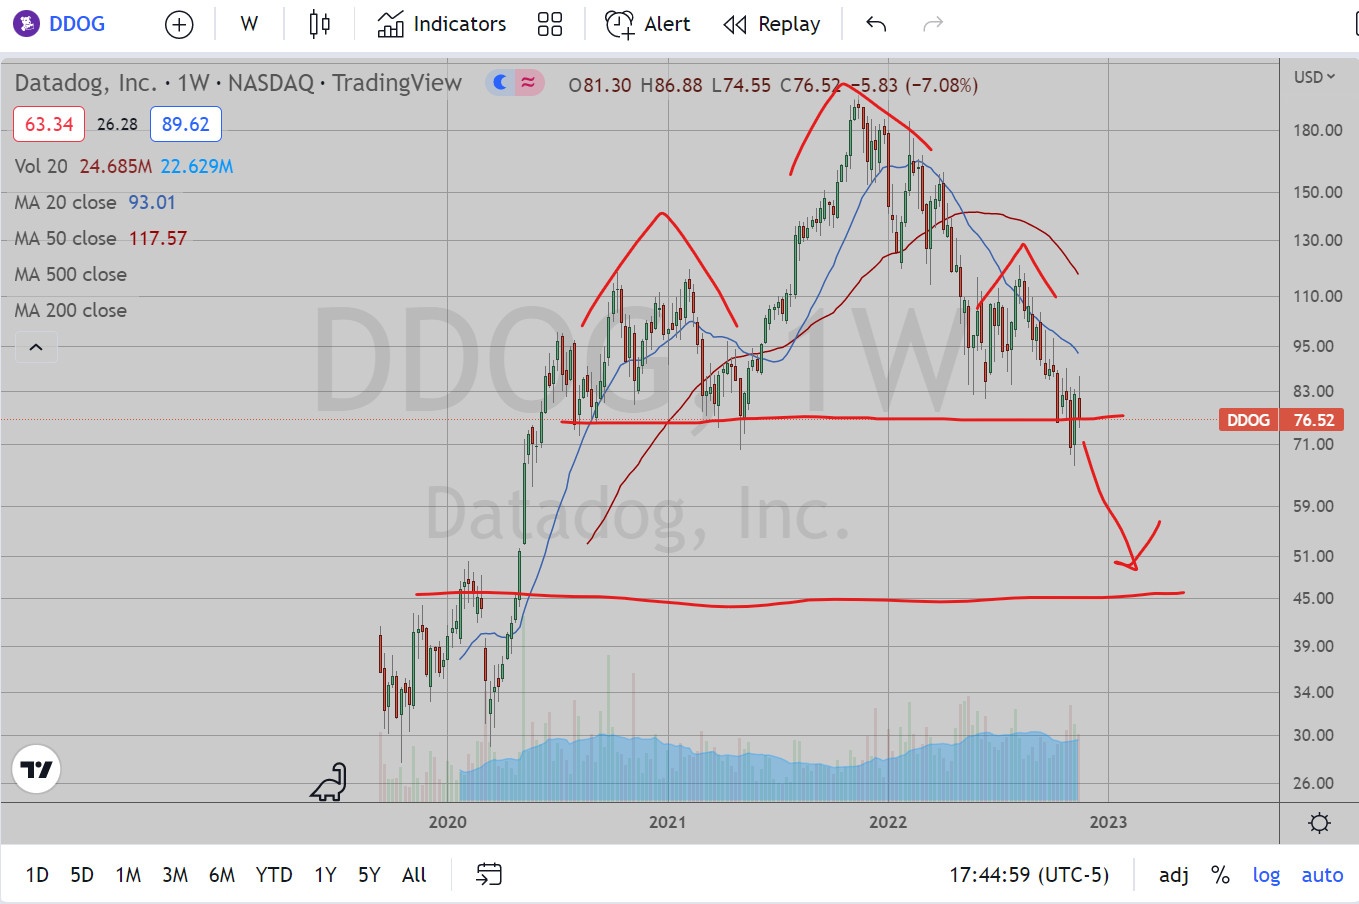
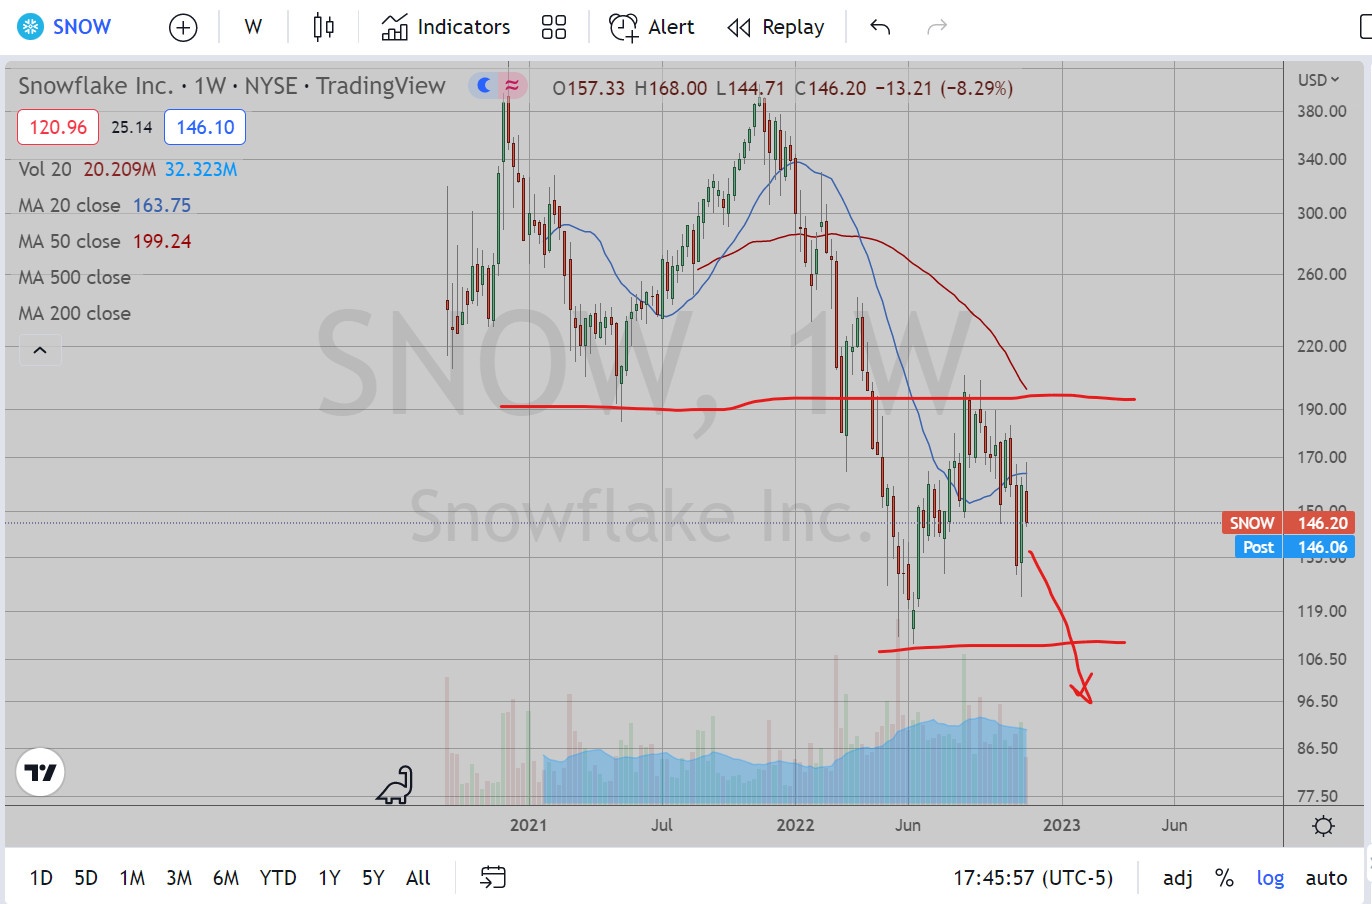
Here are also two other stocks I’ve been watching, but not trading. I’ve commented on these before, but they are shaping up pretty nicely. They have very high P/E ratios (or even negative EPS?) so I think the potential for the fall is very large. I hope some of you can make some dough on these. But as always, do your own due diligence, pick your own spots and make trades that make sense for your own risk tolerance level. Have a great weekend and good luck to all this coming week.