Greetings to my Slope family. Now that we’ve made it to August of this year, the bullish combination of seasonality mixed with the March Fed banking bailout appears to be wearing off. I wanted to take a step back and look at the big picture once again, along with some of my primary positions that I’m holding heading into the end of the summer.
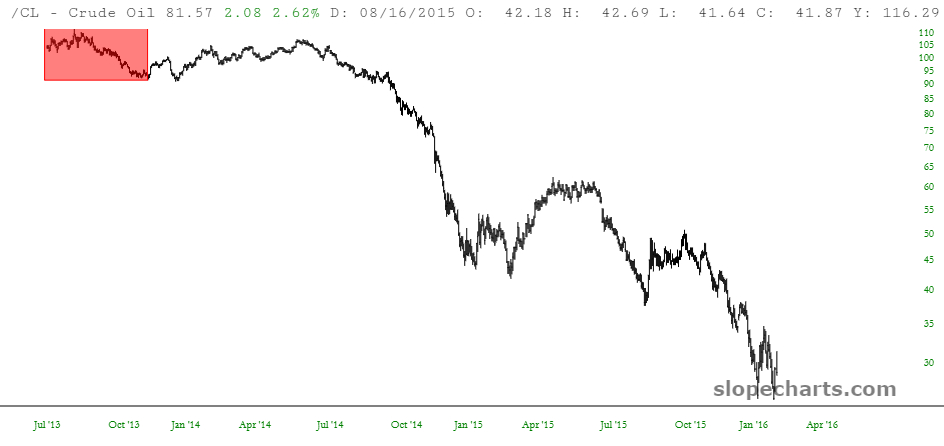
First, let’s take a look at the 10 year crude oil to broader market analog. I think this will be important for both the remainder of this year, but I also believe it will be an important guidepost for what is coming down the pike over the next couple of years. As a reminder, what crude oil did ten years in the past gives us a good echo for what to expect the broader market to do in today’s market. This is not a tick for tick, day by day analog. It also focuses on direction, not magnitude of expected moves.
The chart below shows /CL from August of 2013 thru January of 2016. I think this is the type of market we can expect over the next two and a half years in /ES. The red box in the top left of the chart shows the time period we will be echoing in /ES from now into the end of November of this year. While we may see a bit of a snapback to the weakness we’ve seen to open August, I think the overall direction will be bearish between now and October/November of this year.
As we get into the early part of 2024, I’ll be on the lookout for a bullish advance to retrace some of the weakness we will hopefully experience this year. As we approach the summer of 2024, the outlook for stocks heading into the election and after is decidedly bearish.
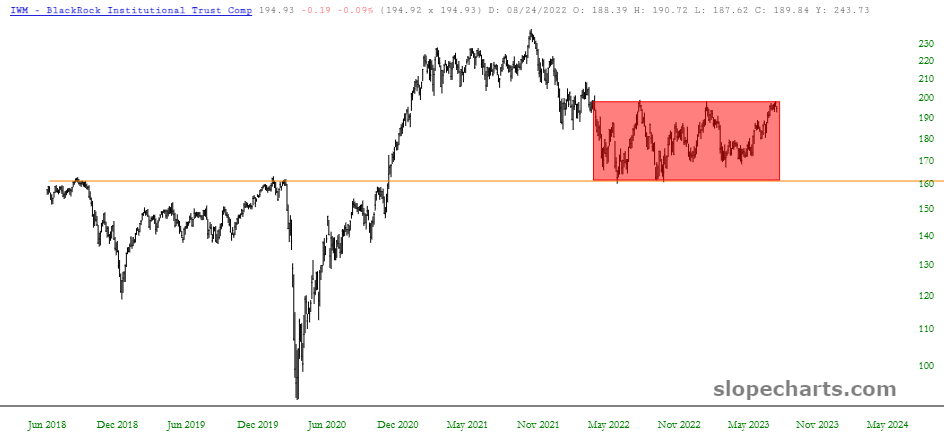
My largest position at the moment is short IWM, the small cap ETF that tracks the Russell 2000. Looking at the chart below, IWM has been consolidating sideways in the red box since its low in June of 2022. A few notes to pull away from the chart. First, the red consolidation zone found support at the pre-Covid highs, and has yet to pierce under that level. Second, IWM can be seen as one measure of overall liquidity in markets.
While the QQQ’s and SPY have seen greater advances this year, IWM has lagged behind. I take this as one signal that liquidity remains tight, in spite of the high-flying advances of big cap tech this year. As we move into the fall, my first target for IWM would be a test of the pre-Covid highs again. A move below that horizontal is possible, and would open the door to a more powerful decline this fall.
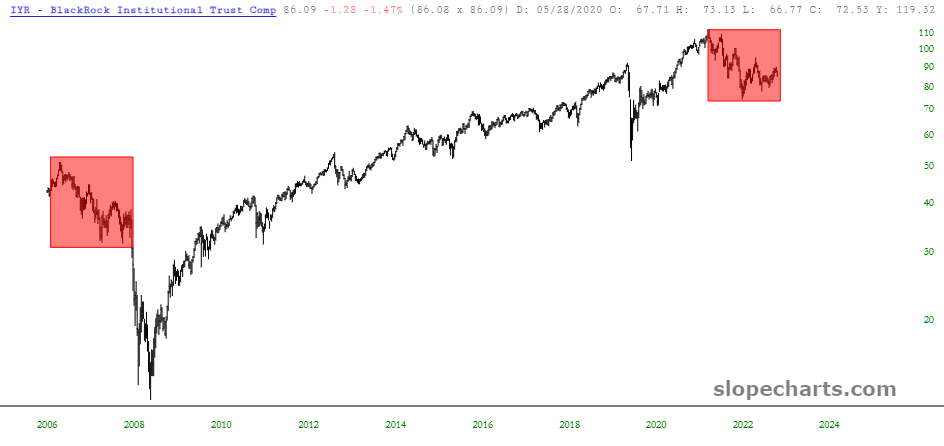
Next, let’s take a look at IYR. This ETF focuses on a variety of different types of commercial real estate in the U.S. The first chart below shows the performance since the Covid crash. Compared to IWM, notice that this ETF has already moved below its pre-Covid highs, and has maintained a clean series of lower highs and lower lows since the start of 2022. IYR appears to have made another intermediate term high at the end of July, and has resumed its downward movement thus far in August. As we move into the fall of this year, I expect a break of the trendline off the October 2022 low. To see the potential in this chart, let’s take a look at a possible analog.
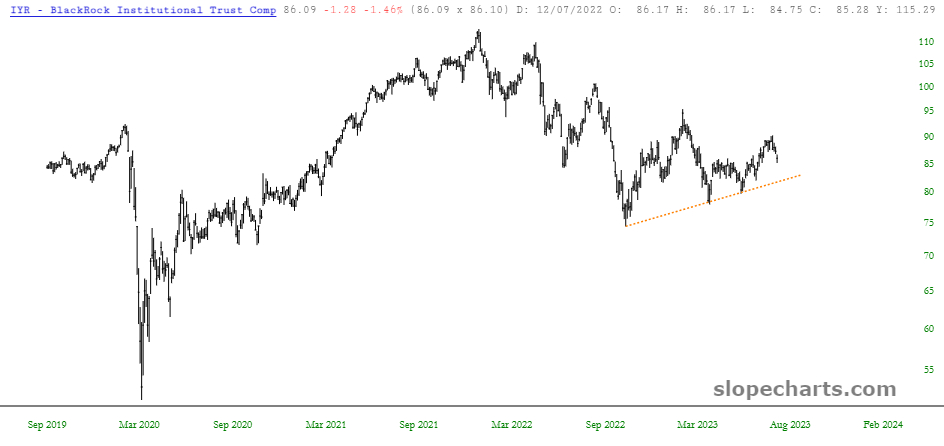
I noticed IYR’s analog to its 2008 price action earlier this year, and have continued to track it. The two red boxes below compare IYR’s decline since the start of 2022, to its 2007-2008 action leading up to its collapse in the fall of 2008. The problems in commercial real estate in the U.S. are well documented, and I continue to think the below analog bears watching until proven otherwise. IYR is my second largest short position. I am short the ETF, as well as holding January 2024 IYR puts.
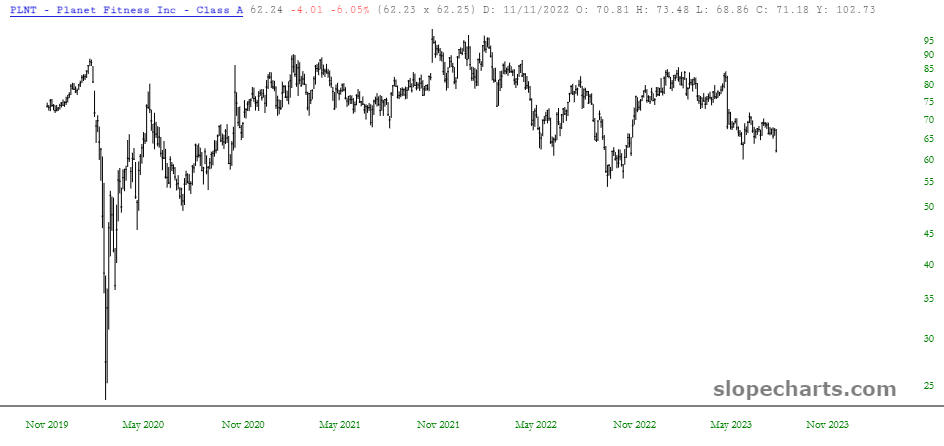
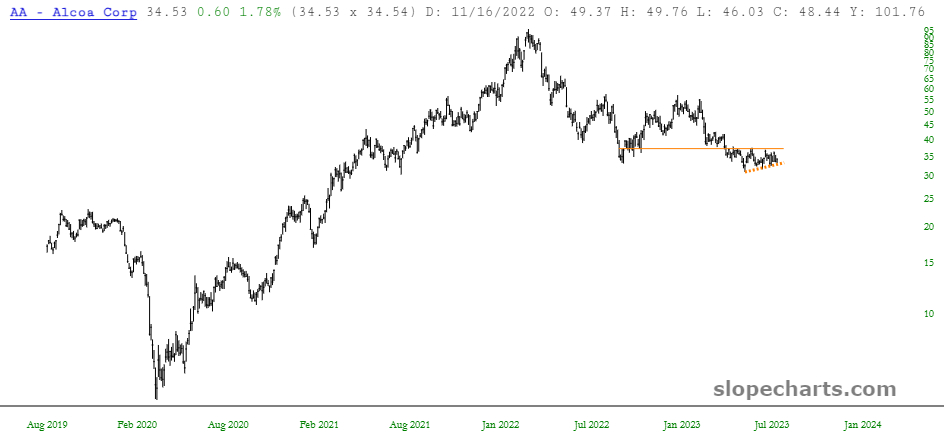
Finally, let’s take a look at two individual names that I continue to hold short. Alcoa and Planet Fitness are shorts I’ve been holding since late-January of this year, and both have continued to perform well. Looking at the charts below, I think both are primed for significant declines in the months ahead.
Alcoa, shown below, has already broken below its 2022 lows, had a brief consolidation afterwards, and appears to be ready for a possible significant decline. The horizontal line shown can be used as a stop loss, and a breakdown of the trendline shown off the late-May bottom can be used as a bearish trigger.
Planet Fitness reported earnings this morning before the opening bell, and are currently down 6.5% today on the session. The stock continues to sport a 55 P/E ratio, and I think over time this stock will take out its Covid lows in what is likely to be a difficult next couple years for the U.S. consumer.