
These are my top reasons for being bearish here. This is not a timing call although in my opinion, the market has been the walking dead since the AI-spike. Most of these are slow moving data points though and say nothing about short-term action or sentiment.
Give Me the Best Risk-Adjusted Return
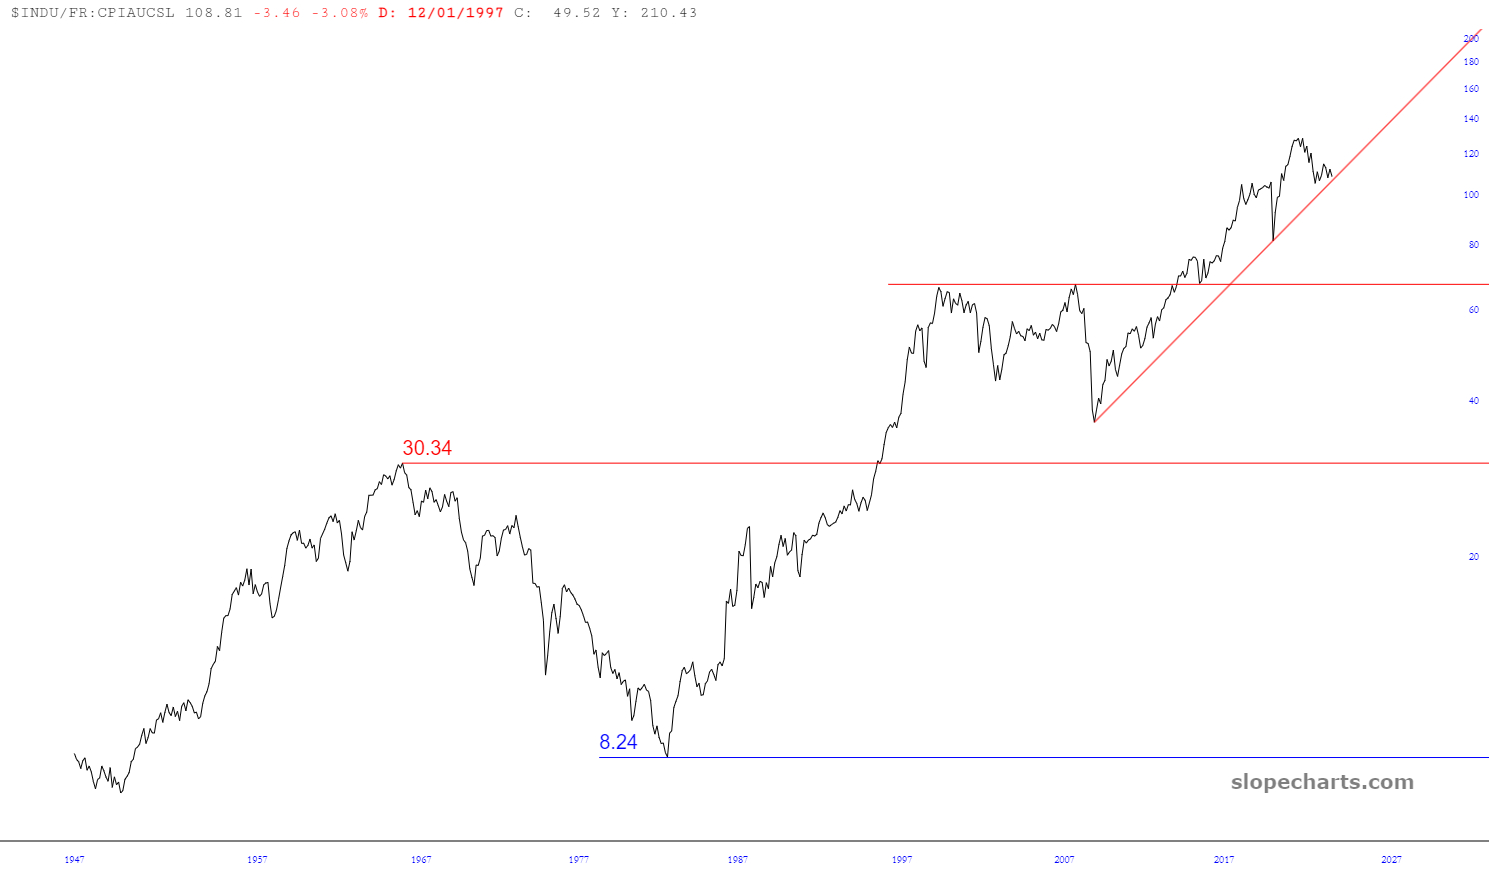
The DJIA divided by the CPI. There are two potential bear markets: 1930s (2000 and 2008) or 1970s. Big difference in the performance of commodities and bonds. Stocks will also be difficult for trading in an inflation scenario. It could be 2022 and 2023 repeated for years while inflation incinerates purchasing power.
Is this cheating? I don’t think so because bond yields will keep rising in this scenario. High-yield floating rate junk funds are already at a 10 percent yield. The DJIA is down ~13 percent, the Nasdaq ~20 percent. Floating junk is down around 5 percent from their peak.
In a bear market, stocks will suffer a 60 percent decline in real terms.
Here’s the near-perfect scenario for bonds under inflation. Let’s say the CPI averages about 5 percent for the next 6 years, or a 30 percent decline. The Nasdaq will undergo three more periods like 2022 and 2023, down ~40 percent and then rally ~50 percent. Result? The Nasdaq is down 30 percent from price decline and another 30 percent from inflation, a real loss of about 60 percent.
In this scenario, the assumption is interest rates have basically peaked. An investor won’t need to hold individual bonds in this scenario. High quality corporate bonds currently yield 5 percent, or 30 percent without compounding. An $10,000 position in stocks sinks to around $7000 and bonds rise to around $13,000 in nominal terms, or about $5000 and $9,000 adjusted for inflation. Bonds are not a great buy, but they are better than stocks in this scenario. The simplest bear scenario requires no recession. It only requires bonds crushing stock returns.

A variation on this is John Hussman’s model. It uses factors such as the market capitalization divided by the value added by corporations.


His model has a 60/40 stock and bond portfolio yielding an annualized return of less than 0 percent for 12 years. These are nominal returns. If the portfolio is gaining about 1.6 percent from holding 40 percent in bonds yielding around 4 percent, stocks would have to lose an annualized 2.7 percent to offset that. That works out to a roughly 40 percent decline into year 12, the year 2035. More likely, stocks implode into a hole and then climb out. A two-thirds drop takes stocks to my full-blown bear target of SPX 1500.
I can show this valuation situation with two other charts. One is the DJIA. The index currently sits at a line formed by the 1929 and 2000 tops, two obvious bubbles in hindsight. This line has a slope of 5 percent. Since I’m rounding everything off, let’s tack on a 2 percent yield. That’s a 7 percent annualized gain.

An 8 percent annualized return was considered good over most of the past 40 years when inflation fell along with interest rates. Maybe equities are going to turn out to be very undervalued because some positive Black Swan comes along. If not, an 8 percent annualized return will require the DJIA tracing a trendline formed by the 1929 and 2000 tops. The bubble that never ends.
Before I go further, let’s go back to Hussman’s model. He uses gross value added from non-financial companies. Here’s the profit per unit of gross value added. The purple line is a regression:

Peaks in 1985, 1997, 2006, 2014 and….now? This is the longest stretch with no move below the line. It’s as far off the line as it was in the three peaks prior to 2014. Not only are stocks at an expensive valuation based on their value added, but earnings rest on very high profit margins.
In contrast, if you use the S&P 500 operating P/E as a predictor, your projections for market returns will improve substantially if you also include information about profit margins. But here’s the kicker. The profit margin gets assigned a negative coefficient. Stated another way, for any given S&P 500 price/earnings multiple, the higher the profit margin, the worse the subsequent market returns. As an investor, the higher the S&P 500 profit margin is, the less you want to pay for a dollar of earnings, because that high profit margin is probably not durable. When profit margins are extreme, paying a normal multiple for a dollar of earnings is equivalent to assuming that the extreme profit margin will be sustained forever.
In a nutshell, high profit margins at extreme valuation points delivers a double-whammy to investors. Revenues fall and the profit margin on those revenues decline.
We don’t need a recession for some partial version of this bearish scenario. If wage inflation kicks in, corporate costs will rise. Interest costs are rising. Return to the trendline alone and a bear market is possible. Go below the line and something like the 70 percent Nasdaq decline in the early 2000s looks like a possibility.
This is Expensive Stuff
The only thing a smaller investor controls is the price they pay for an asset. A moderate return scenario requires stock hugging a growth line formed by the 1929 and 2000 tops. Anything below that line will deliver sub-par growth. Take off 2 percent from that line (watch capital losses eat up dividends) and it delivers the same annualized nominal return as high quality corporate bonds. In what world does it make sense to own the equity of S&P 500 companies for a 5 percent return, when you can own the debt for a 5 percent return? Extreme ones such as hyperinflation, some kind of libertarian utopia where profits surge because the government disappears, but all order is maintained.
How about the current 10 largest Nasdaq stocks? Their support line has a slope of 21 percent annualized growth.

The Nasdaq 100 divided by the Russell 2000 Index. I’ve dubbed the continued domination of mega-cap tech companies, who are now censoring the general public and interfering in elections, as the techno-fascist future. There’s a path where this is a monster base that unleashes a totalitarian future. I wouldn’t like it, but at least I can imagine it.

Outside of those types of scenarios, history says the market is likely headed for a reversal. This year has been amazingly bullish, but it makes sense considering there is still rampant speculation and bullish sentiment in the markets. The Fed pumped in March like it did in October 1999. Here we are, back at valuations that in some cases rival the peak at the end of 2021. Is this the starting point of a new bull market, or the double-top terminus of the one that began in March 2009?
