
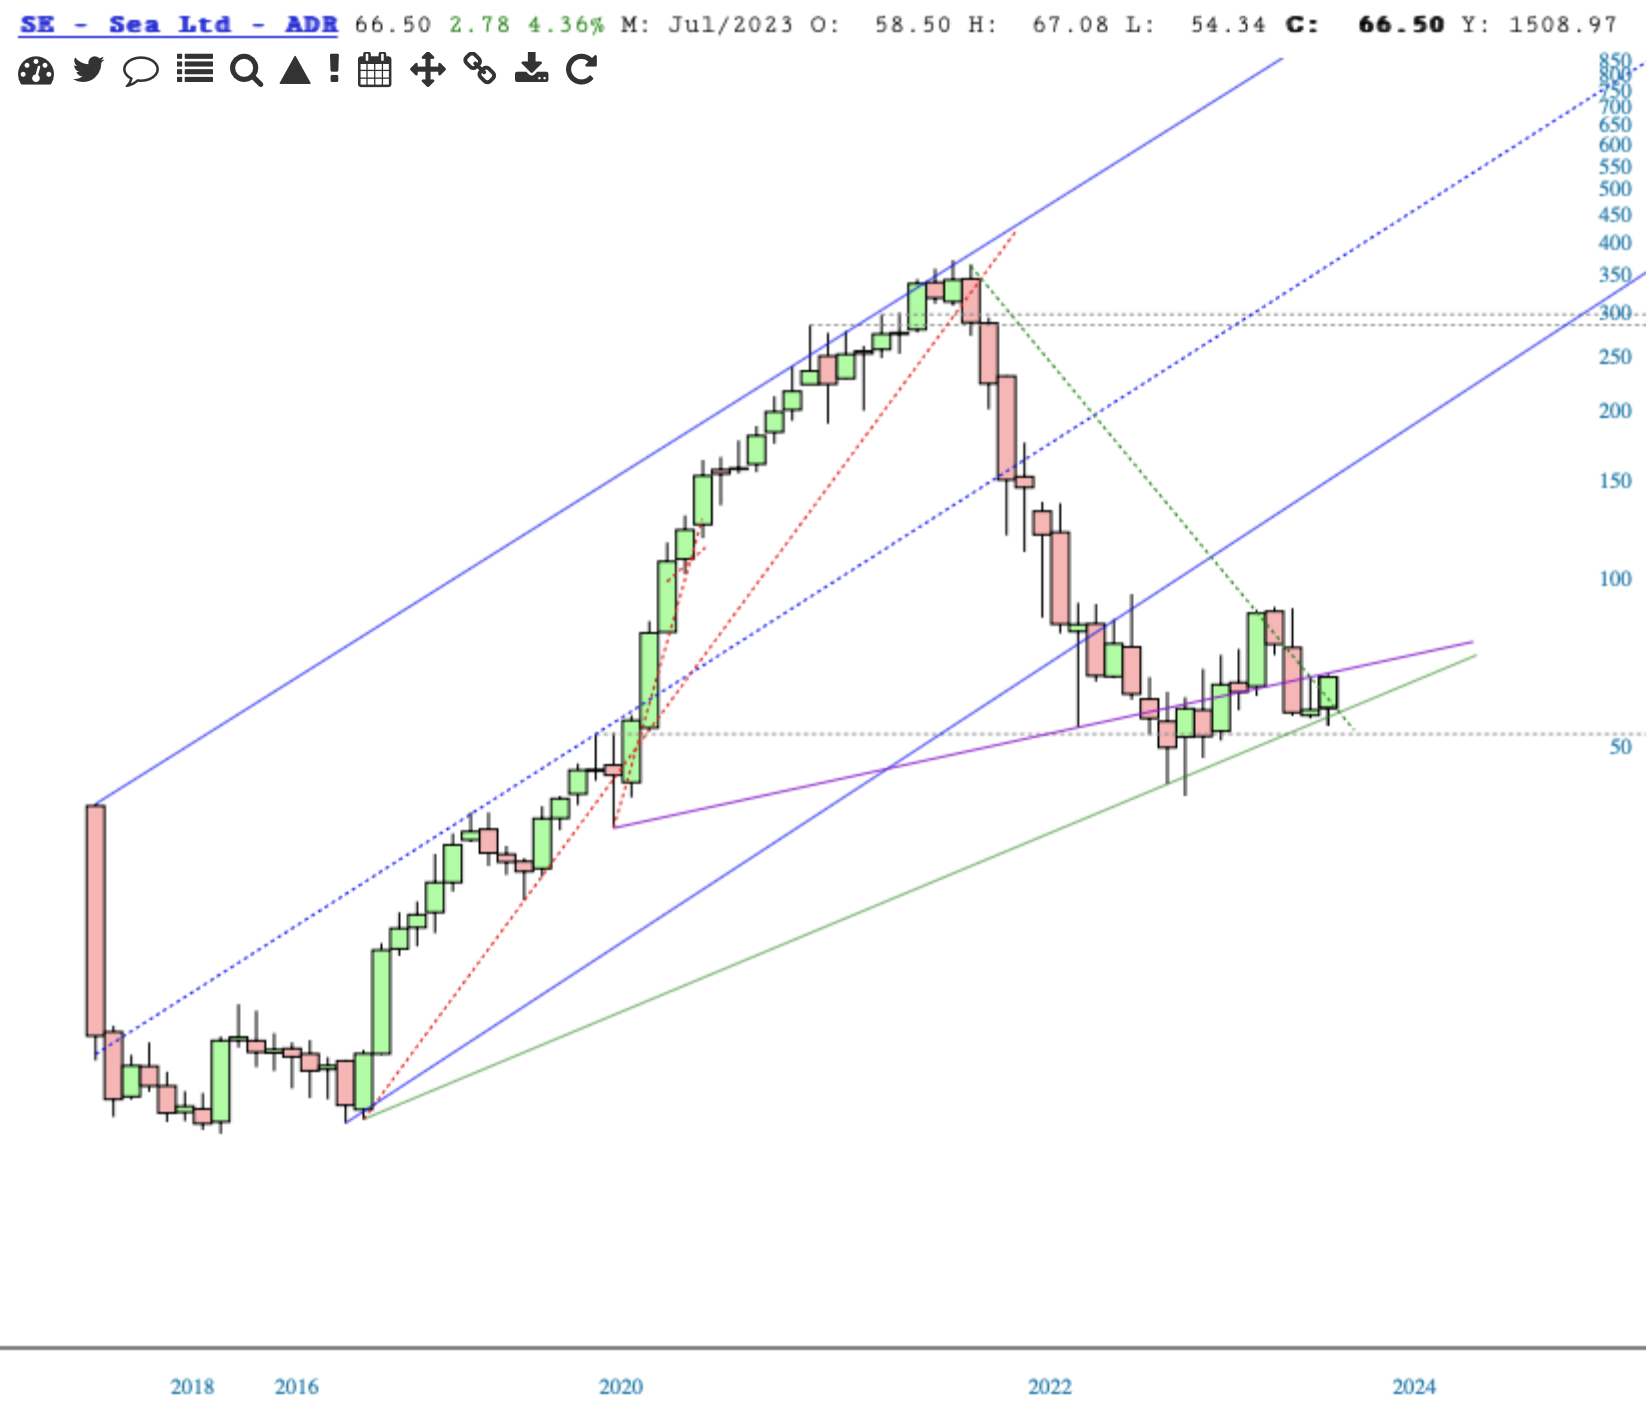
End of the month is especially fun to chart. Fun to see the inter-connectedness with all other timeframes, each being a part of the whole. If for no other reason then Baby Bear mentioned it yesterday, we start with the monthly chart of SE, which looks to be making a decent go of it. For bullish success, we want to stay above the green, and get above the purple.
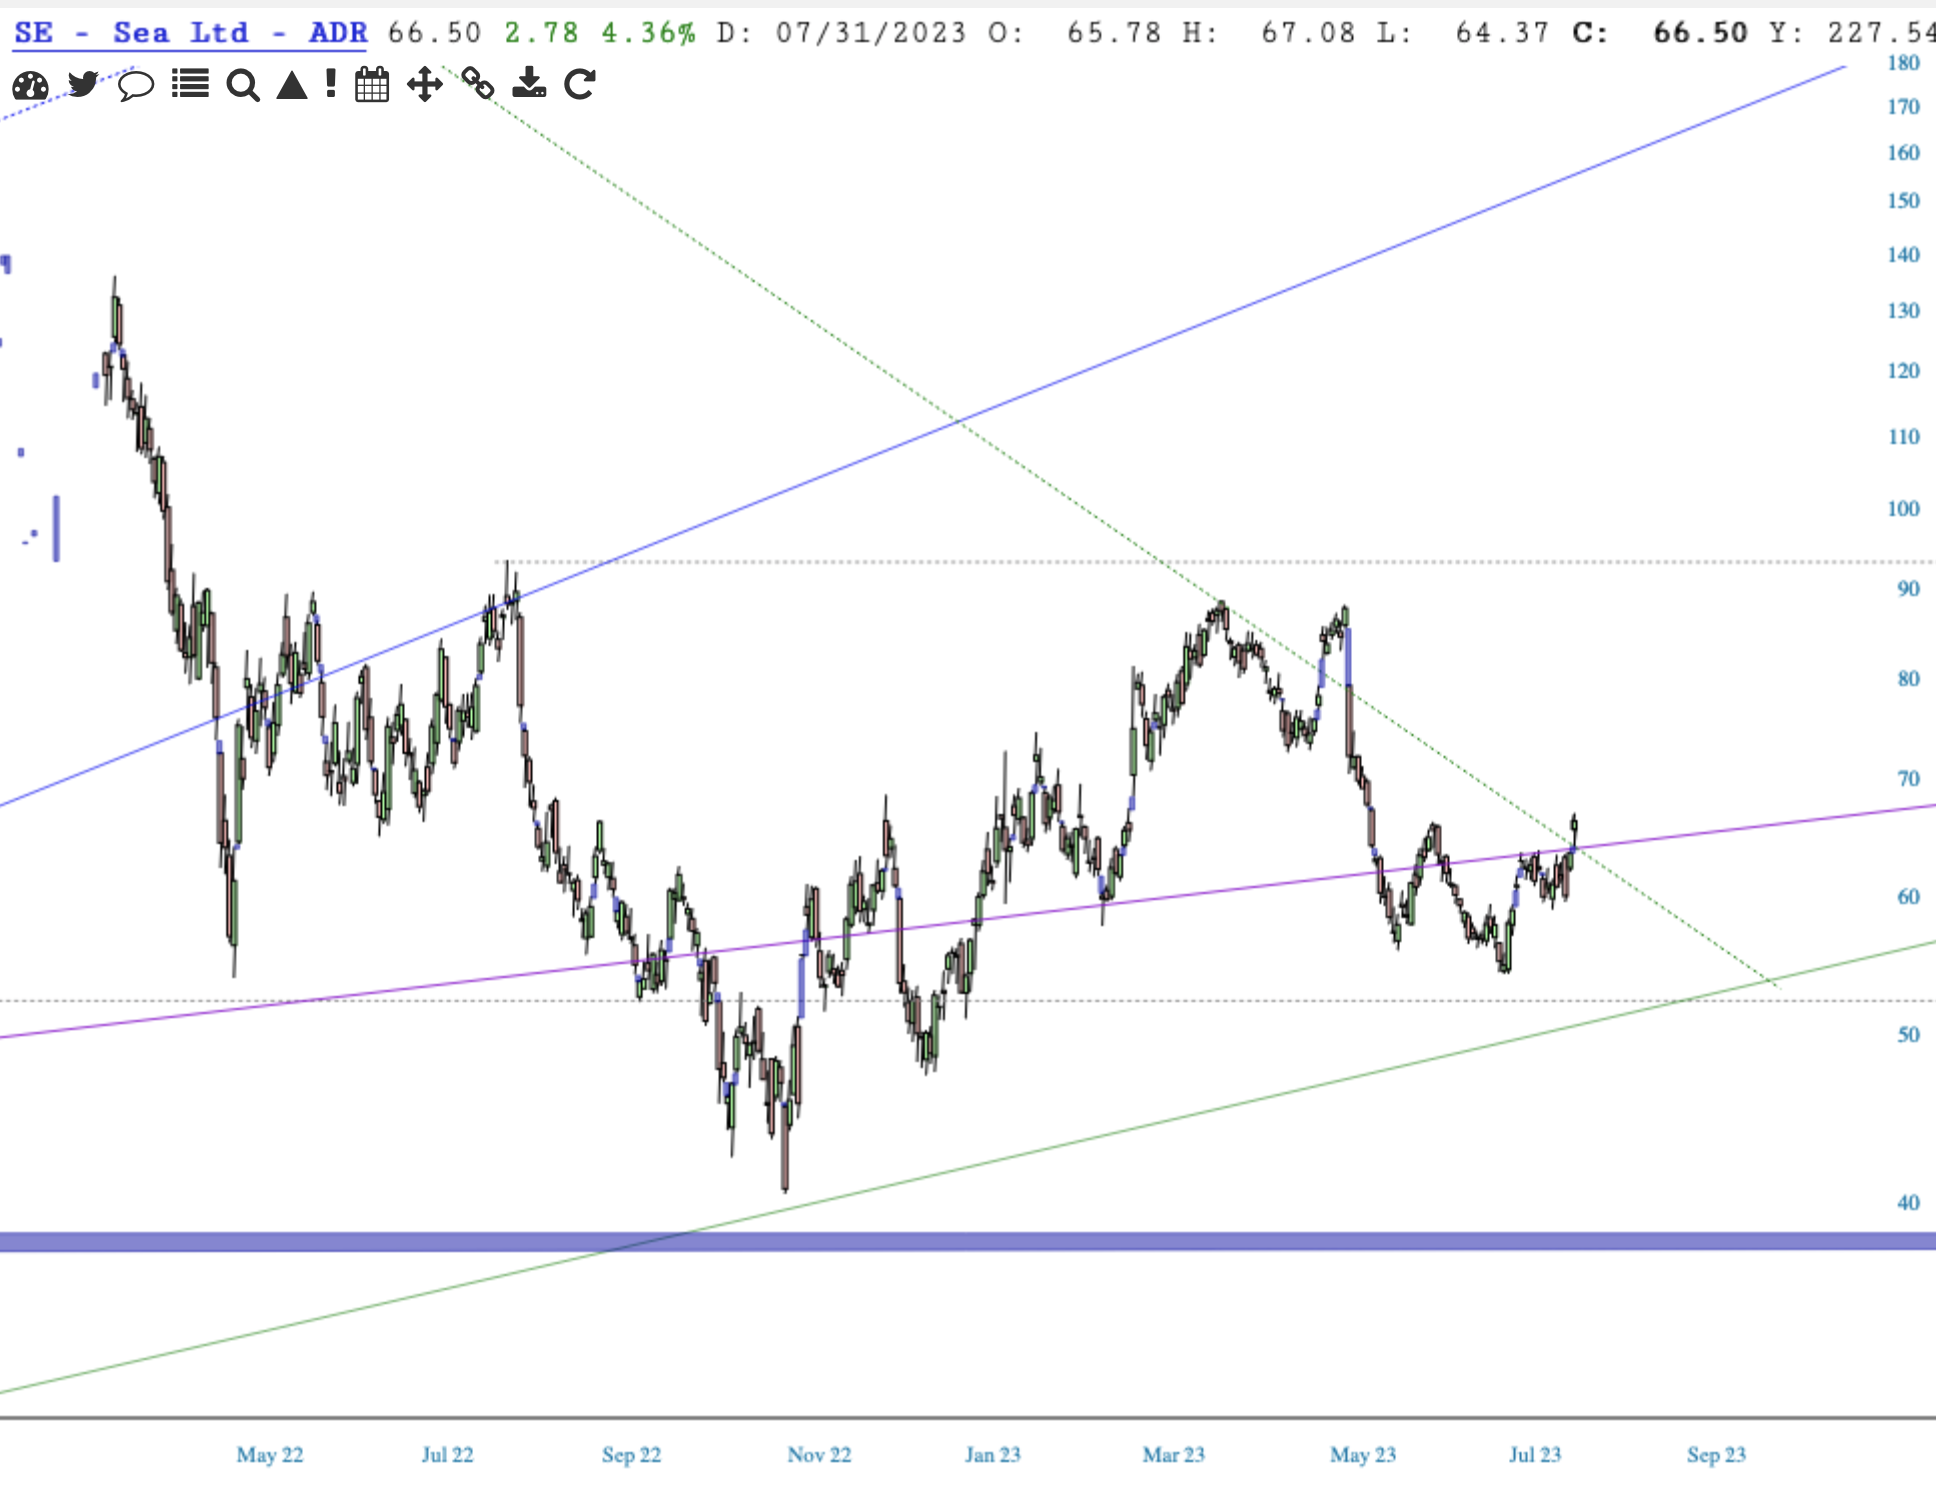
Here’s what happened yesterday on the daily chart (31Jly23) and we see that price popped above the purple. [Don’t ask me what the thick purple horizontal is. I didn’t put it there, it just appeared, and I can’t get rid of it.]
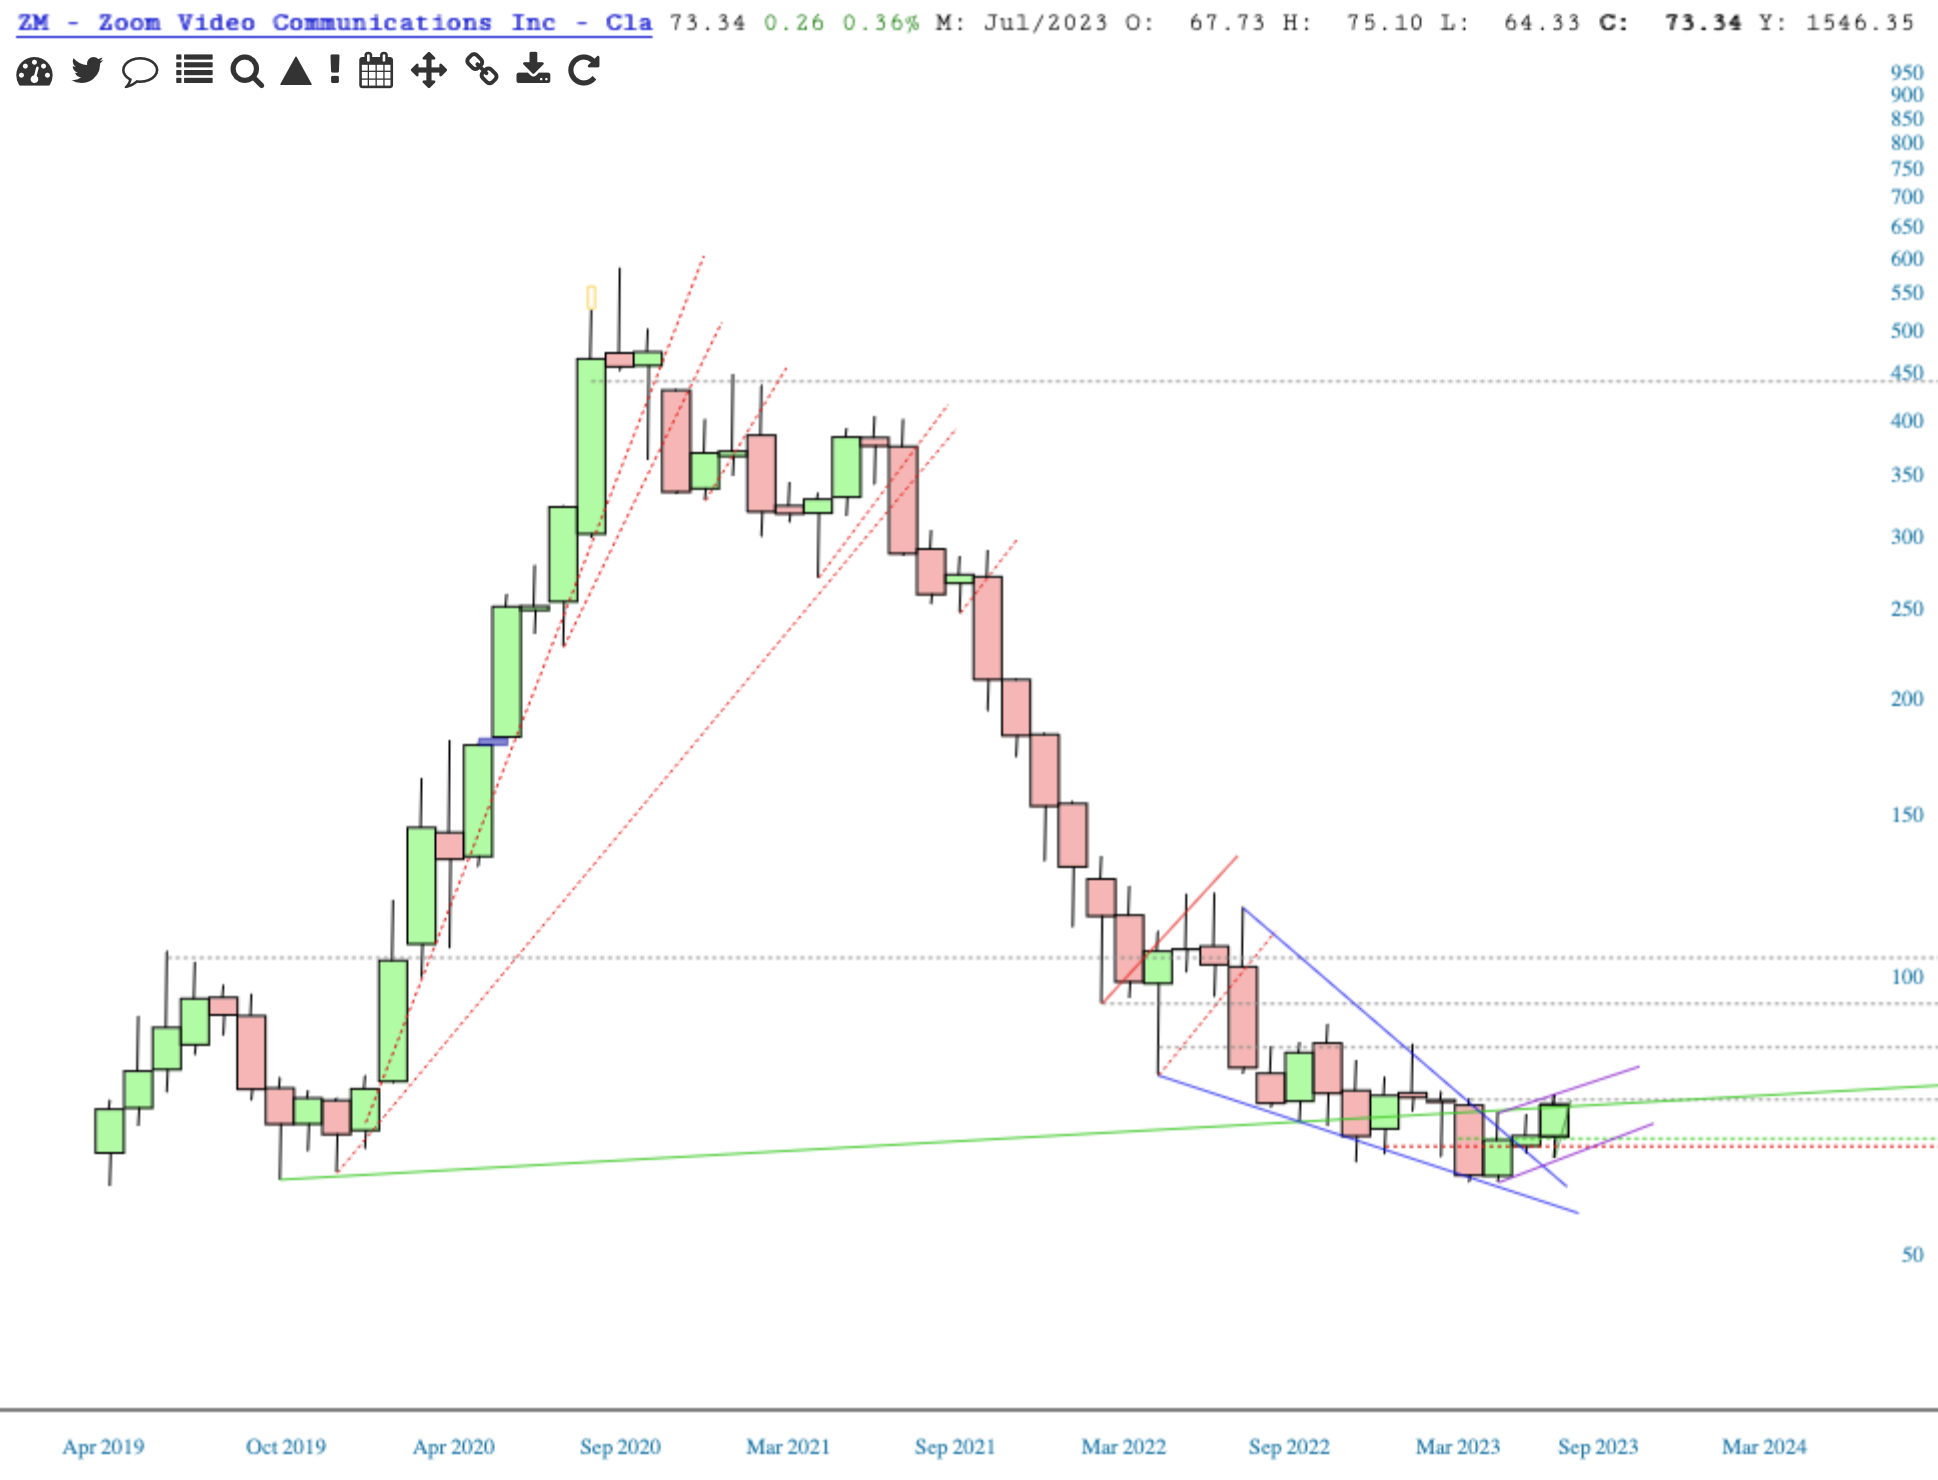
Another one leaning bullish is ZM and its monthly chart makes a pretty picture. Here we want to stay above the bottom purple and hold above the green.
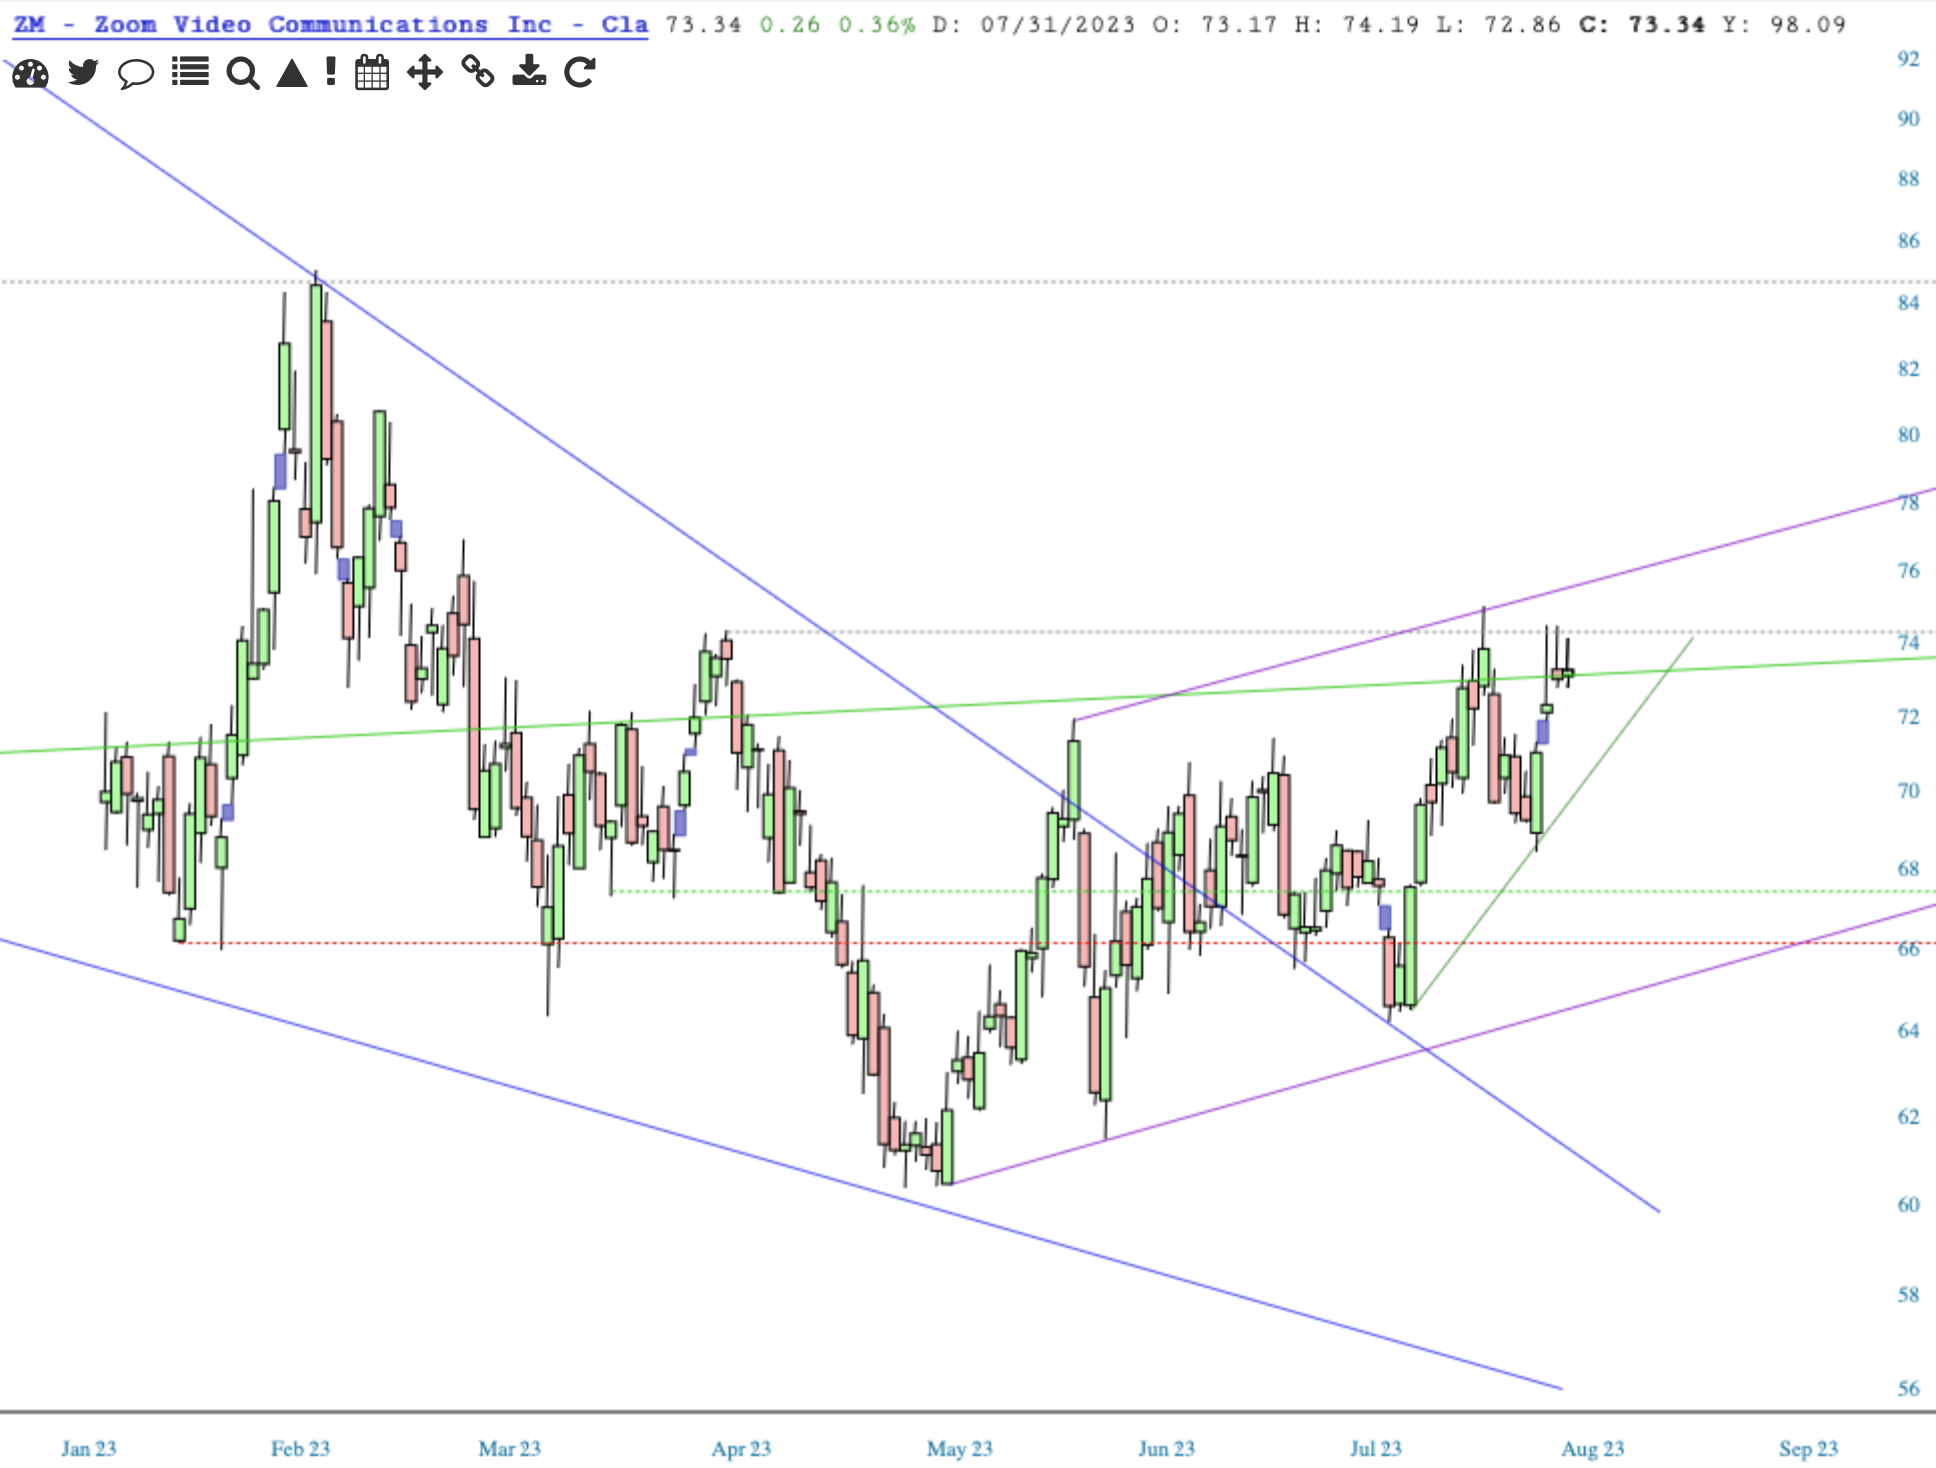
ZM’s daily chart is somewhat indecisive. Let the trend lines be your guide.
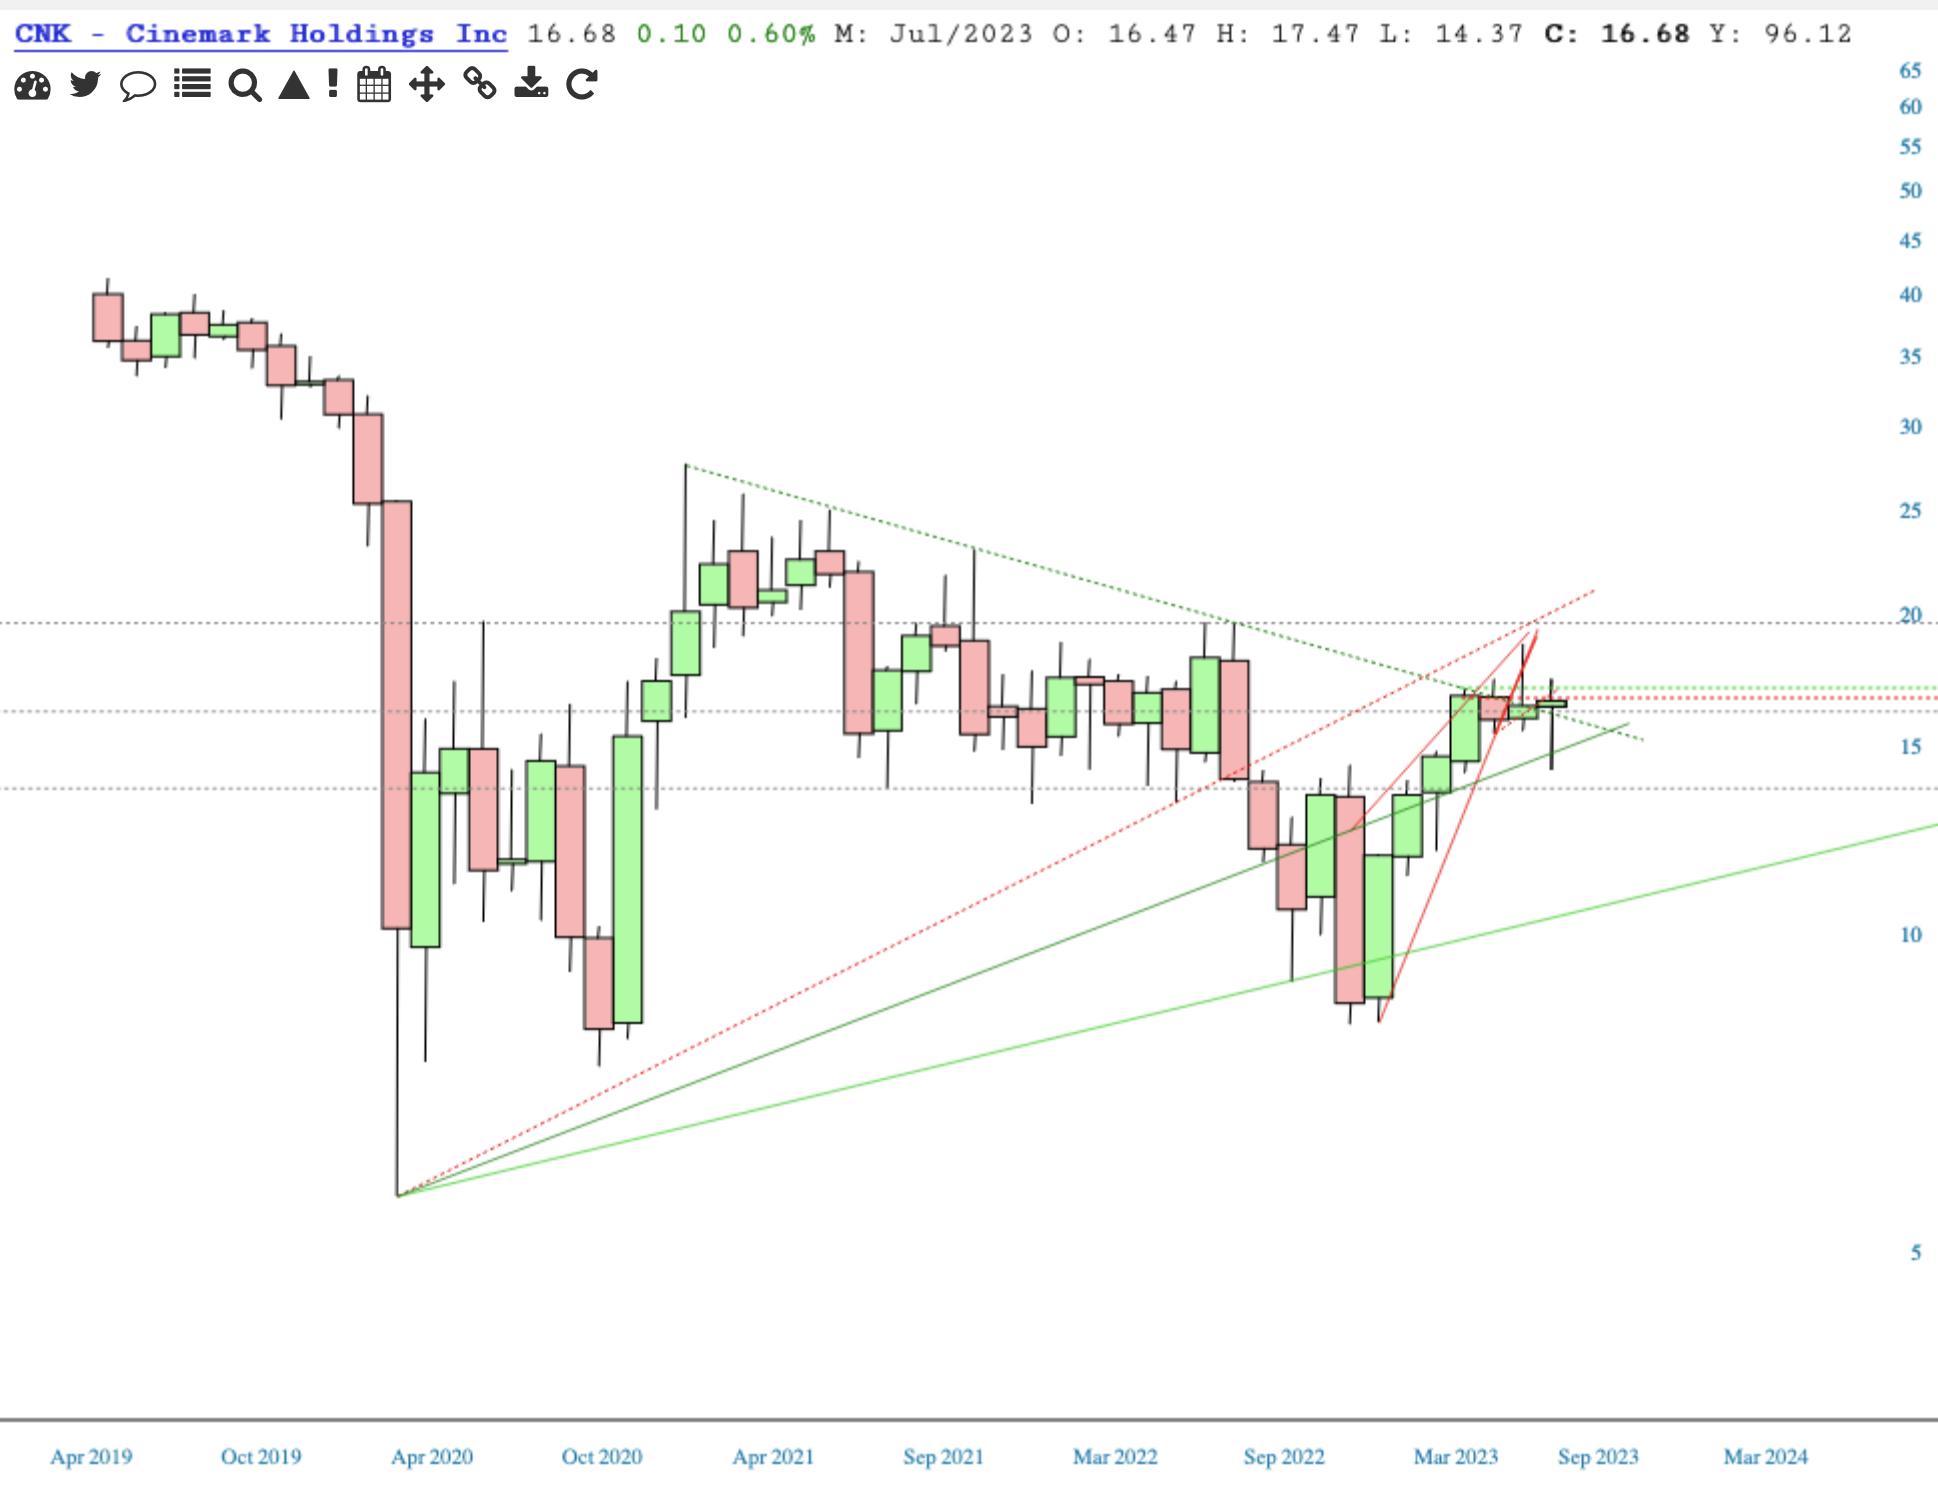
CNK is here because I’ve played it before. Most striking on its monthly chart is the wedge (red).
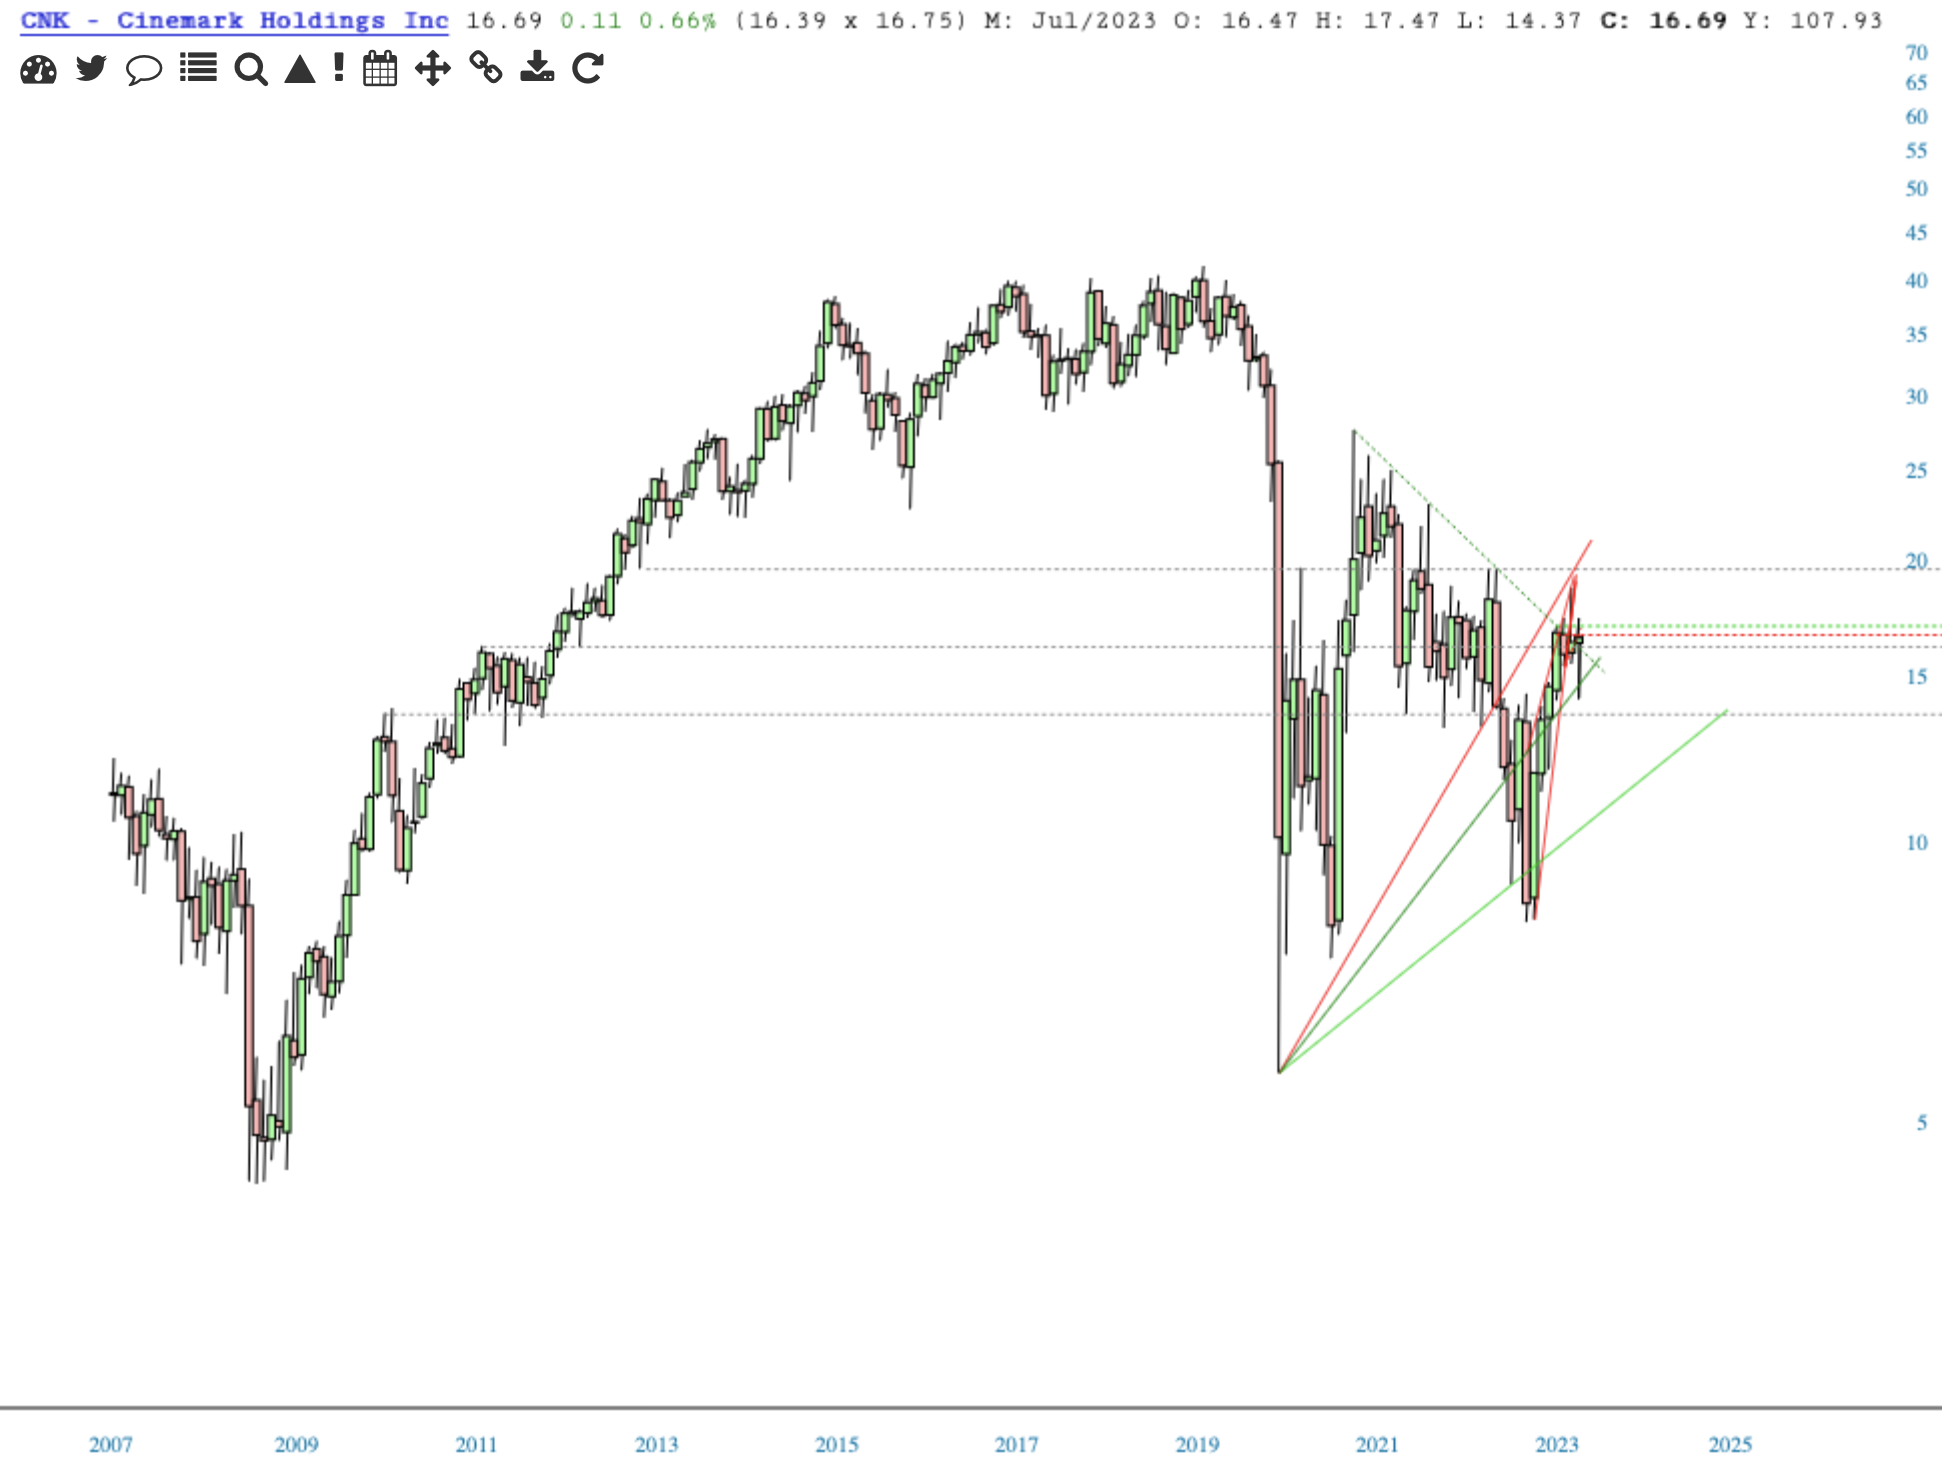
Looking closer at the monthly chart, there’s a wedge in a wedge.
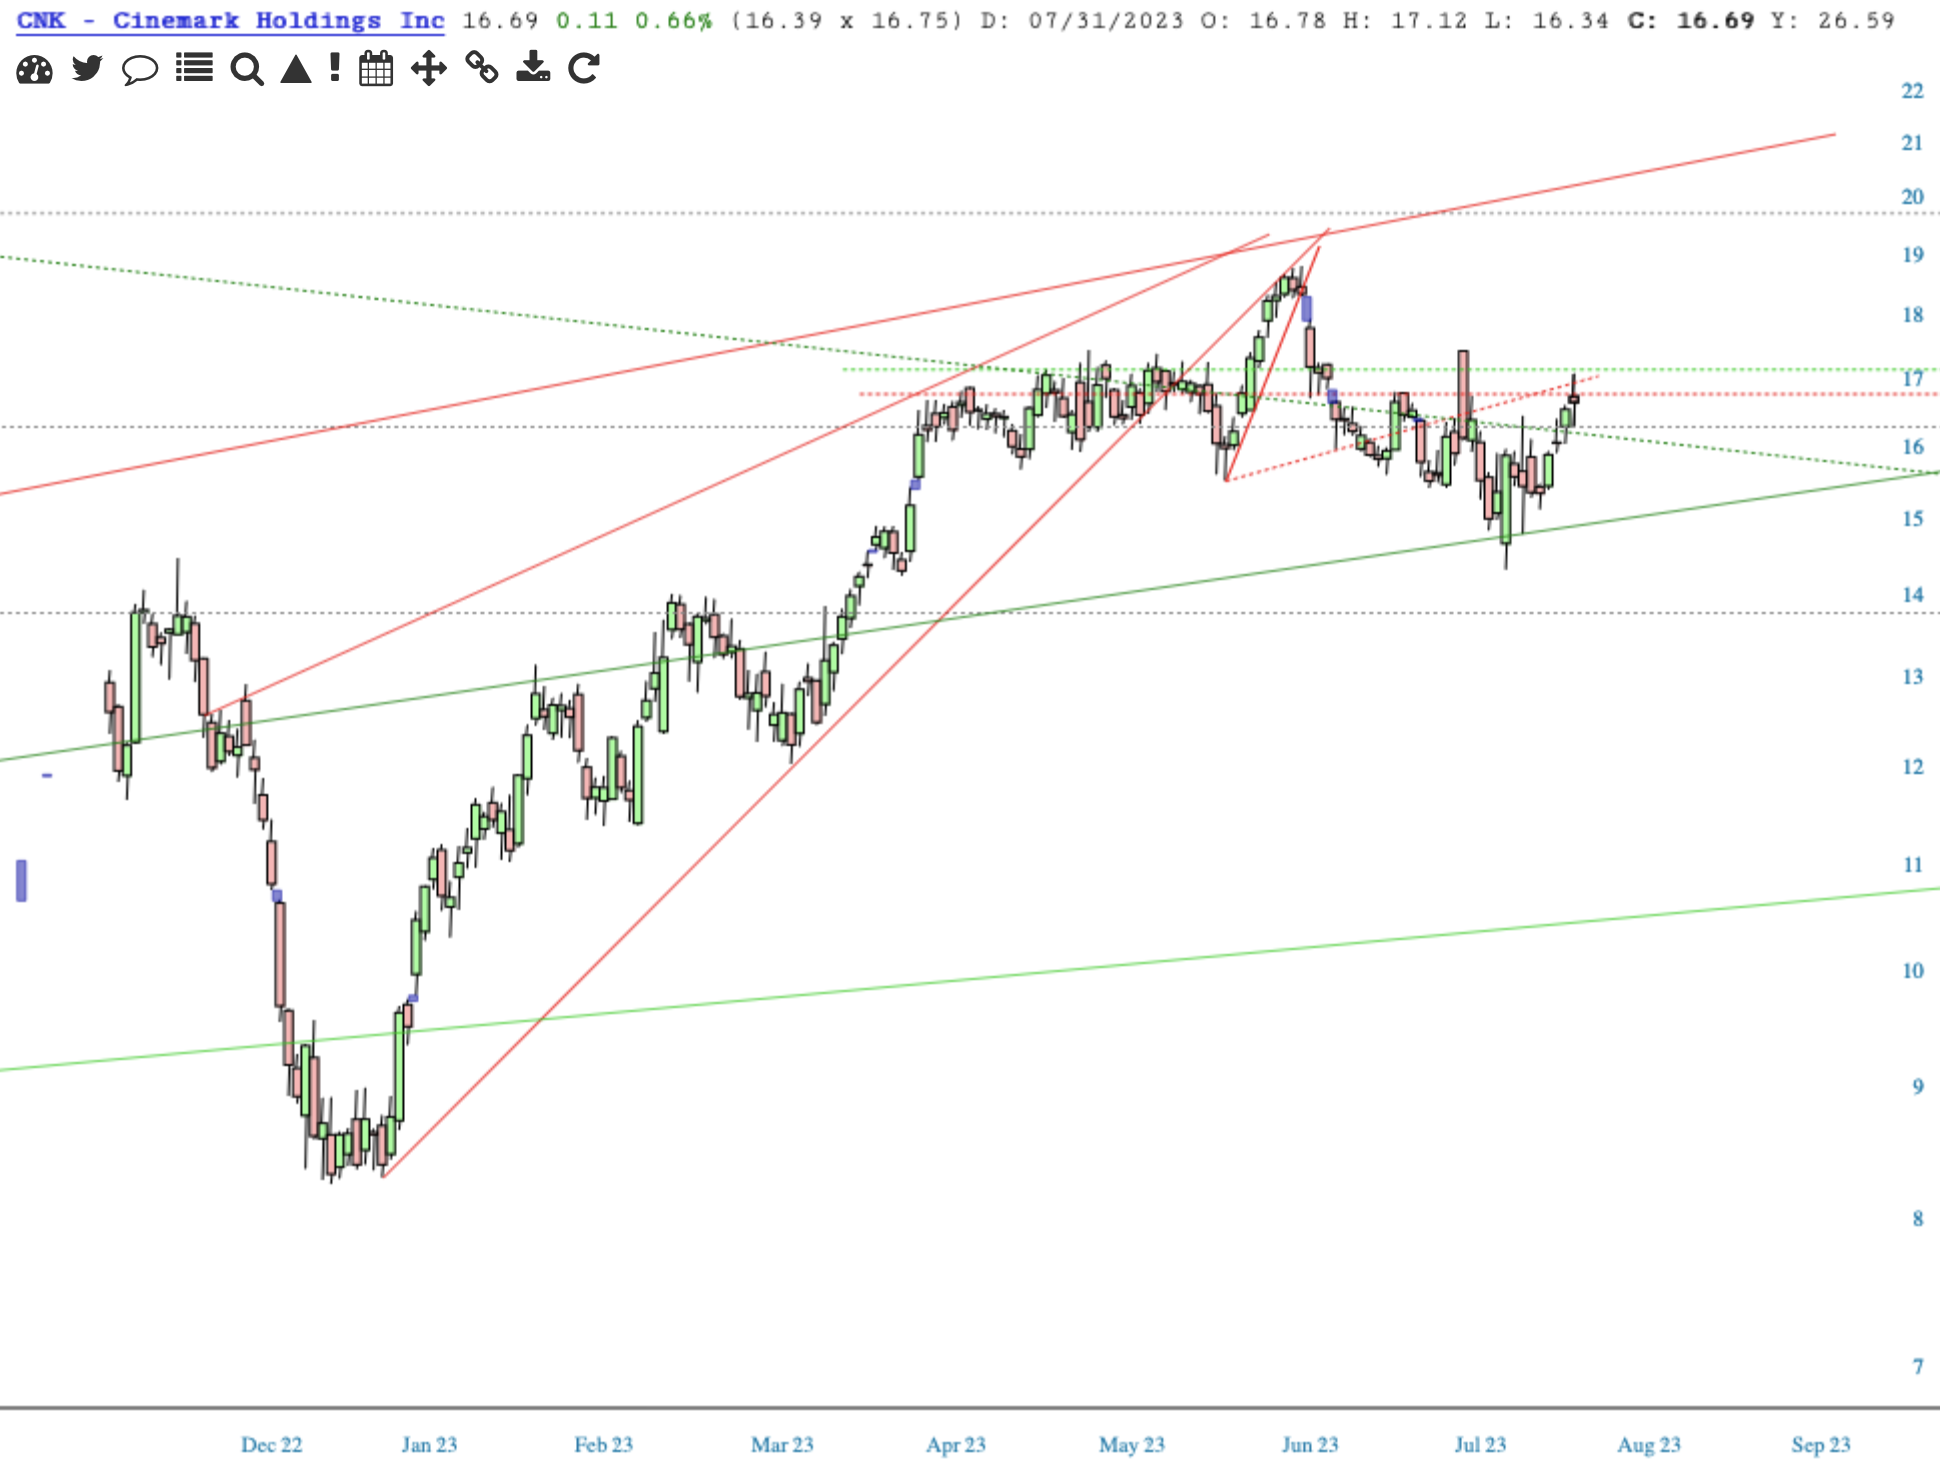
A spinning top closed the end of the month daily session. Price held directly under the Ichimoku Cloud, and is above two trend lines of support. That support is good, but not good enough for a bullish reversal unless the inside high of 17.47 is overcome. CNK earnings are 4Aug23.
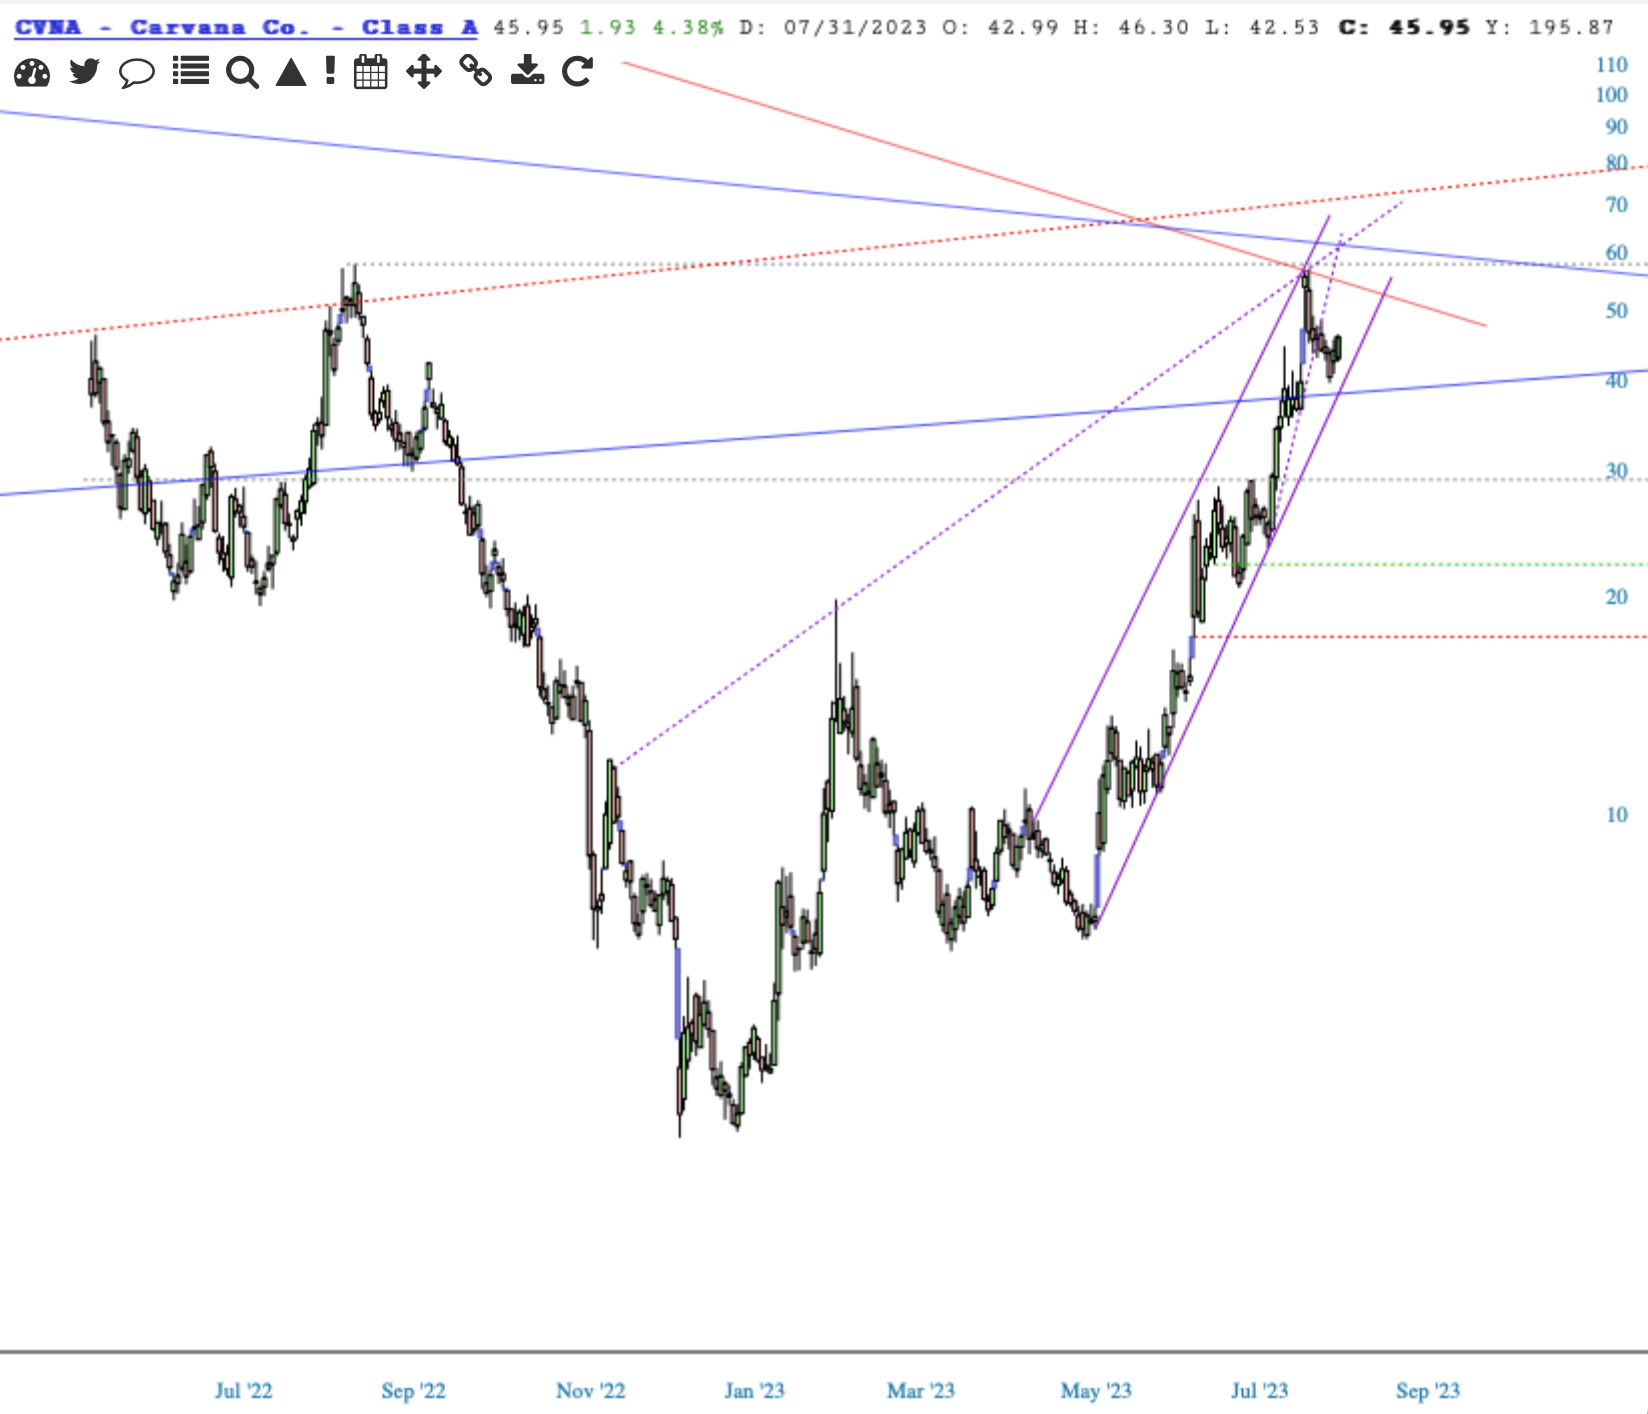
CVNA. Three months of strong upside, yet shamefully shy of reaching the inside high, if only by $0.86.
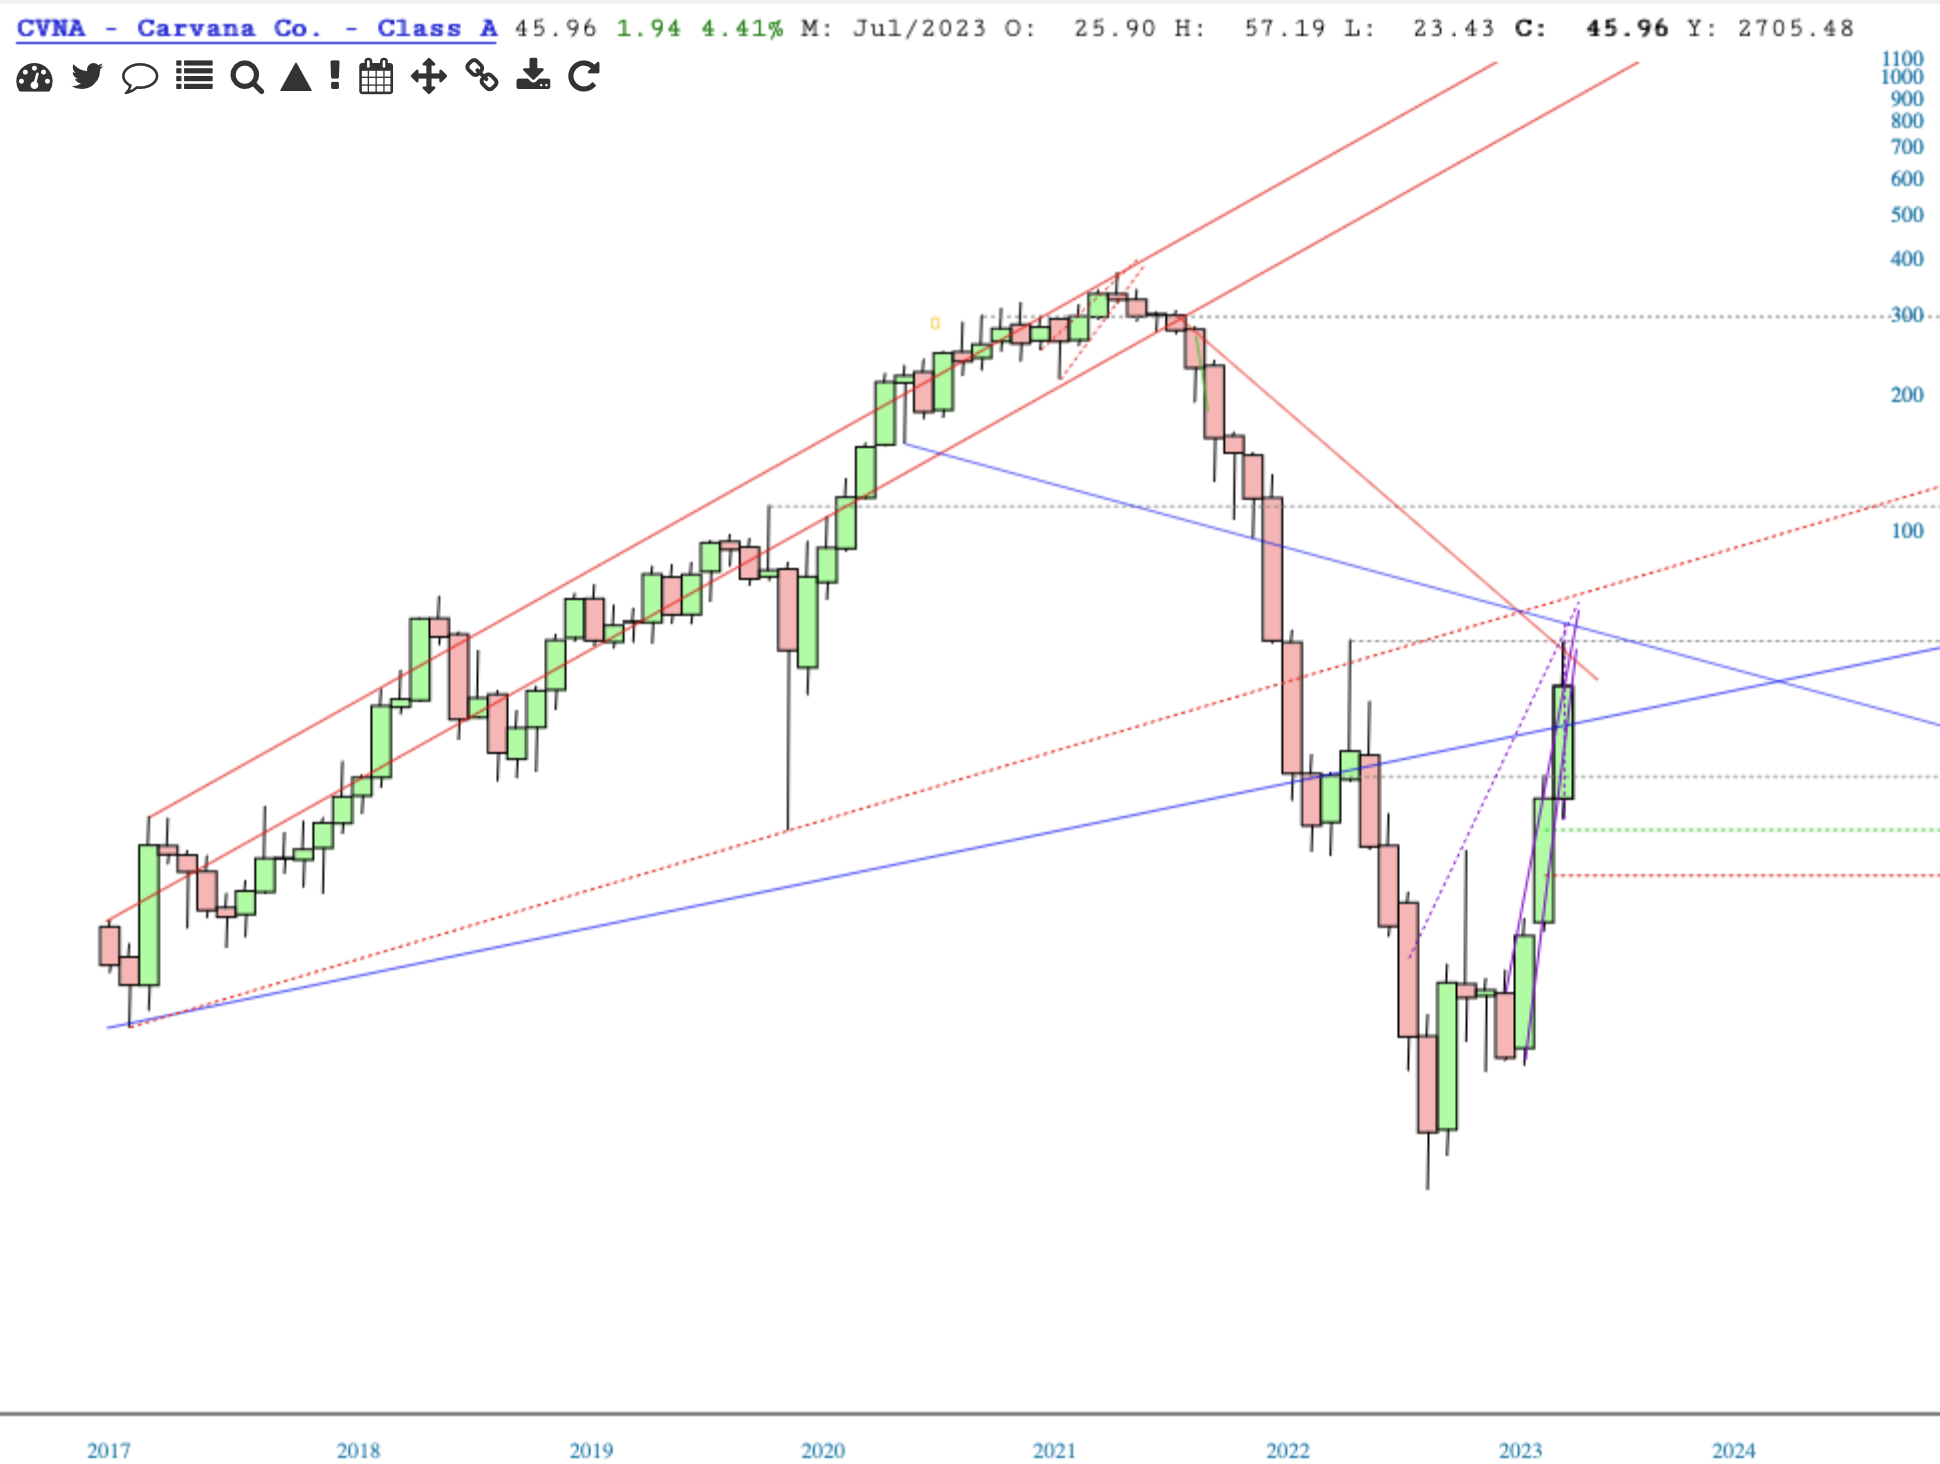
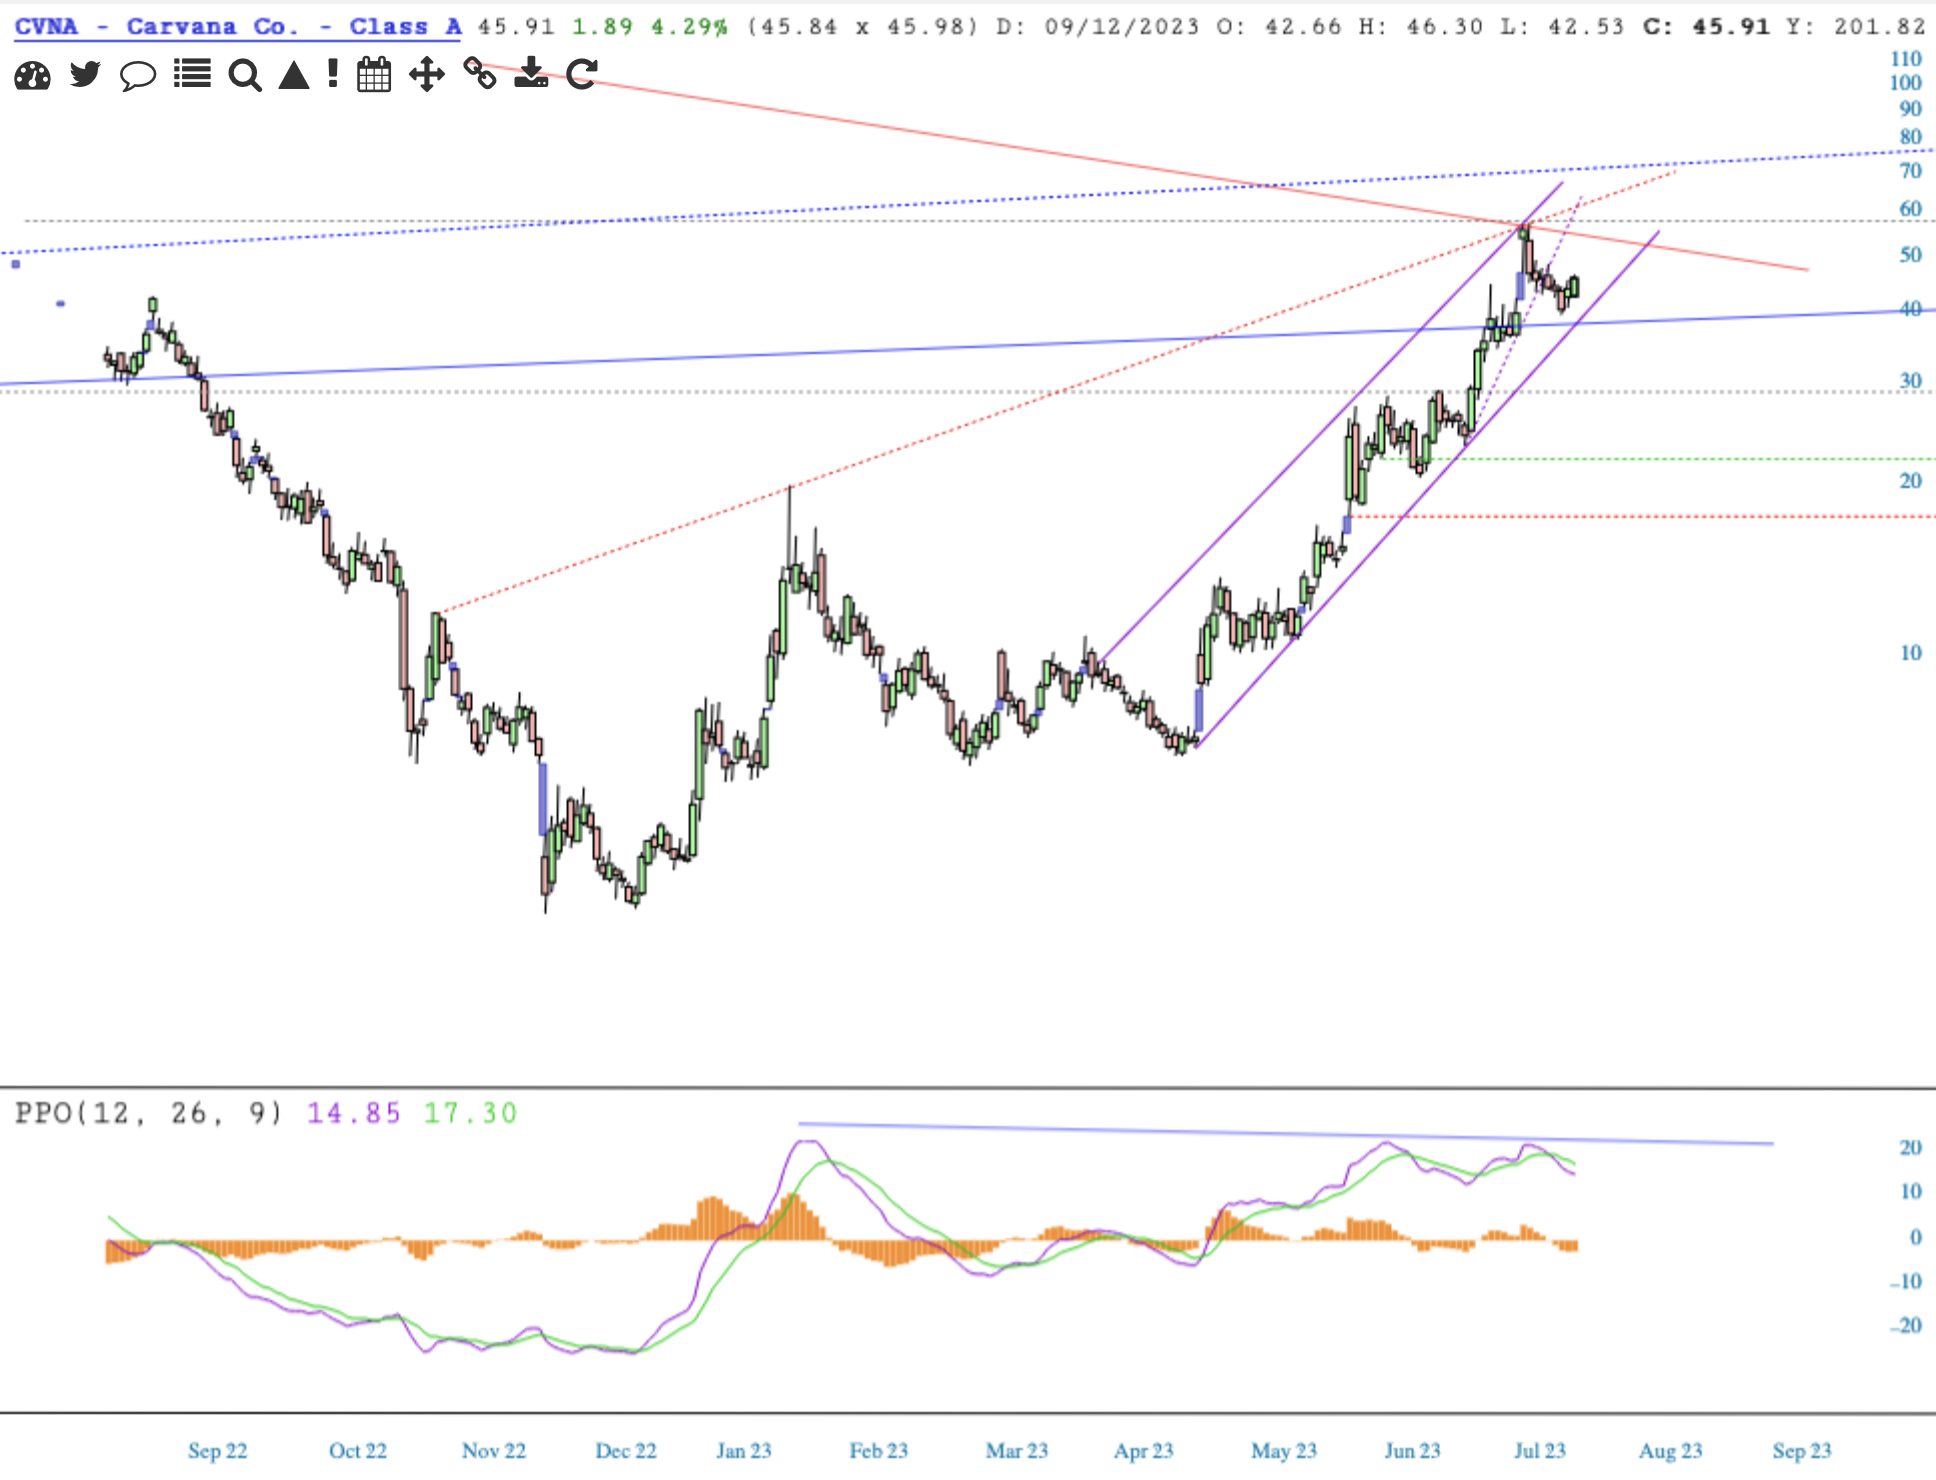
Delightful high-climbing bearish wedge and channel on the daily chart. Keeping above the blue is bullish, but note that getting above the upper blue downtrend line is necessary for a bullish takeover
Also note the indicator’s negative divergence, suggesting the rise in price is not sustainable.
Welcome to August, everyone!
