
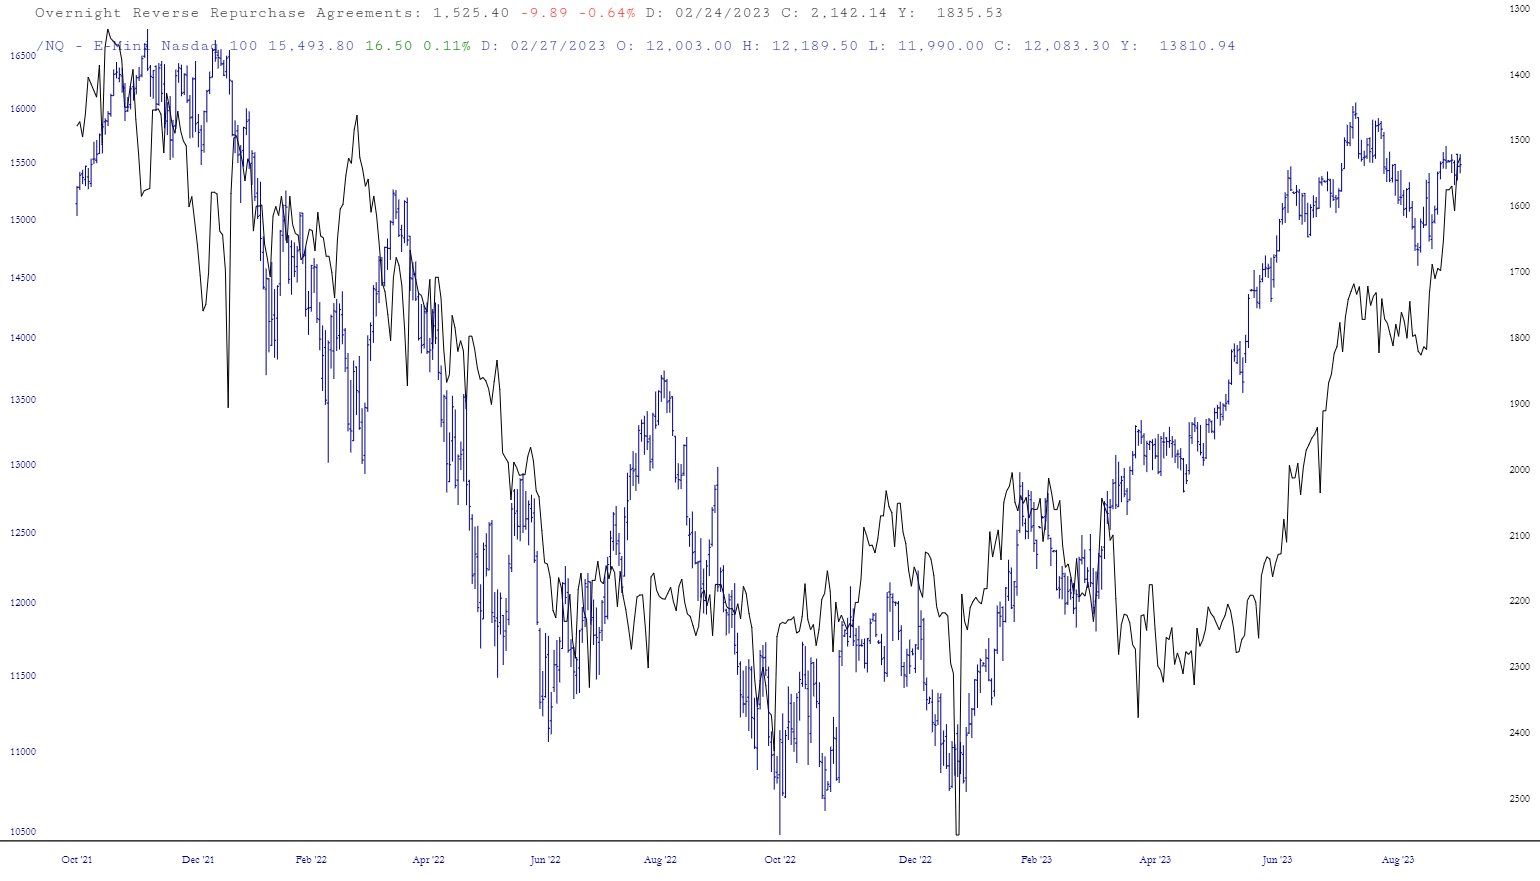
Below are the charts of reverse repo, inverted, with crude oil (CL) and the Nasdaq 100 futures (NQ).

What is reverse repo? Here’s a critical article from late 2022: The Fed’s Scheme To Crush Inflation Is Running on Borrowed Time
It describes the goal of the Fed’s overnight reverse repo operations:
Reverse repos are a way for the Fed to temporarily soak up excess liquidity in the market. But this is just a stopgap measure until the Fed can sell bonds in its open-market operations. Selling a bond is like the first part of a reverse repo without the second—the Fed gives a bond to a bank, and the bank pays for it in cash, but there is no repurchase 24 hours later.
Selling bonds would have been the prudent move for the Fed and put a stop to the river of free cash for Congress and the White House by pushing up interest rates on Treasuries to prohibitively expensive levels. Instead, the Fed kept the federal spree going, buying bonds while simultaneously escalating its reverse repos—as if the Fed’s right hand did not know what the left hand was doing.
This allowed the Fed to create unprecedented levels of cash for Congress to spend, while also keeping it out of the banking system. And unlike paying interest on reserves, which only captures deposits at banks, the reverse-repo market was expanded in April 2021 to include other financial institutions with large cash balances, such as reinsurance companies and money-market funds.
The Federal Reserve started QT mid-way through 2022, but it left reverse repo sitting there. A full round of QE sitting out there, dammed up. Waiting.
Pressure Rippling Through Funding Markets Drives Rates Higher
Cash parked at the Federal Reserve usually rises at month-end as banks pare their activity for regulatory purposes. Not so last month. Usage of the Fed’s reverse repo facility declined while the rate on overnight general collateral repo rose and transaction volumes underlying the Secured Overnight Financing Rate climbed.
“These dynamics likely represent a build-up in Street collateral financing needs and a small ripple of upward funding pressure,” Bank of America Strategists Mark Cabana and Katie Craig wrote in a note to clients Friday. “This funding ripple will gradually turn into smaller funding waves & eventual large waves that pressure SOFR higher.”
…Still, Cabana and Craig expected SOFR to remain anchored to the offering rate on the RRP until the facility’s balances fall toward zero in late 2024, at which point funding pressures will be “more clearly evidenced.” SOFR fixed at 5.31% as of Sept. 7, according to New York Fed data published Friday, which is just above the 5.30% yield at the RRP.
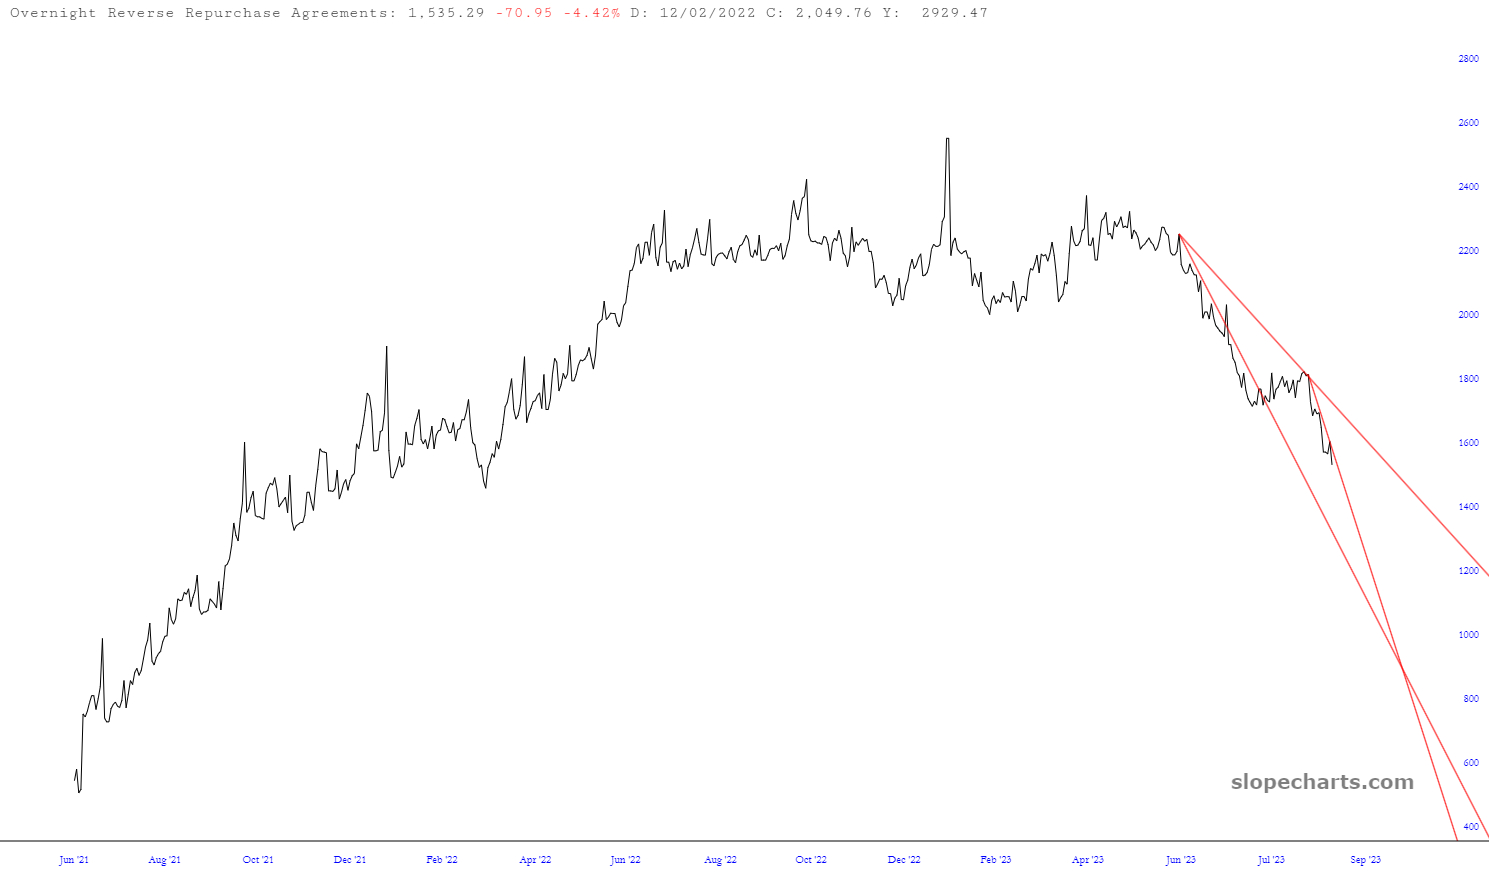
Here is a chart of reverse repo with trendlines. The steeper lines terminate in January and March of 2024. The shallower one that allows for reversals along the way, bottoms in August 2024. Maybe this all ends a lot sooner than expected.
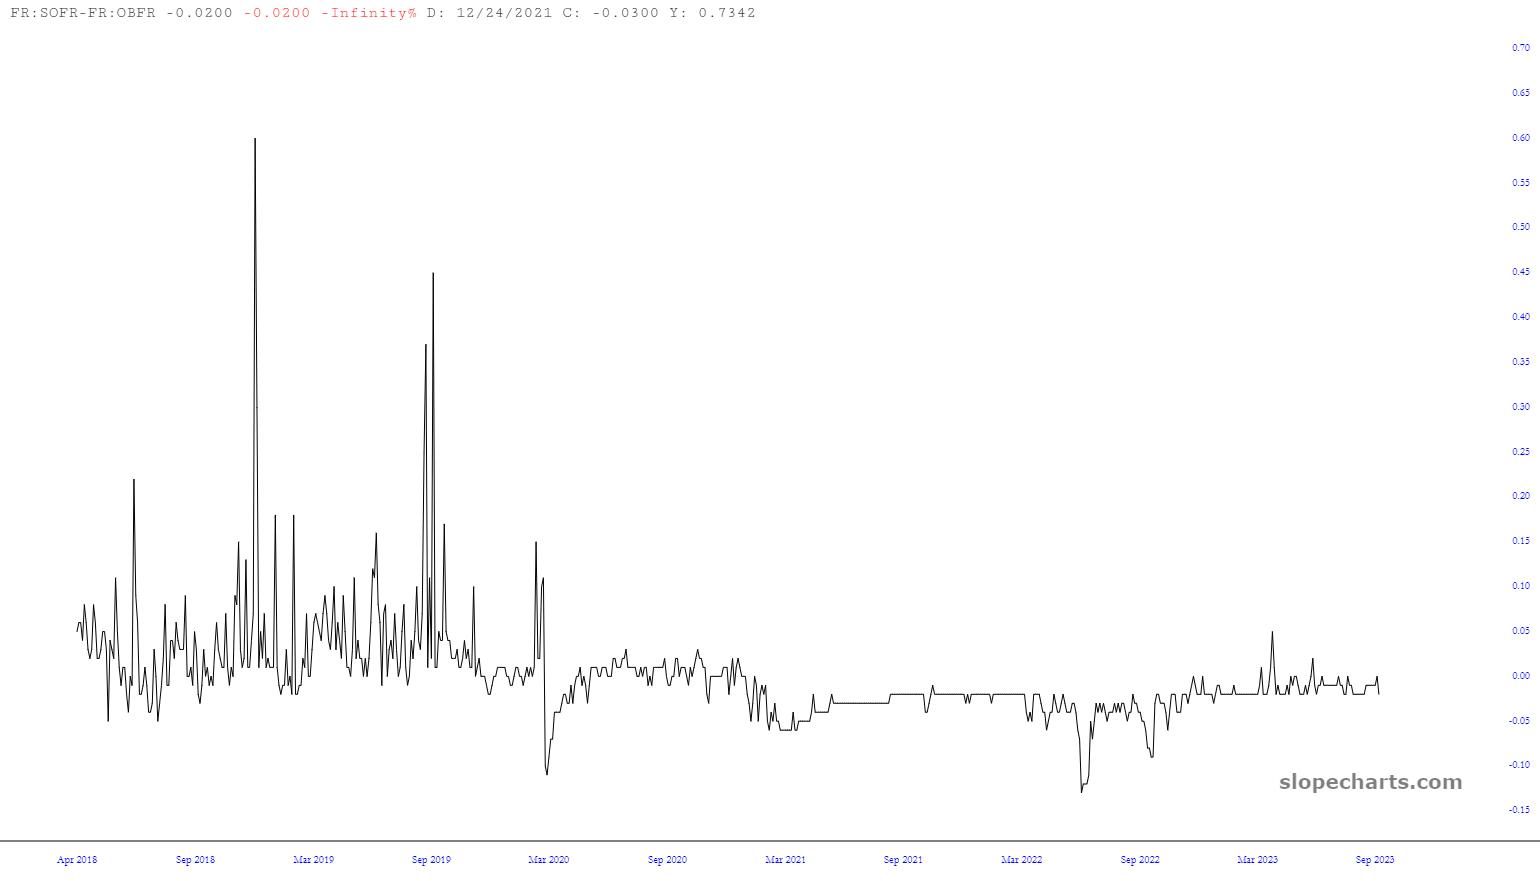
Here is the spread between SOFR and the overnight bank funding rate, what might be a signal for when this all blows up.
Long story short, reverse repo soaked up liquidity. The overnight reverse repo balance is reversing now, probably for bad reasons. Yet it is still liquidity. Both NQ and CL are moving in tandem with the drain in reverse repo. Energy is also leading in momentum now. There doesn’t need to be a reason for momentum, it simply is its own animal.
How else to explain NQ and CL both rallying, when higher inflation is sinking bonds and is bad news for tech stocks? Momentum, sentiment and way too much liquidity can explain it. We know who is responsible for much of it: the devils Bernanke and Yellen, and Pussyfoot Powell who is too afraid to do what is necessary.
Exit question: if the Joker ran monetary policy, how would it differ?

EDITOR'S NOTE: Nobody uses Layered Charts more creatively than LZ!
