
Just in time for earnings season, I wanted to let you know about an important improvement in the Reactions Graph page, which is an exclusive feature for Slope’s awesome Platinum subscribers.
What the reaction page does is, making use of our extremely high quality (and very expensive) data from Wall Street Horizon, we gather up all the reactions to earnings events that have ever taken place for any particular stock. What we’ve added is a new button called Stats.
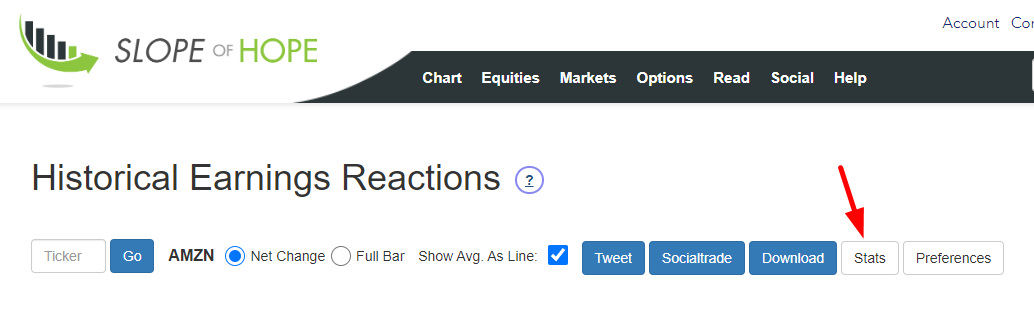
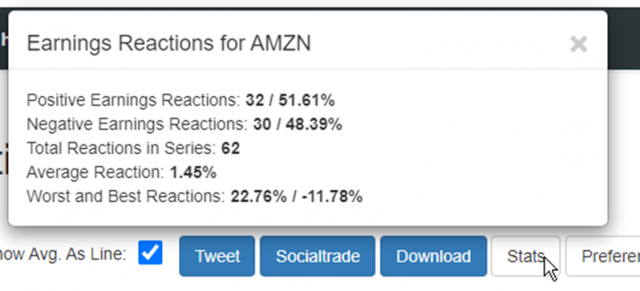
When you click it, a new window appears for whatever symbol you are already observing (the default being AMZN). It provides a wealth of useful information:
- How many instances of positive reactions there were, and what percentage of the entire set that represents;
- How many instances of negative reactions there were, and what percentage of the entire set that represents;
- The grand total of reactions for which we have historical data (typically this is how many quarters exist for a given stock);
- The average reaction to earnings, whether positive or negative;
- The most extreme positive and reactions for the entire data set.
Here is another example, which time using Tesla:
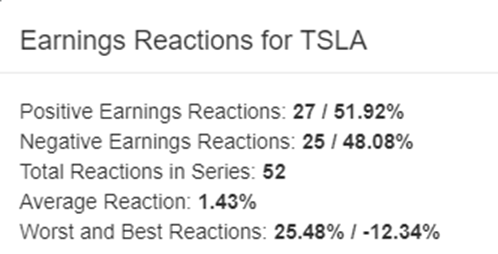
This is an entirely new way to examine the whole of a stock’s relationship with its earnings events to give you a better sense as to the personality of a given instrument on its important quarterly earnings day.
