
There’s no denying lots of action for both sides to make money this past week.
I decided to perform my entire analysis this week inverted. I always do this when things seem a bit stretched to try to rein in any bearish bias. The key areas I am watching are related to the breakout level of 4200, which was major resistance throughout 2022 into 2023, followed by breakdown level of 4360, which was prior support in late August. As for fundamental arguments on direction, I think sectors to watch will be how tech and banks start to react in the next week. While Friday left traders (i.e., me) shaken, I feel like this weekend I have had time to reassess and the bearish thesis still has legs. I will explain in further detail below.
Tech continues to be the most bullish sector over the past year. This is certainly a case of the investing public drinking the same kool-aid as they are expecting this sector (really the big 7 tech stocks) to lead us into the future. But while the prospects always look bright in these sectors, people always tend to forget about the small things which keeps the economy running smoothly. They get ahead of themselves in dreaming of the future and realize the ground is crumbling beneath their feet. I’m thinking of 2001 with the internet when the dreams of future possibilities, while not unfounded, were simply not timely. The bear market which began after the tech bubble popped devastated the Nasdaq.
If we continue to pile into these seven stocks while the rest of the economy crumbles, then this too shall end in a similar fashion. These stocks with PE ratios of over 100 can’t sustain at these levels. That being said, the charts are still just incredibly bullish. The nonstop train just keeps on chugging along. So I can’t stand in front of this train and short until I see everything else start to really peel away support (thinking like the game “Jenga”).
Banking is readying for a fall in the coming weeks/months. The increased interest rates are going to hit this sector hard (not that it hasn’t already). We are in a place with the financial sector where it had its newsworthy “crash” earlier this year (with the regional banks getting smacked hard). However, after the subsequent bounce and rally back from the bottom fishers, there has been a slow but consistent drift back down.
I can’t say I know all the drivers of this action, but I’m sure the steadfastness of Powell’s message that is basically “We will raise rates until you are broken” has something to do with it. In addition, student loan repayments have just started back up again as the moratorium of federal student loads are finally over. This is going to have a huge impact on the economy in the coming months (either that or credit companies are going to be overloaded as people start charging for needs they can no longer pay for). None of this has really made news lately, has it? In fact, it’s been downright quiet. Quite times are the best times to get into position before anything hits the newswires.
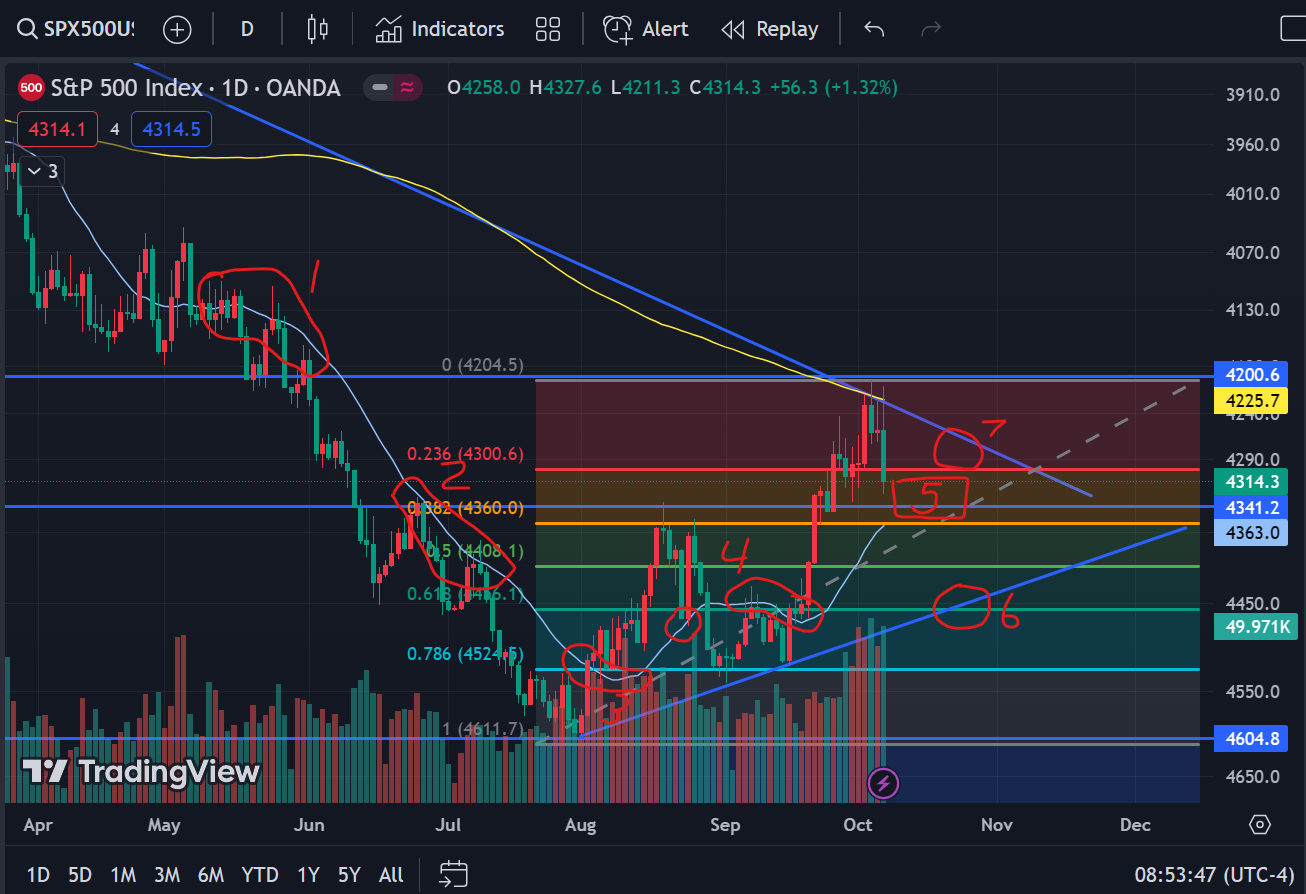
SPX, inverted Daily. While the 200 Day Moving Average were the magic words of this past week, I am also watching the 20 Day Moving Average (light blue line) and Fibonacci levels (top drawn at September highs, bottom at October lows last week). I circled 4 areas of importance with regards to this Moving Average. The first area (indicated “1”) was back between May and June this past year, when this initial breakout of the year started to occur. The second area circled is the retests and continuation of this breakout in late June to July.
The third area is the reversal with retest from underneath in early August and subsequent retest in late August. Then the fourth area shows something interesting. There was a wrestling back of control by the bulls to cross over this average again, but a failure to hold and then another bearish cross mid-September. These four areas are interesting because it indicates this Moving Average seems to mean something right now. And we are currently heading back to it by early next week. I think a lot will depend on the action we see in the fifth area. I think a small battle will occur here in this area over the next 3 days. If we outright reject and reverse here, then we are obviously aiming for area 7 and will likely break down (what I’m sure a lot of traders were betting on last week before Friday’s rally).
But betting on outright rejection is a tough gamble after Friday’s candlestick. I’d look for the attempted continuation Monday early, followed by a lot of volatility to eventually test that 20 Day MA. If we see a failure to reject that MA by Tuesday or Wednesday (and so the beginning of a bullish cross), then I’d watch for a rally to take us to area six, around 4450 on SPX. This would line up with the descending trendline from this most recent high as well as the last real support before the late September drop. If we DO reject, on the other hand, then we’d have to contend first with 4300 support (Fibonacci Retracement level and big round number), but I think we could target 4260 again (ascending trendline and 200 Day MA).
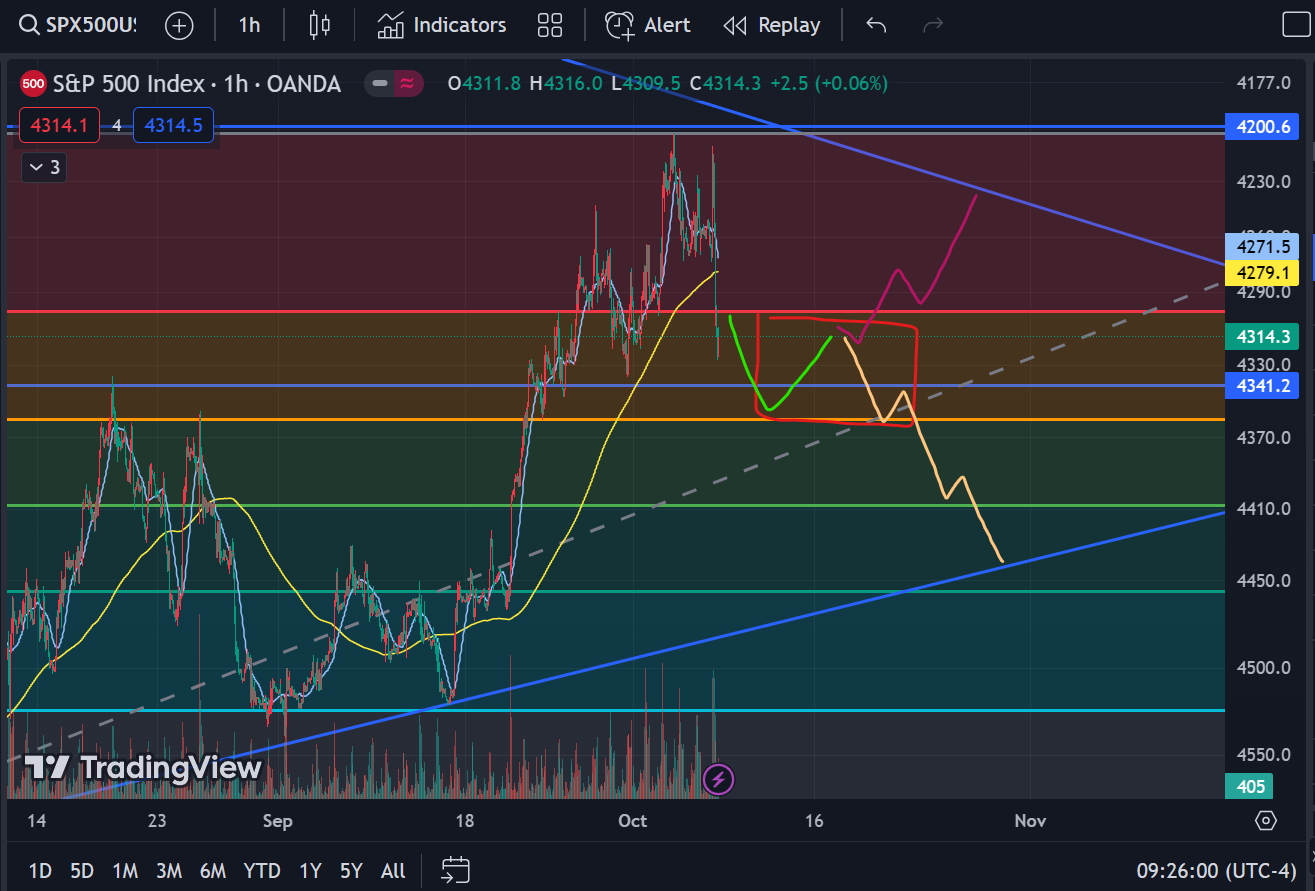
SPX, inverted Hourly, Area Five. I’m expecting a path following the green line, which is a push Monday to continue this rally up to 4360. That Fibonacci Retracement coincides with the 20 Day MA I mentioned earlier, so I would be looking for this short rally to get tired around there. Note that while the green line is nice and straight, I would expect lots of chop and not straight-line trading at all while this fights between support and resistance levels.
A break beneath 4300 (Purple line) should start to give momentum back to the downside and hopefully a retest of that trendline/daily MA again. Another retest of those technical levels after such a rejection, however, should yield the break traders have been looking for, but I don’t want to waste time speculating on that prospect yet. On the other hand, if we do start to drift back up to start breaking 4360 (peach line), then there is a real possibility of a short squeeze back up to mid-September levels around 4460 (next Fibonacci level, descending trendline from recent September highs). I am expecting the first scenario, however, due to bearish activity in the financial sector. Either way, October will likely determine the direction into the end of the year, and October will likely be decided by what we see in this area (at least in my mind).
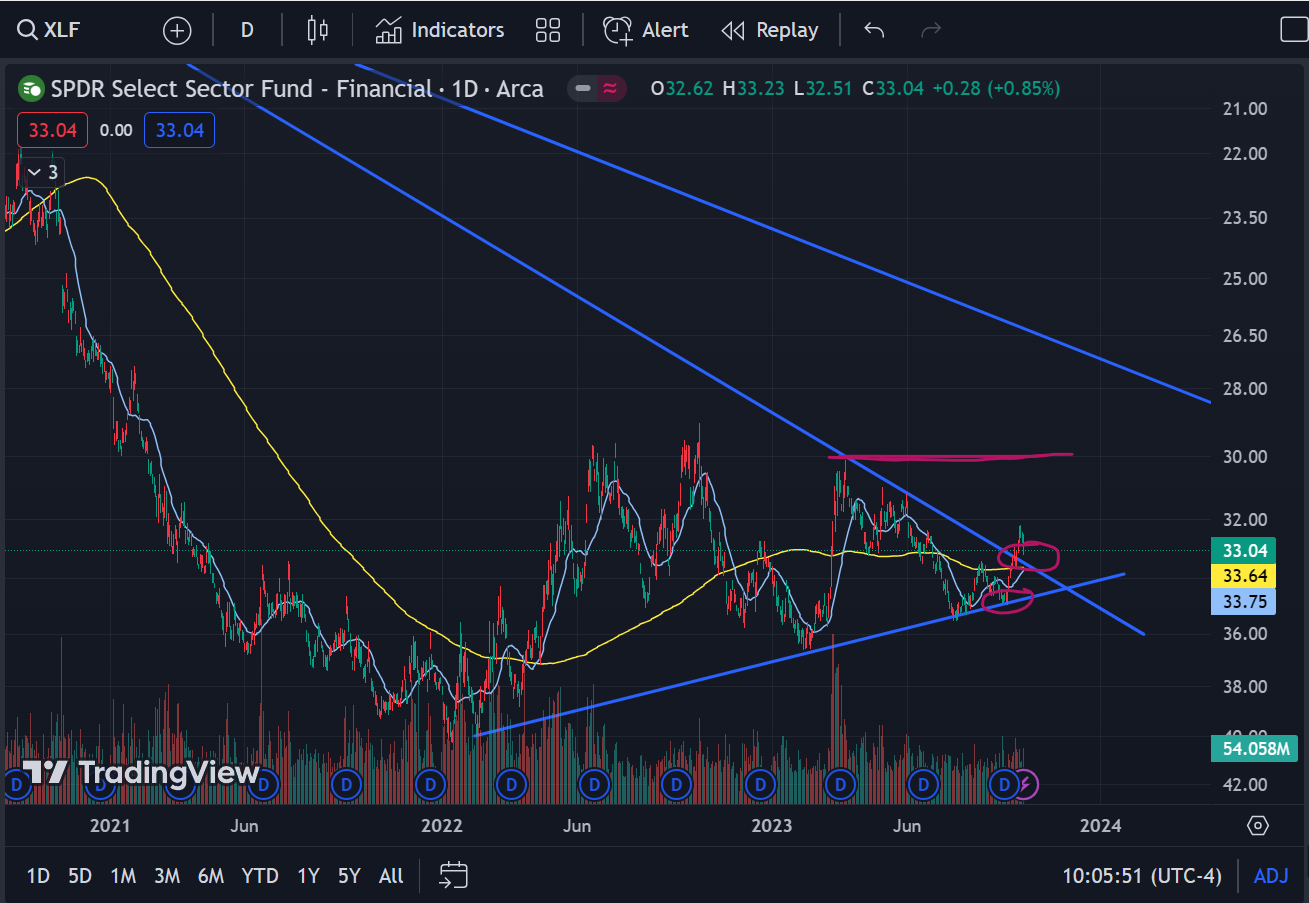
XLF, Daily. This is a sector which is extremely important for most Bull Markets to be sustainable. Banking keeps the market running (they literally hold all the money). For this sector to be showing a bearish break beneath this trendline spells very bad news overall. As mentioned in the SPX, I am expecting a bullish continuation attempt early this week, but this sector would end up getting jammed up directly into the underside of this trendline break. That should spell the end for this rally and, thus, the market rally overall as I think this sector could be headed at minimum to $30 (which is about a 10% drop from here). I admit, I wish I started watching this at the descending trendline test in late September, but I missed it. Better late than never.’
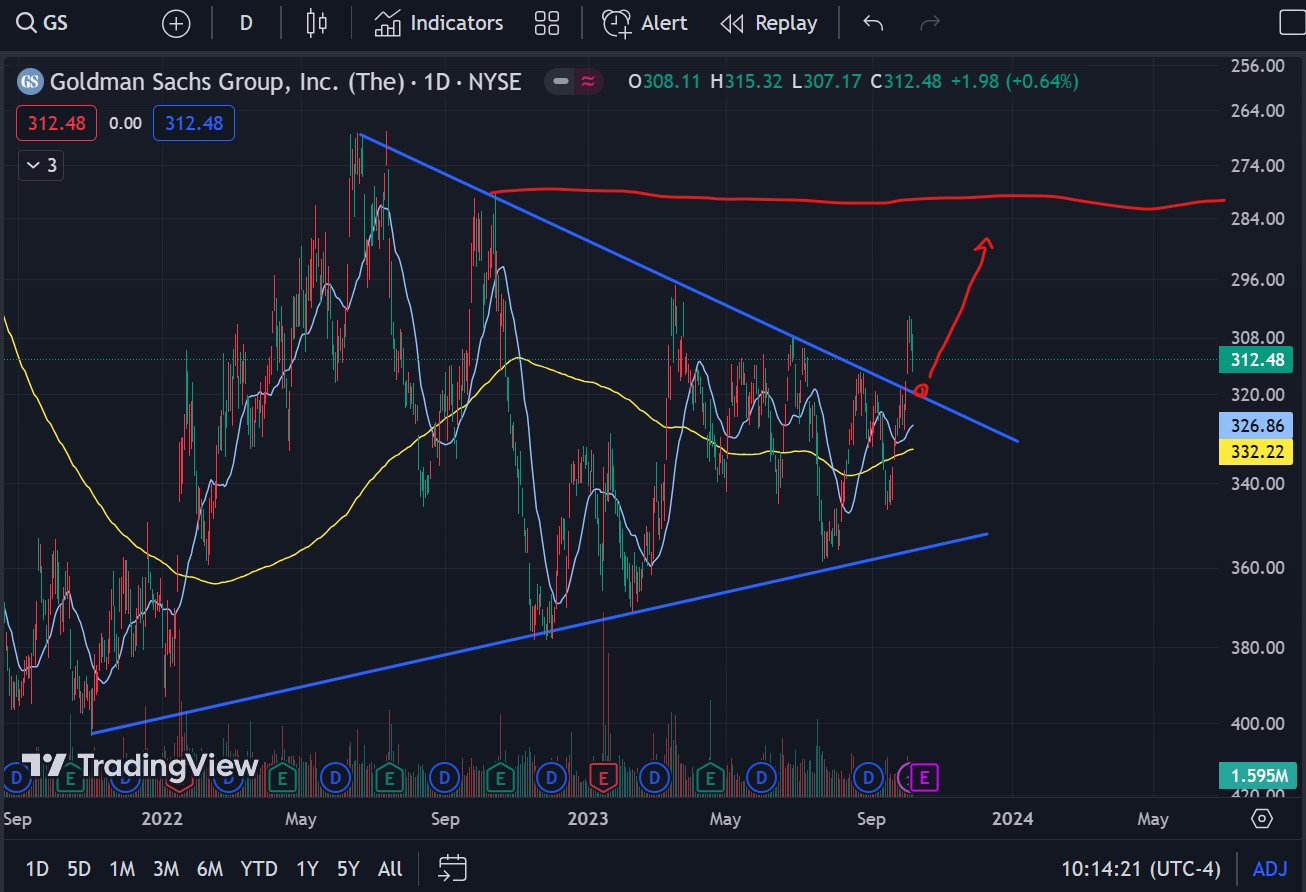
GS Daily. This broke a major support trendline last week and we are now heading right back up underneath to test that trendline. I am going to be watching that retest intently because the first sign of reversal would be prime shorting time. Following the sector bearishness, I’m looking for a big drop here as well. A 10% drop from here would take us back to October 2022 levels around 275.
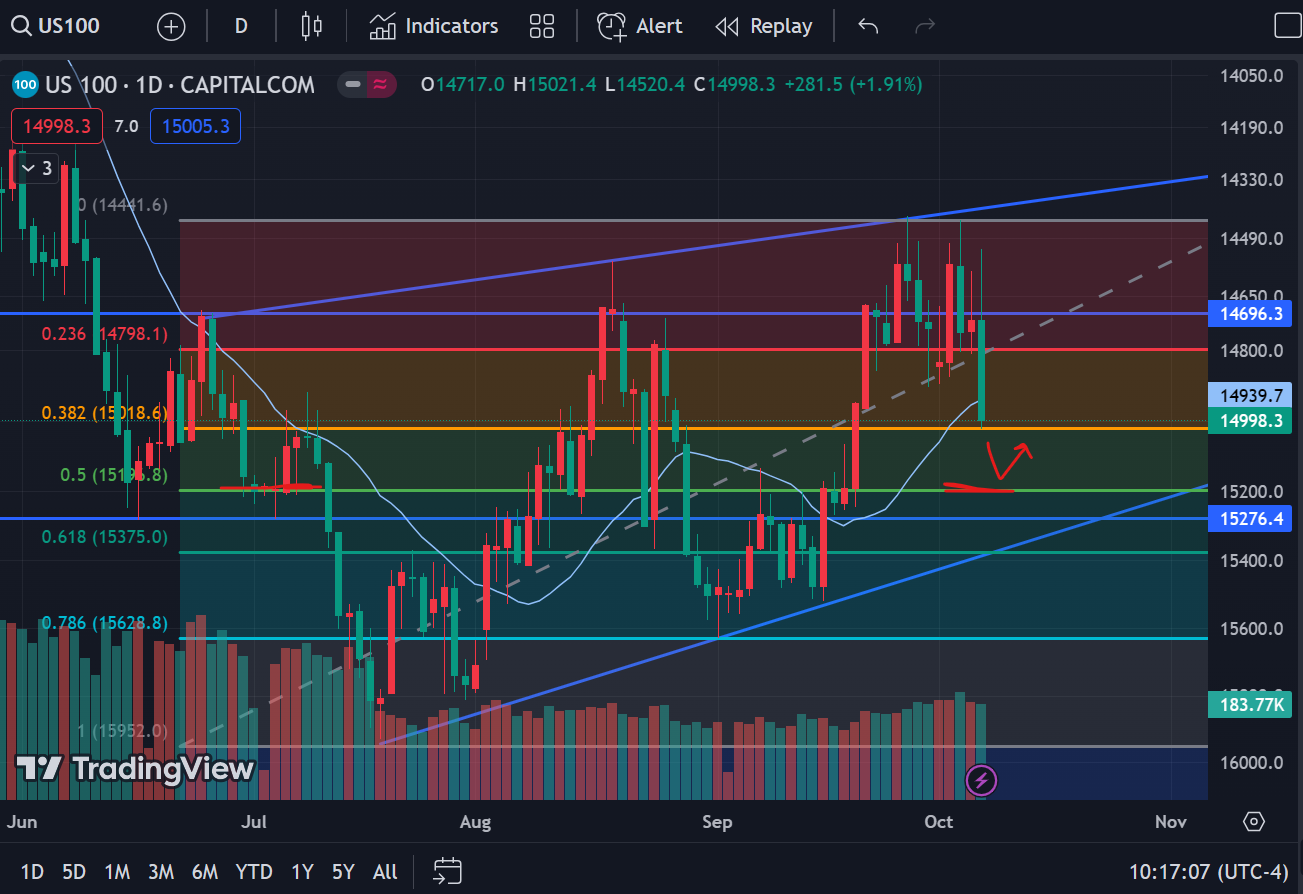
Nasdaq, Daily. As stated above, this sector continues to have money plowed into it. I’ll watch for the continued rush into the “safety” of tech up to 15,200-15,300, which was prior resistance/breakout in July. I’m looking for this to be the last and strongest thrust back up this week before finally weakening as the rest of the market starts to peel back. As I mentioned before, I’m not stepping in front of this train. I’ve been burned too much by TSLA and NVDA this past year. I will, however, be using it as a market indicator on which way the wind is blowing.
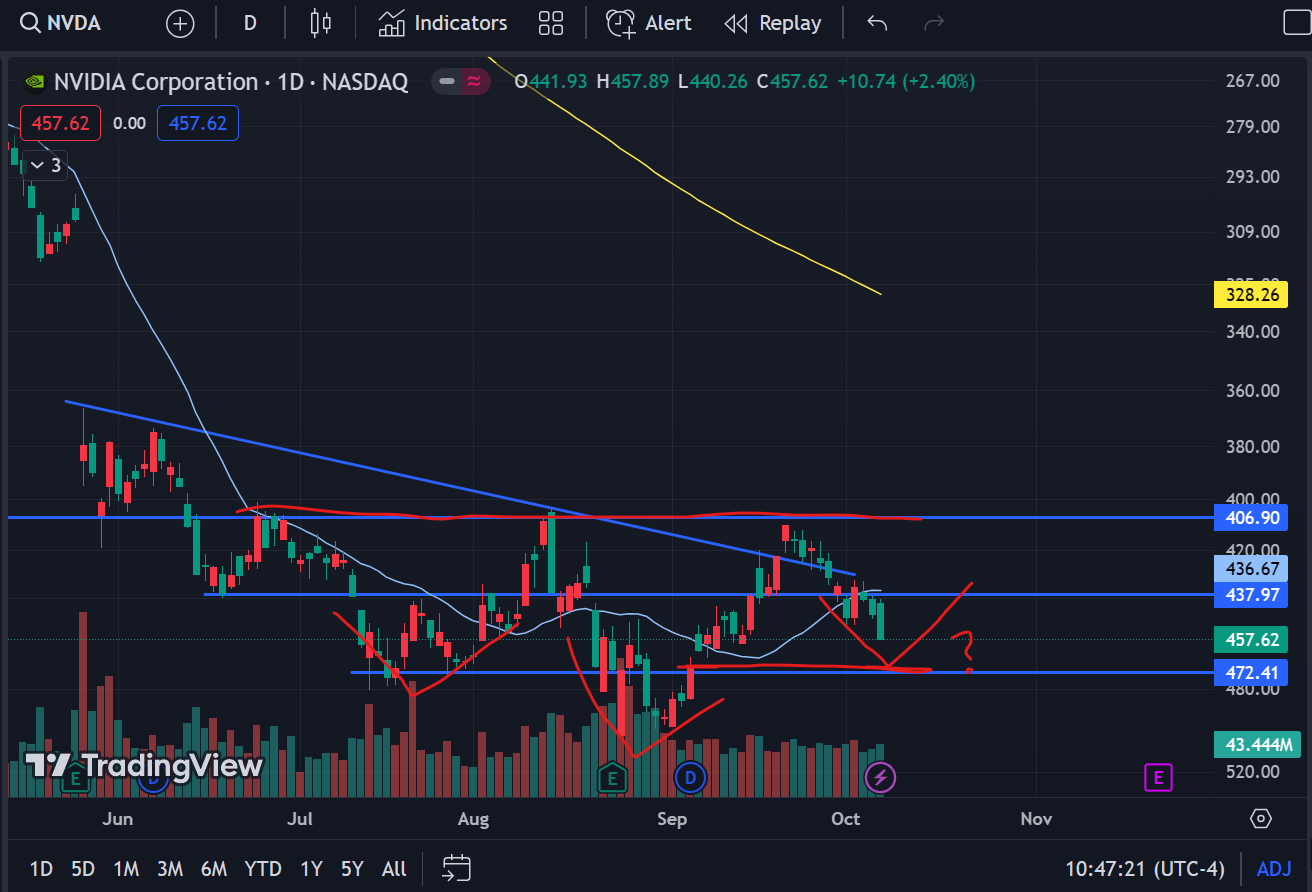
NVDA, Daily. Again, just pointing out how strong this tech sector seems to be, with NVDA really leading the way. This is headed straight for the gap at 470 by Monday in all likelihood. However, if my reasoning above is sound, then we should see this start to weaken up there. What would be really interesting is that this could set up for a potential H&S pattern. Of course, it is way too early to start betting big on that, but in the short-term, 470 looks like a trader’s best bet at a resistance zone to hold.
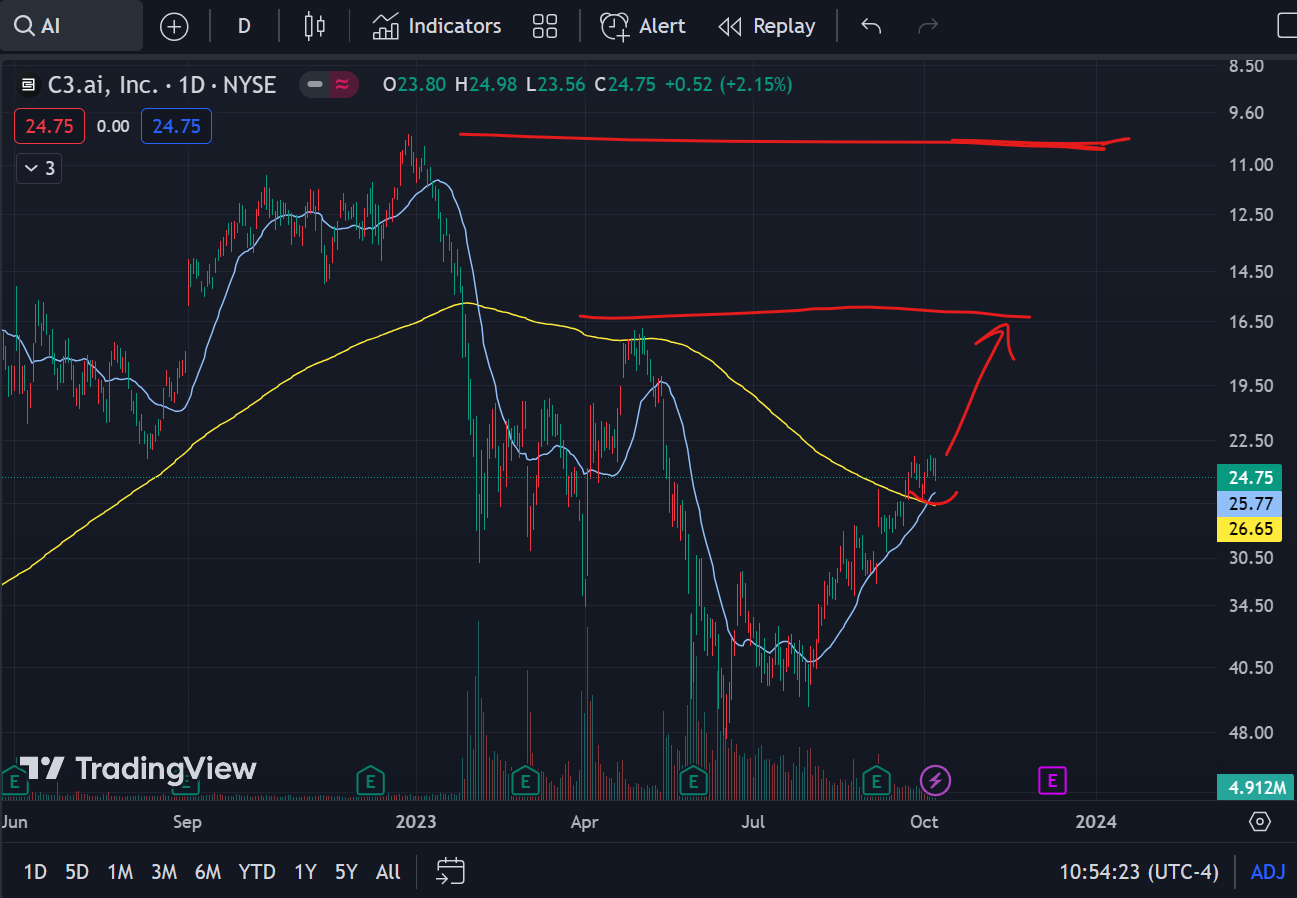
AI, Daily. Now this is the type of bubble popping tech stock to short. It is still overinflated and has huge downside potential, easily trading beneath moving averages, cutting beneath the 200 Day MA, and holding beneath the 20 Day MA. I’ll be watching for a teeny pop up to $25, but I’m watching for a retest at minimum of $16 (possibly further if this bubble is truly popping).
In summary, Friday rattled a lot of traders, I’m sure. My own immediate reaction was reminiscent of my reaction to October 2022 when the bears seemed to have a crash imminent, only to rally several hundred points back up. Yet, a zoom out and we can see much larger levels at play.
As such, I’m feeling again comfortable maintaining my bearish sentiment and will be looking for shorting opportunities. The market is trying to set itself up for the bounce after retesting the July breakout level and 200 Day MA, but the underlying fundamentals just don’t hold up for me that this would be sustainable. I think instead this is going to simply provide great spots to get short, specifically in financials and GS. I’ll be watching tech as a bellwether for the short-term market bias. If tech is rallying, I’ll use this as an opportunity to get short other sectors as they get dragged up into great technical resistance levels).
Addendum. I wrote most of this before the news this weekend of the Hamas/Israel situation (Israel just formally declared war on Hamas after the attacks this weekend, speculation now of Iran involvement, etc.). I’m not going to get political, but it is a noteworthy event which could rile markets. I’ve seen war news either tank or rally markets, so we’ll see what kind of market we are facing Monday. Regardless, the levels are the levels. Best of luck to all this week.
