
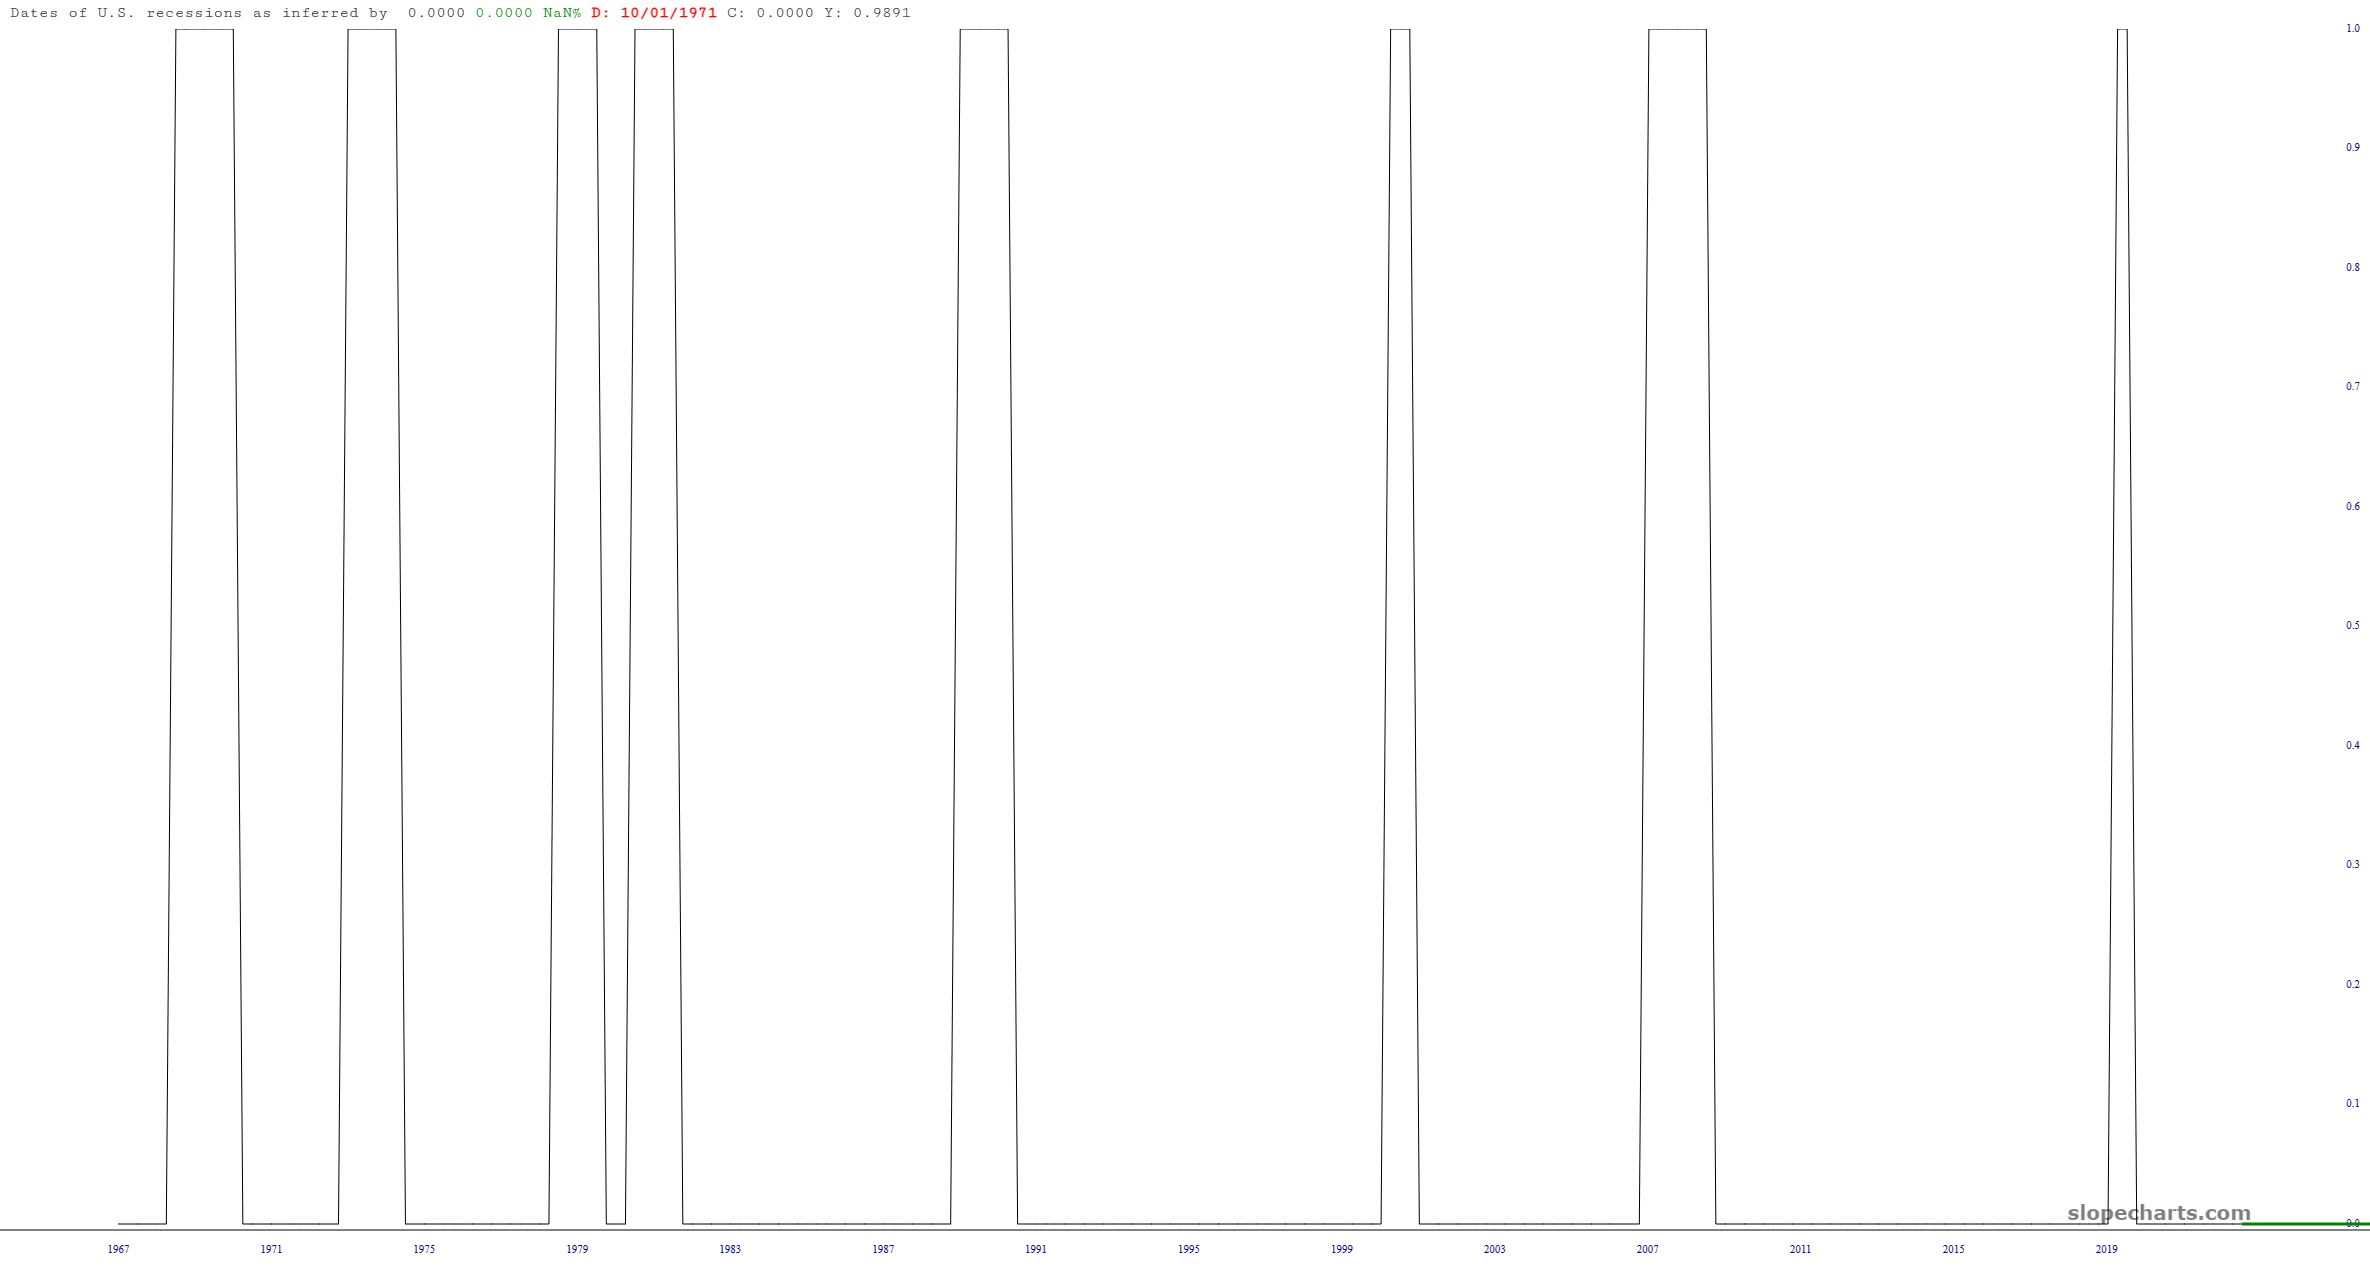
Let’s look at some charts together, shall we? The first I want to show you is from our economic database, and it shows when recessions have taken place. The graph is very simple, because it’s a binary representation. We are either not having a recession (y value=0) or we are (y value=1). So when the line zips to the top of the chart, it’s recession-time.
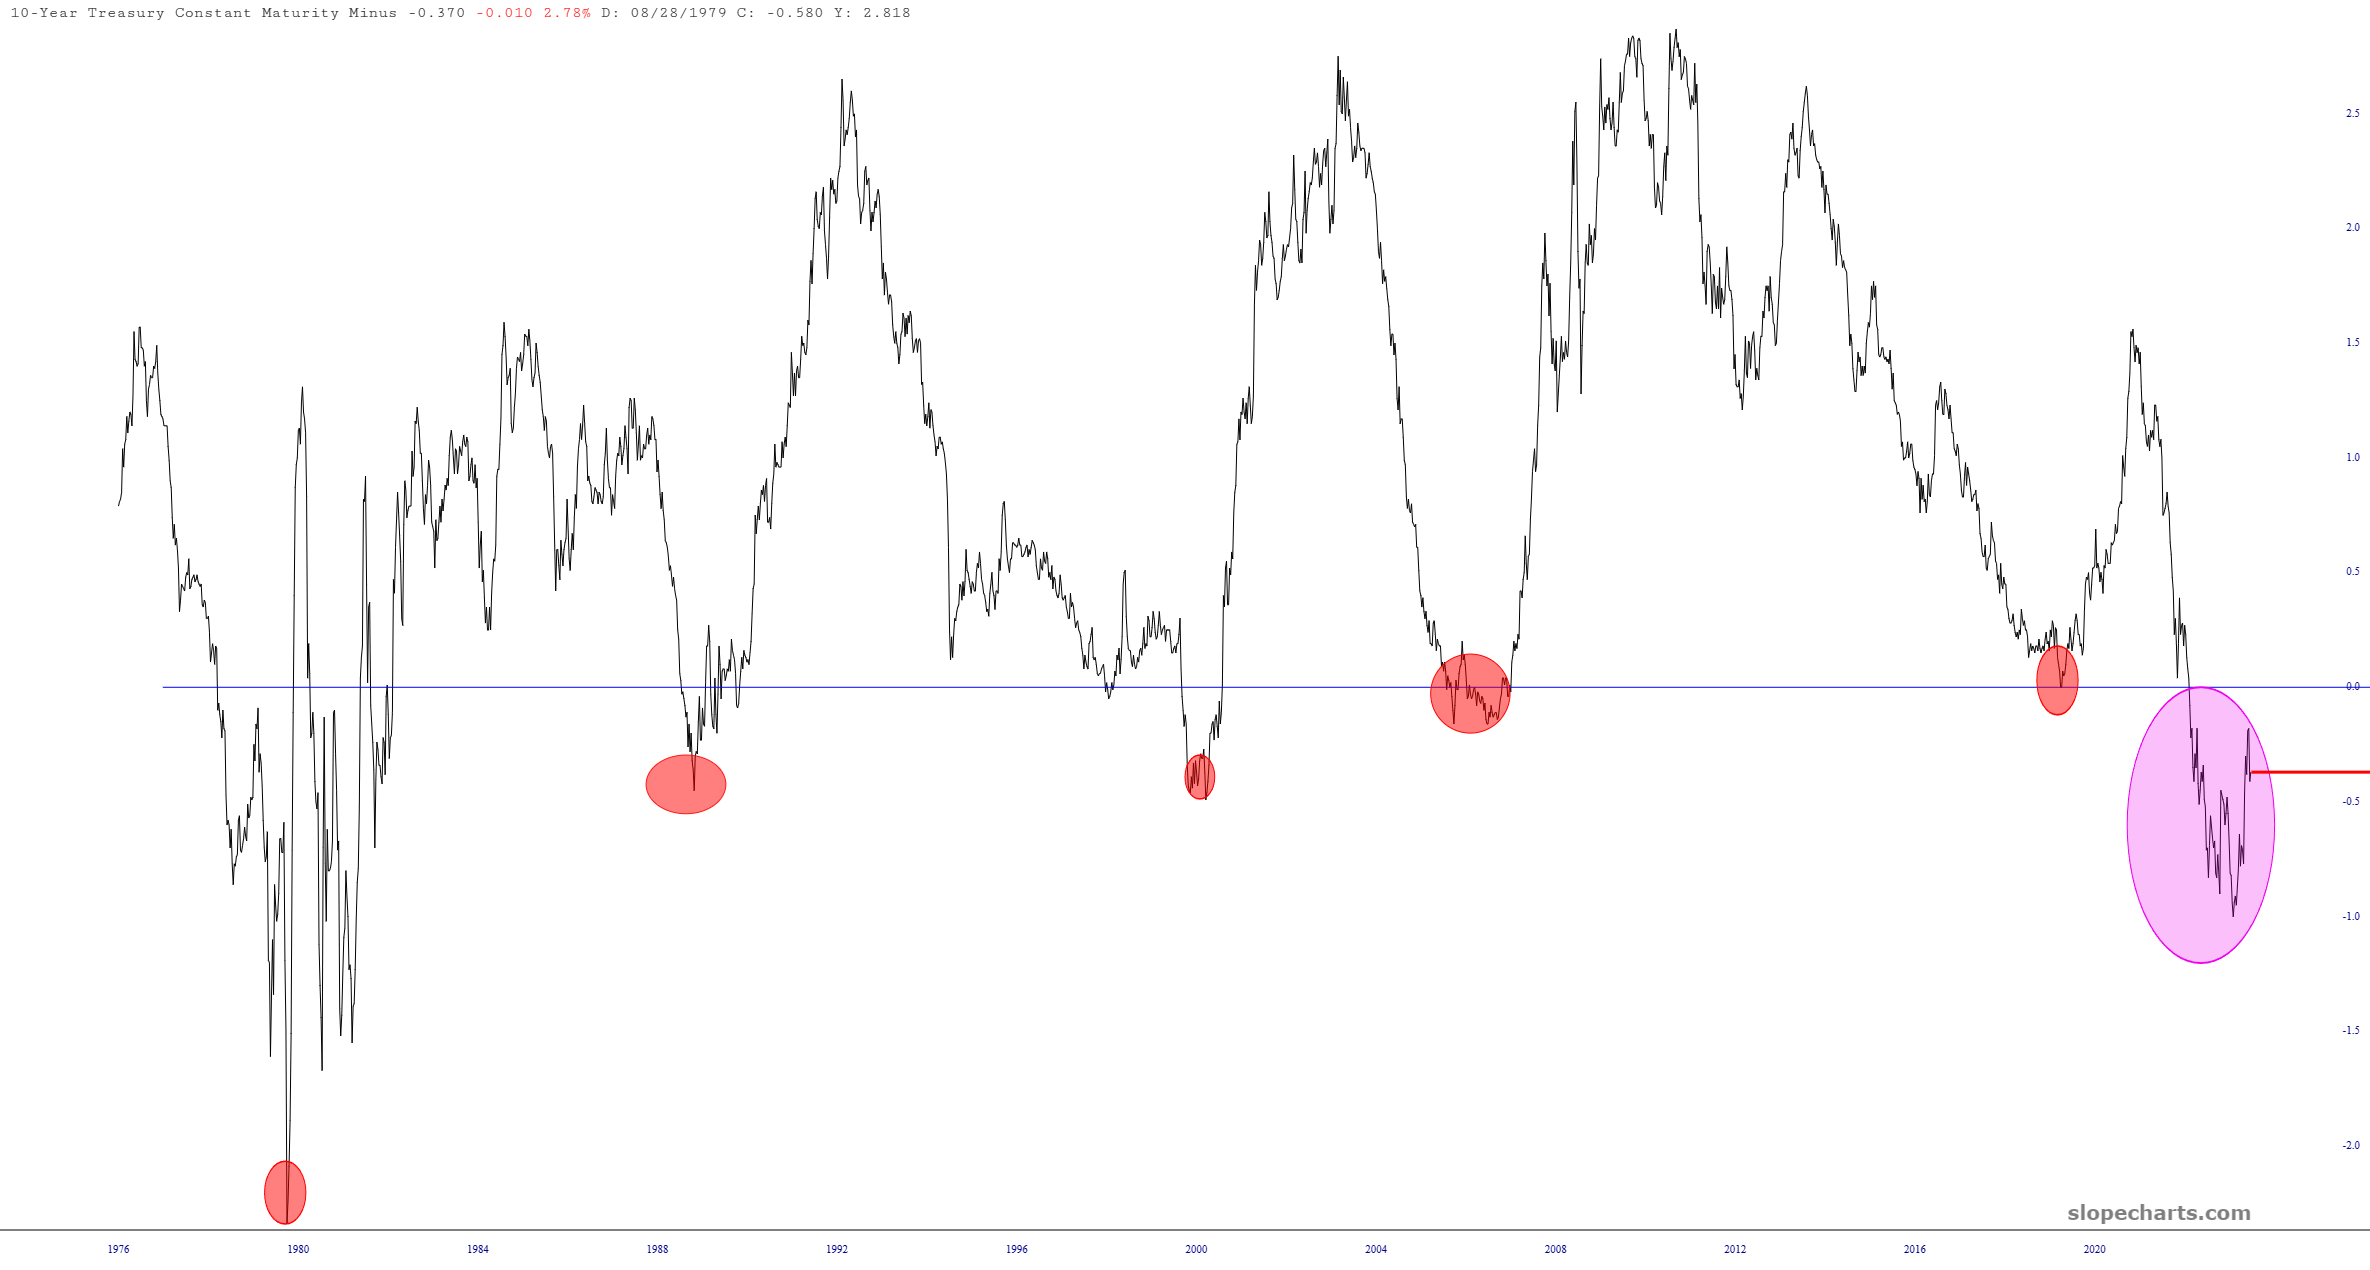
The other chart illustrates the difference between long- and short-dated interest instruments, otherwise known as the yield curve inversion indicator. The portions I’ve tinted are instances in which short-term rates are higher than long-term rates, which is kind of back-asswards and normally shouldn’t happen.
Using our oh-so-cool Layered Mode, I’ve put these two on top of each other, and you can see one very plain fact: every single time the yield curve inverted, a recession followed. Not half the time. Not most of the time. Every single time.
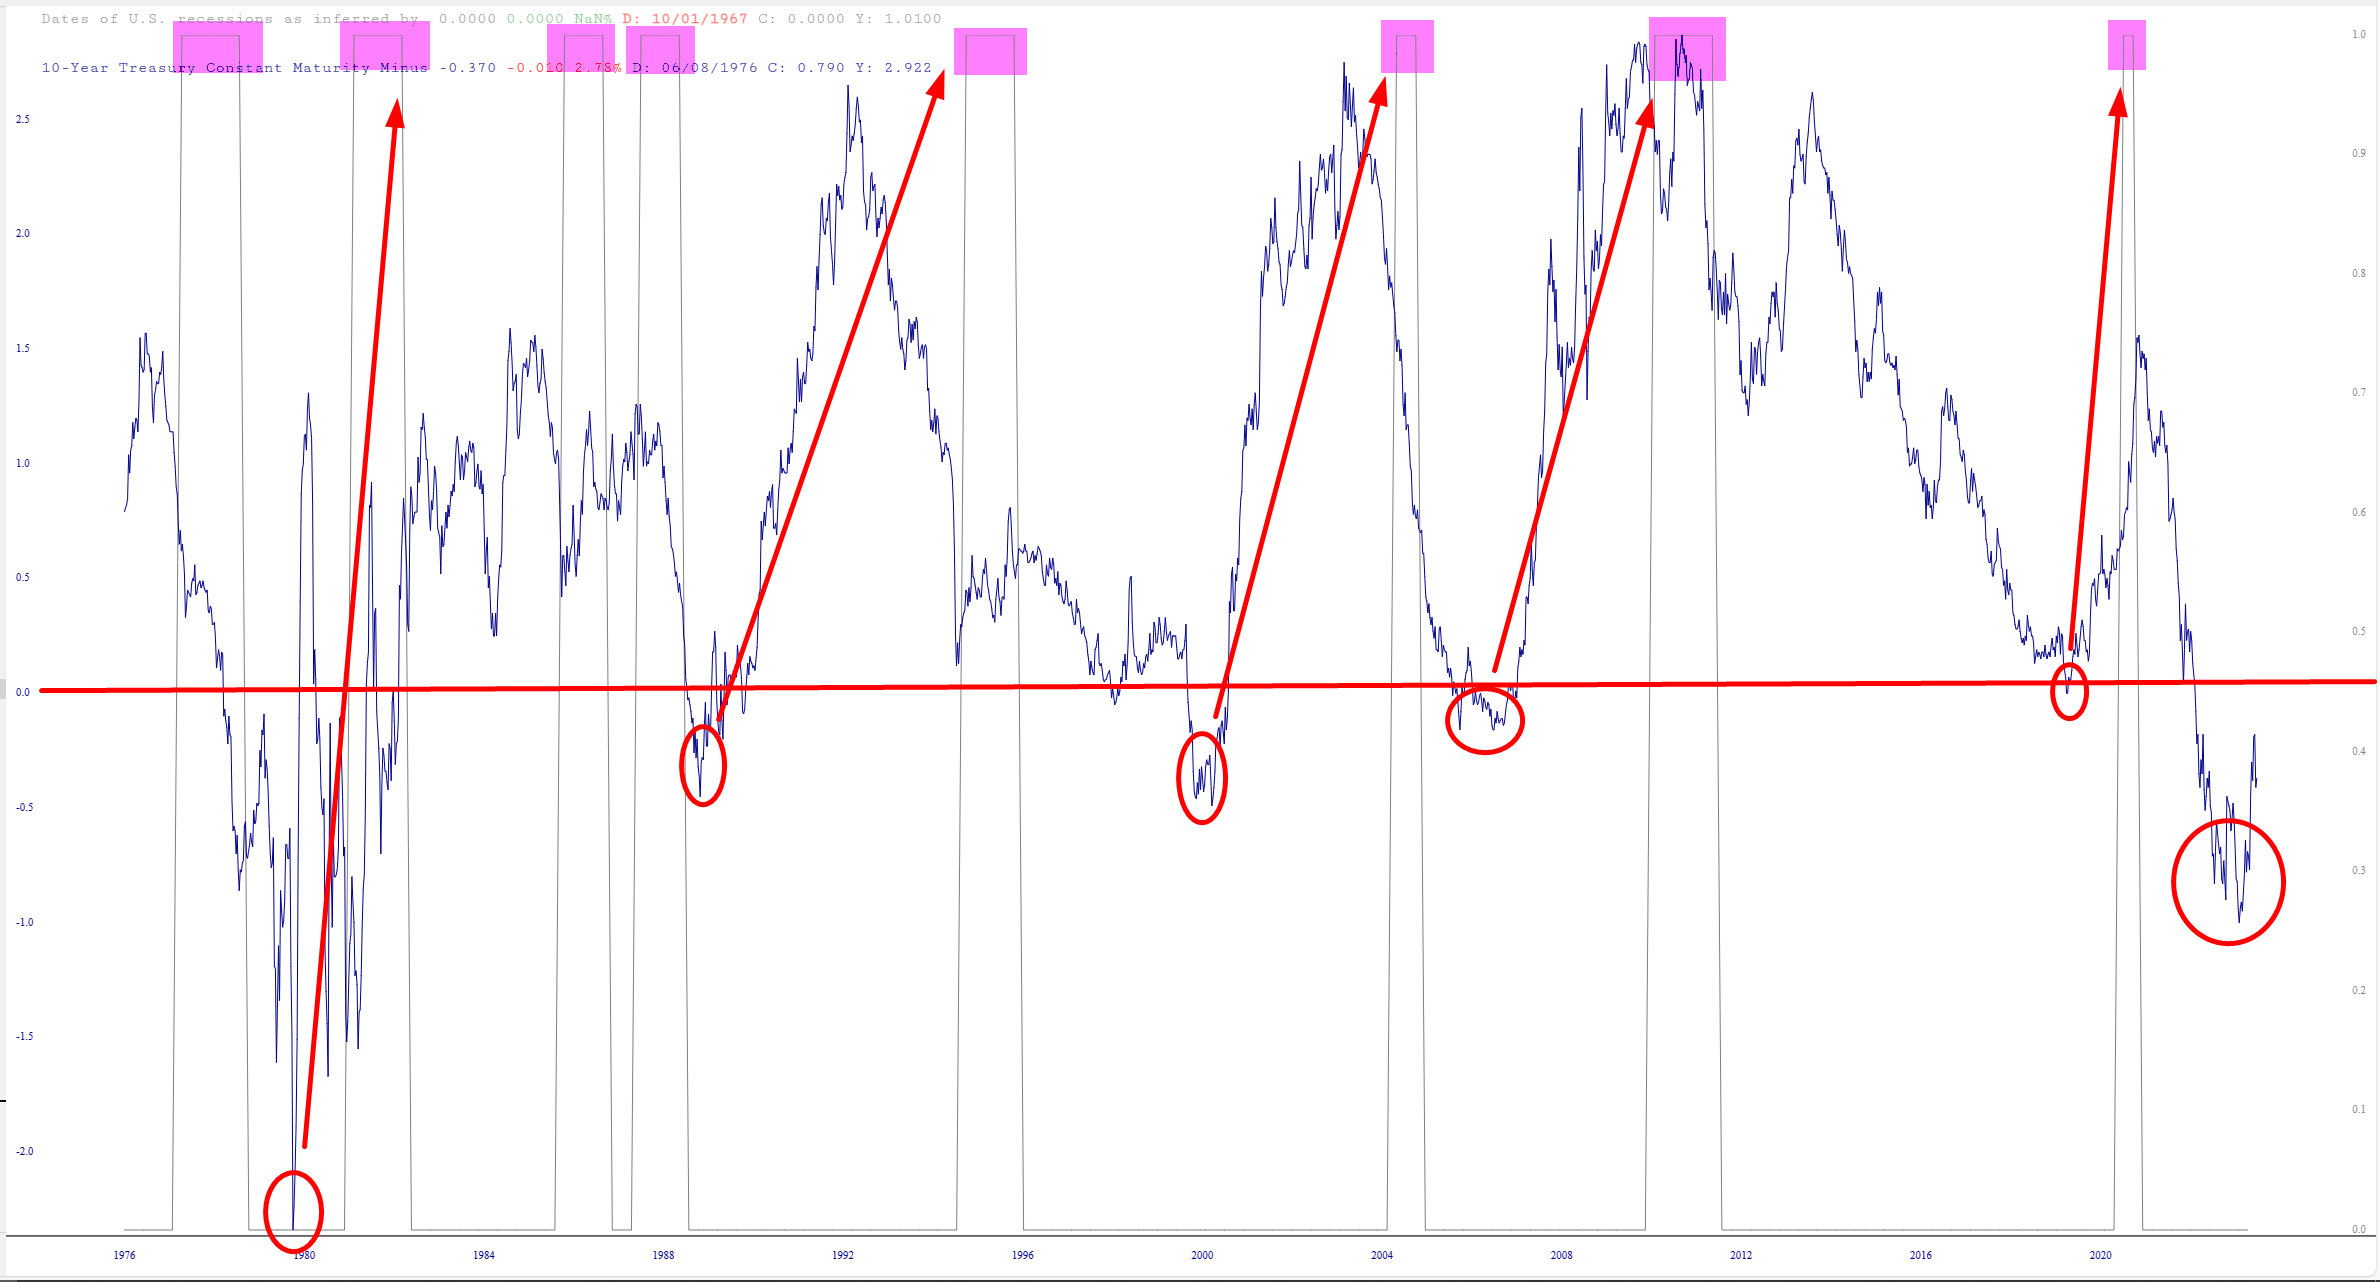
I mean, if some fellow I met on the street kicked me in the nuts after whistling Ave Maria, I’d certainly keep my distance the second time, and the third, and so on. But if, for whatever reason, for five times in a row, this gent strolled up to me, whistled Ave Maria, and zapped me right in the family jewels, I think I’d be rather foolish, on the sixth instance, to just stand there with my legs astride, wondering what was going to happen next.
And yet the experts universally agree on one thing: there’s no recession coming. Promise.
