
Let’s take a look at what the four major markets have done since early July of this year.
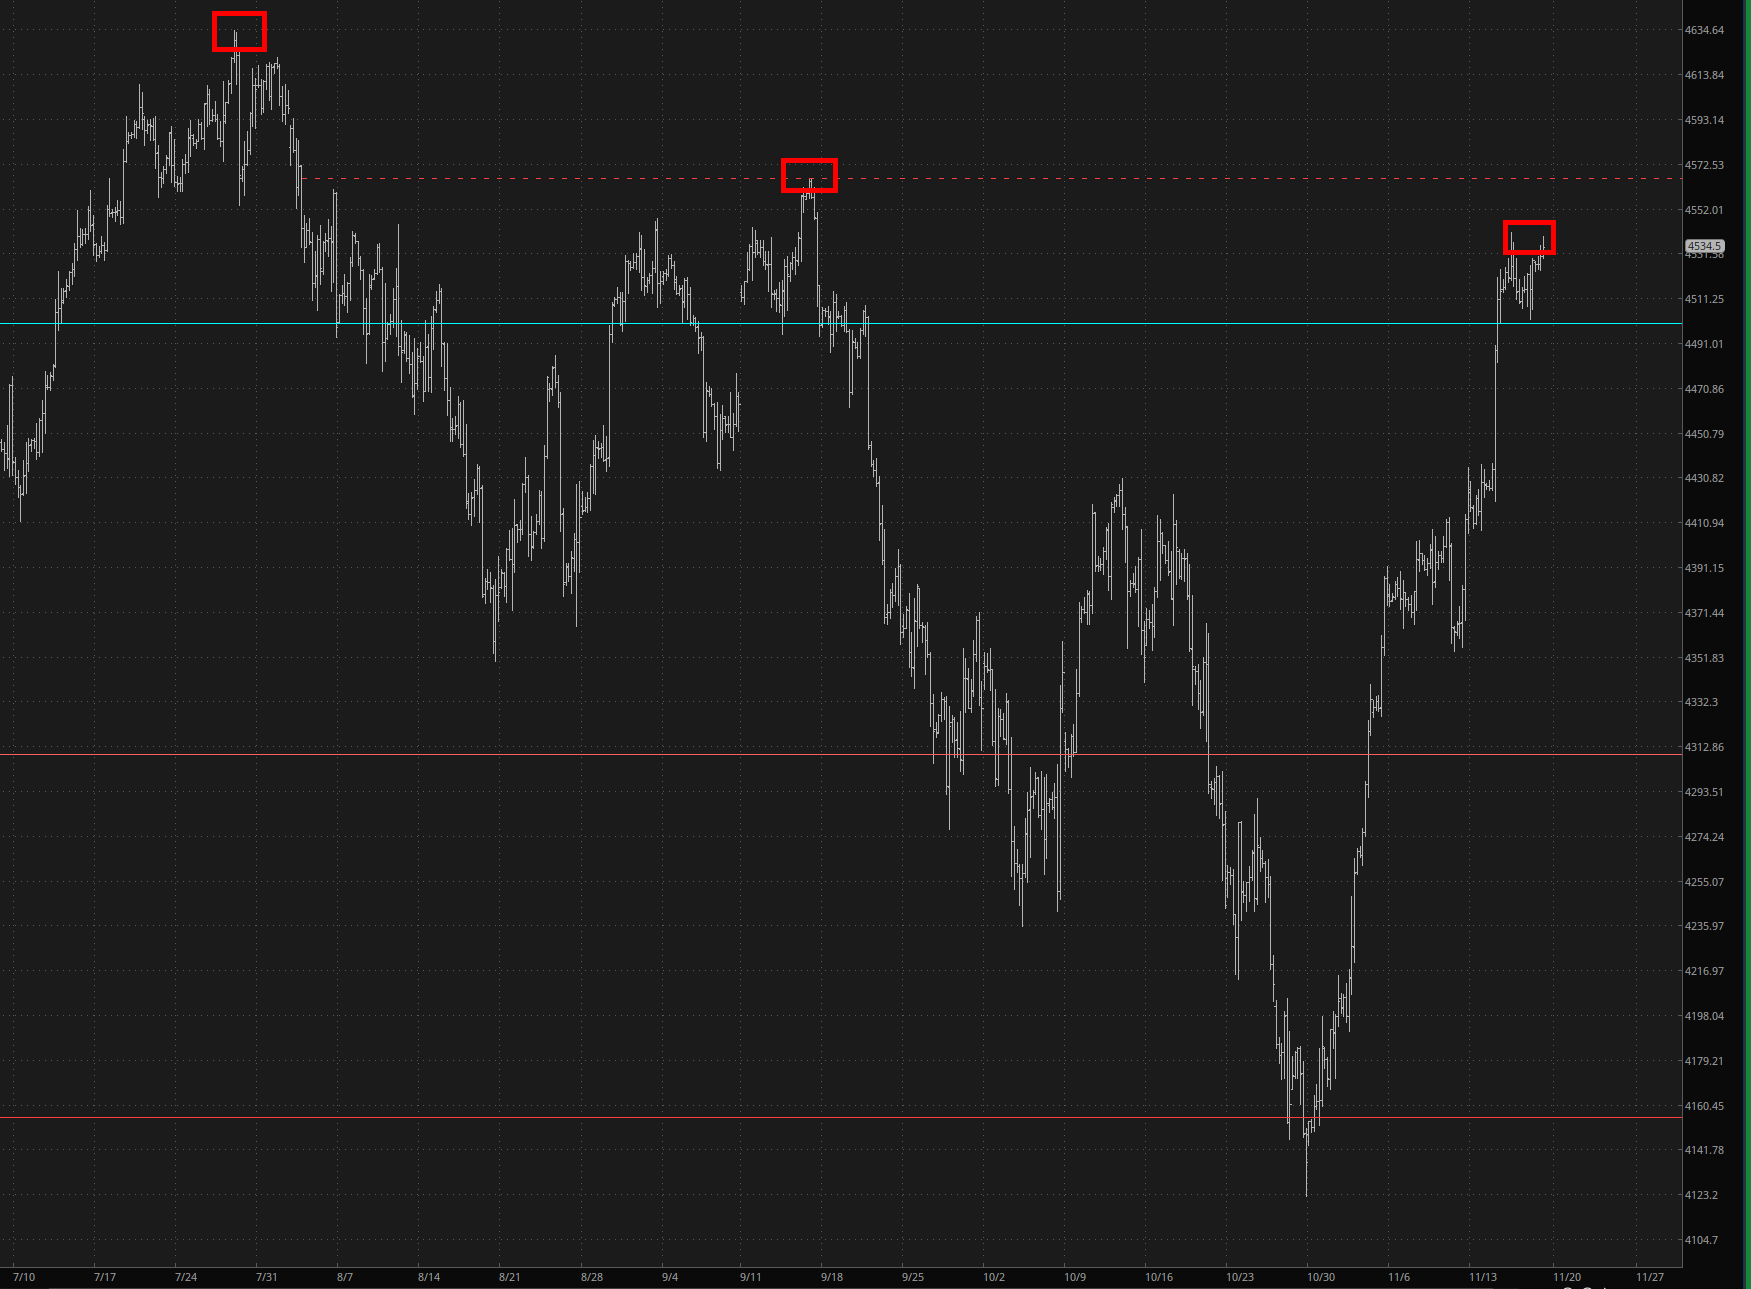
We begin with the /ES, which has made a series of three lower highs. I’ve put a dashed line indicating where the second one was, to illustrate the “Do Not Cross” level for present price levels. We are slightly about the Fibonacci right now, indicating support (albeit shaky).
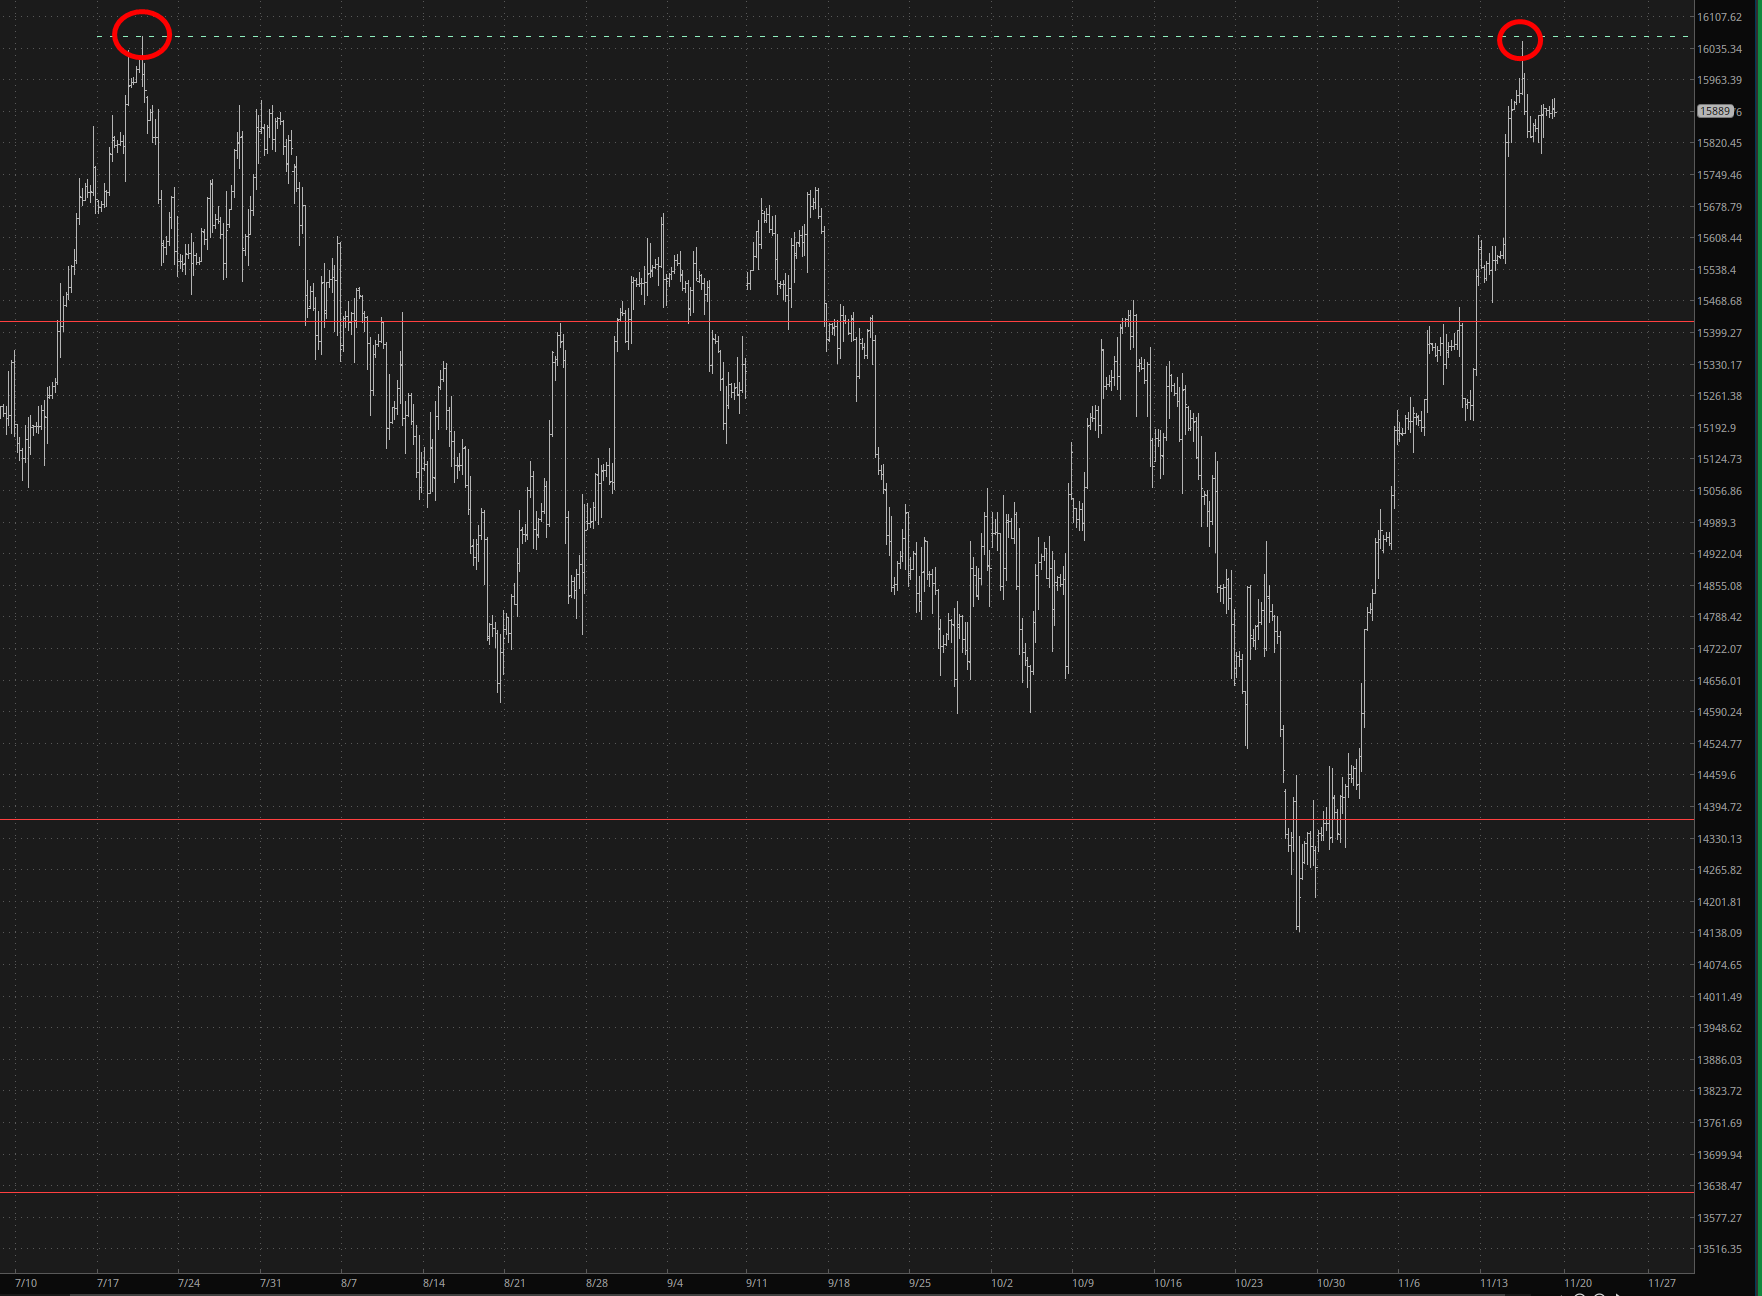
The tech stocks, /NQ, have been jaw-droppingly strong over the past three weeks. That short span of time has erased four MONTHS of weakness. We did an almost perfect double-top (just a little bit shy of it) recently.
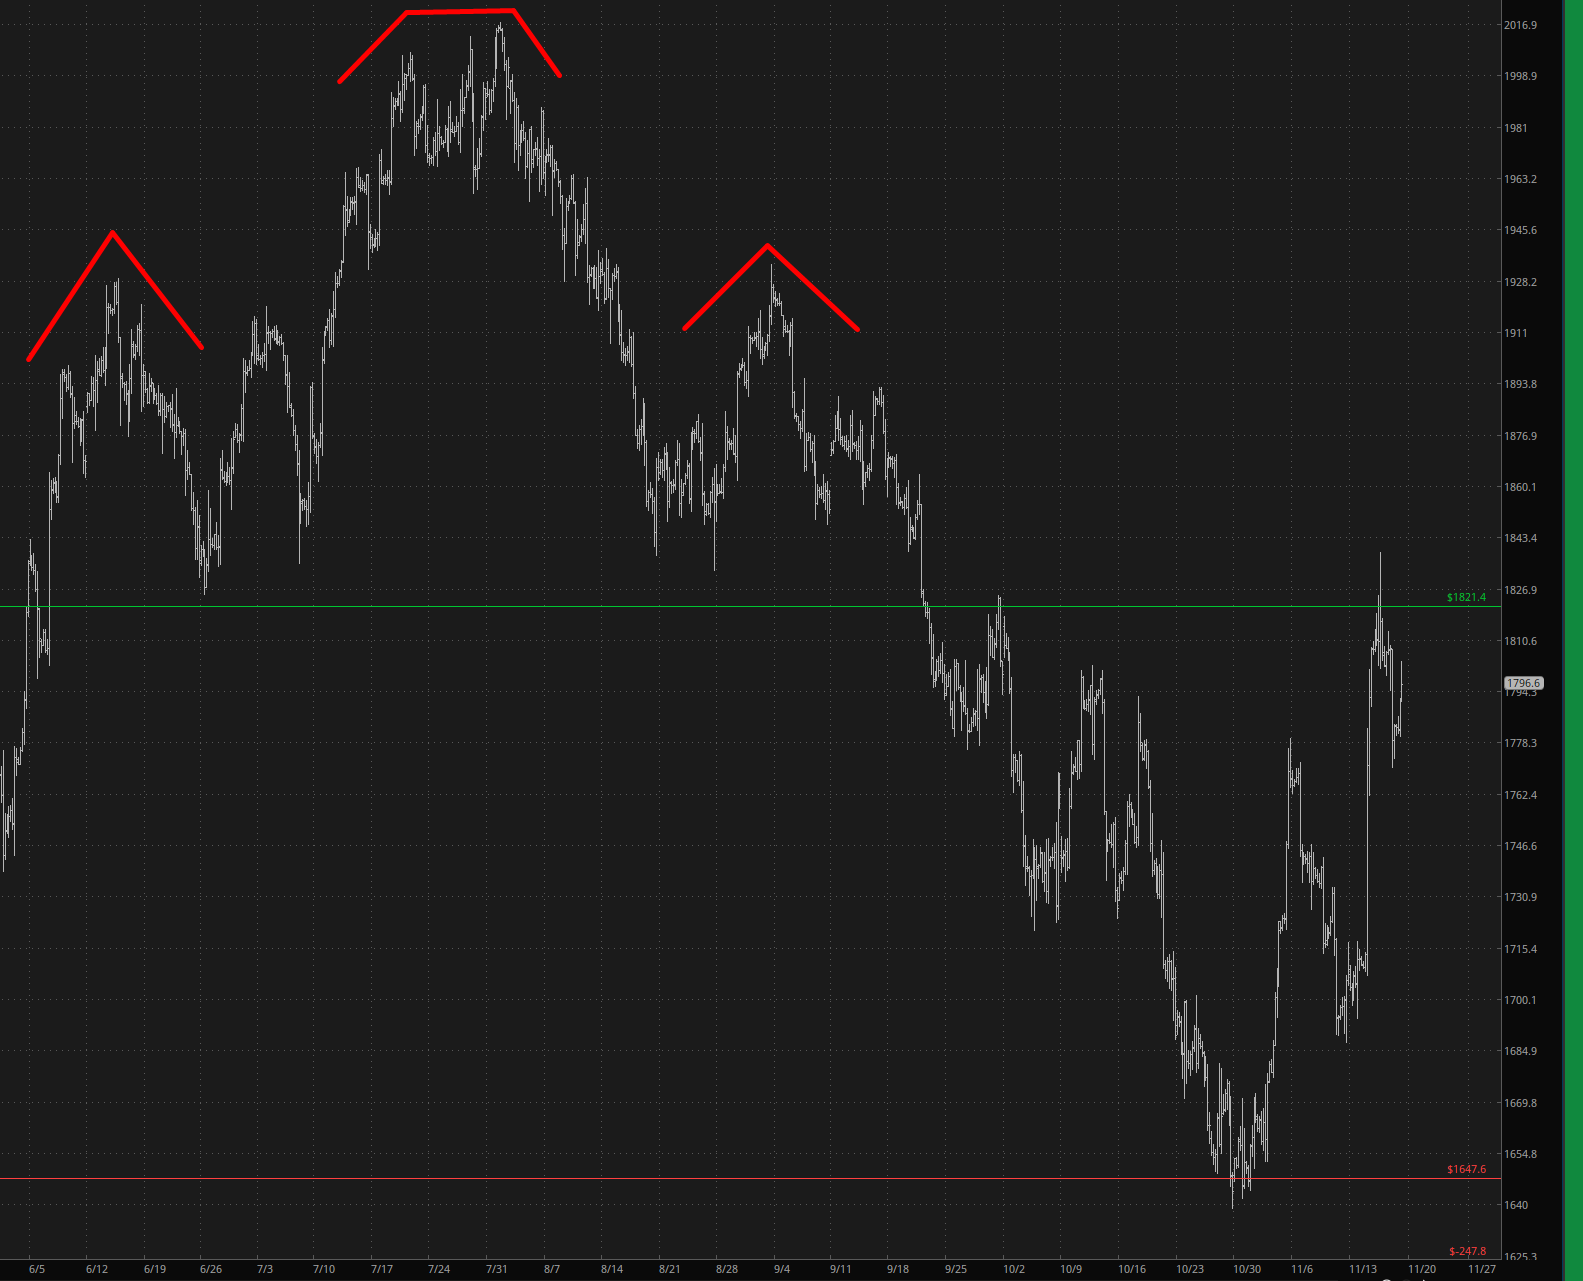
A vastly more interesting chart, and one which actually has a pattern to it, is the small caps /RTY, which is sporting a big ol’ H&S top. We recent rammed prices right up against its neckline, and I think this sucker is in imminent danger.
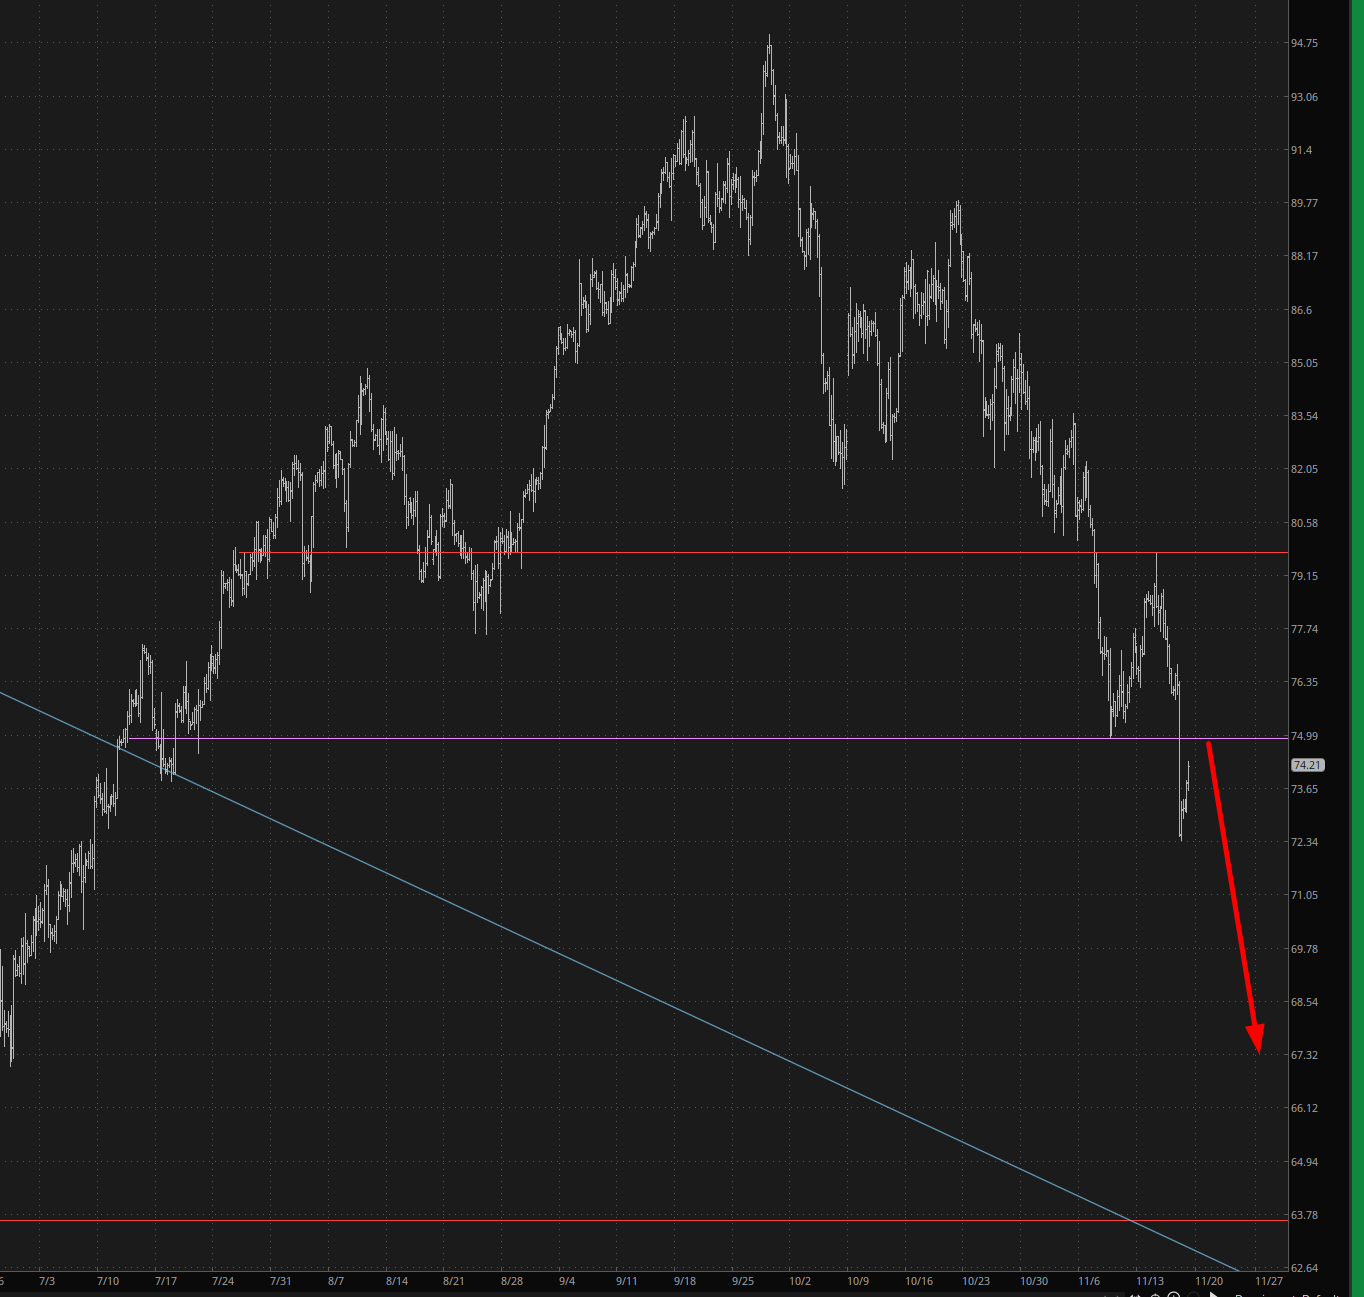
Crude oil, interestingly enough, has a somewhat similar (although not as clean) topping pattern. Here, too, I think we’re going to see some serious droopage in the near future.
The bulls have run roughshod over the bears since Halloween, and all lips (including Tom Lee’s, which he just touched up with a sassy new rouge) are talking about the Santa Claus Rally. Well, m’kay, believe what you will. I’d say 2024 is going to make 2022 look like child’s play, and, to everyone’s shock, it may well be the multi-trillion-dollar tech stocks that help lead the way lower.
I am 100% invested on the short side right now and am not budging.
