Slope initially began as a blog, so this is where most of the website’s content resides. Here we have tens of thousands of posts dating back over a decade. These are listed in reverse chronological order. Click on any category icon below to see posts tagged with that particular subject, or click on a word in the category cloud on the right side of the screen for more specific choices.
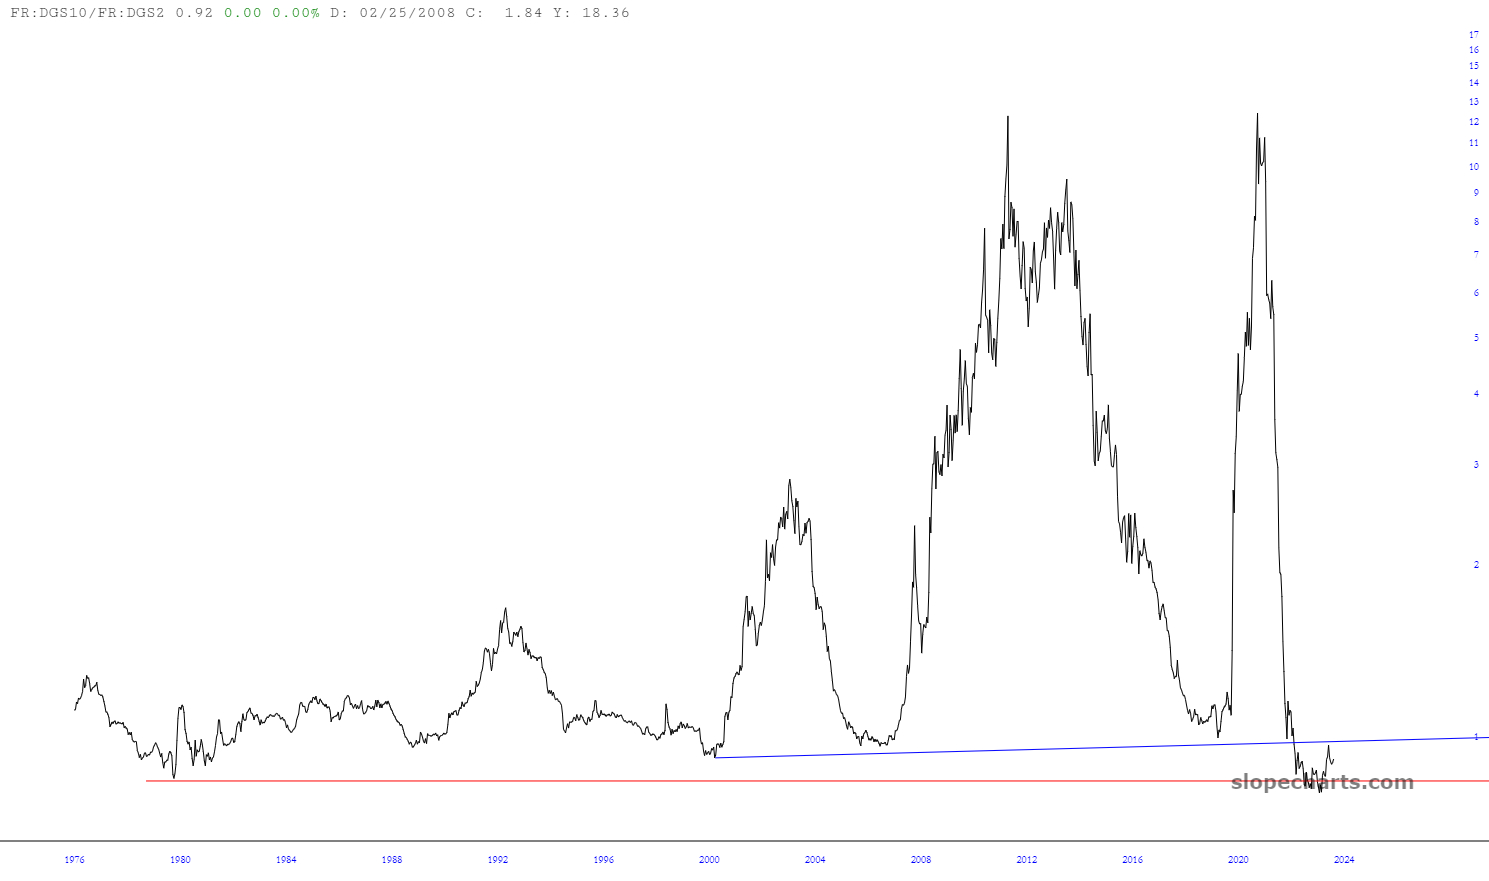
There’s no need to overcomplicate 2024. There is a single indicator with a perfect track record of recession, correction or bear market: the spread between the 2-year and 10-year yield.
Since everyone is familiar with the spread chart, I’ll show the ratio instead.
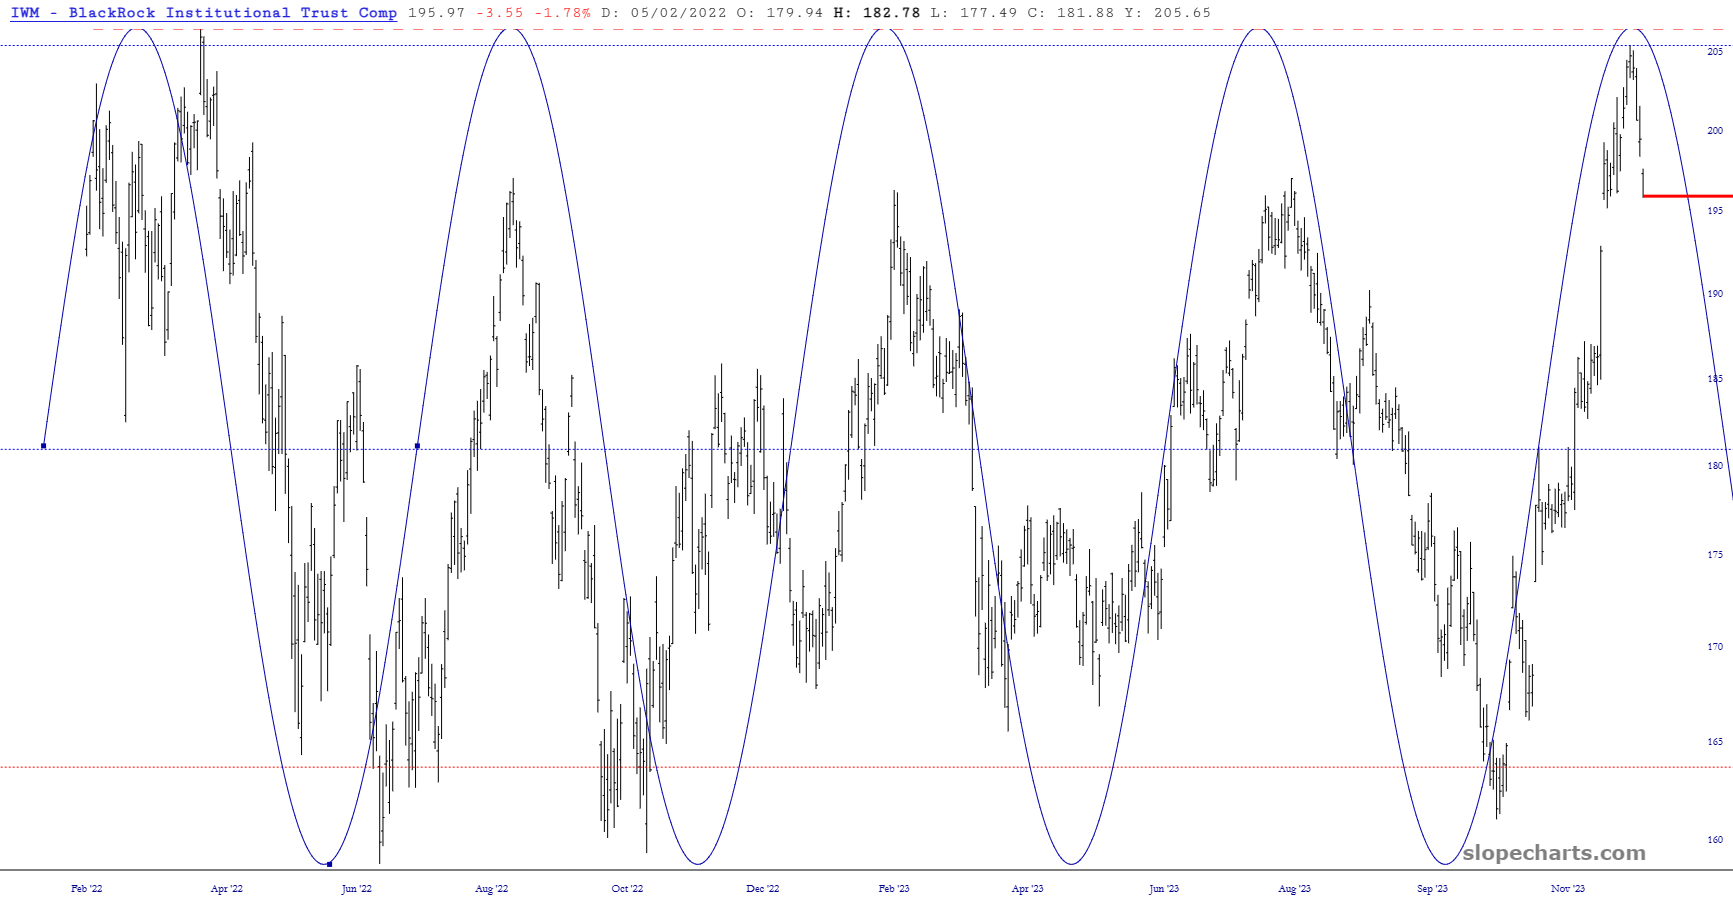
Let’s catch up on my three (and only three!) positions, which are long March put positions on these ETFs, all based on precisely the same supposition: that they will follow their sinewaves lower.
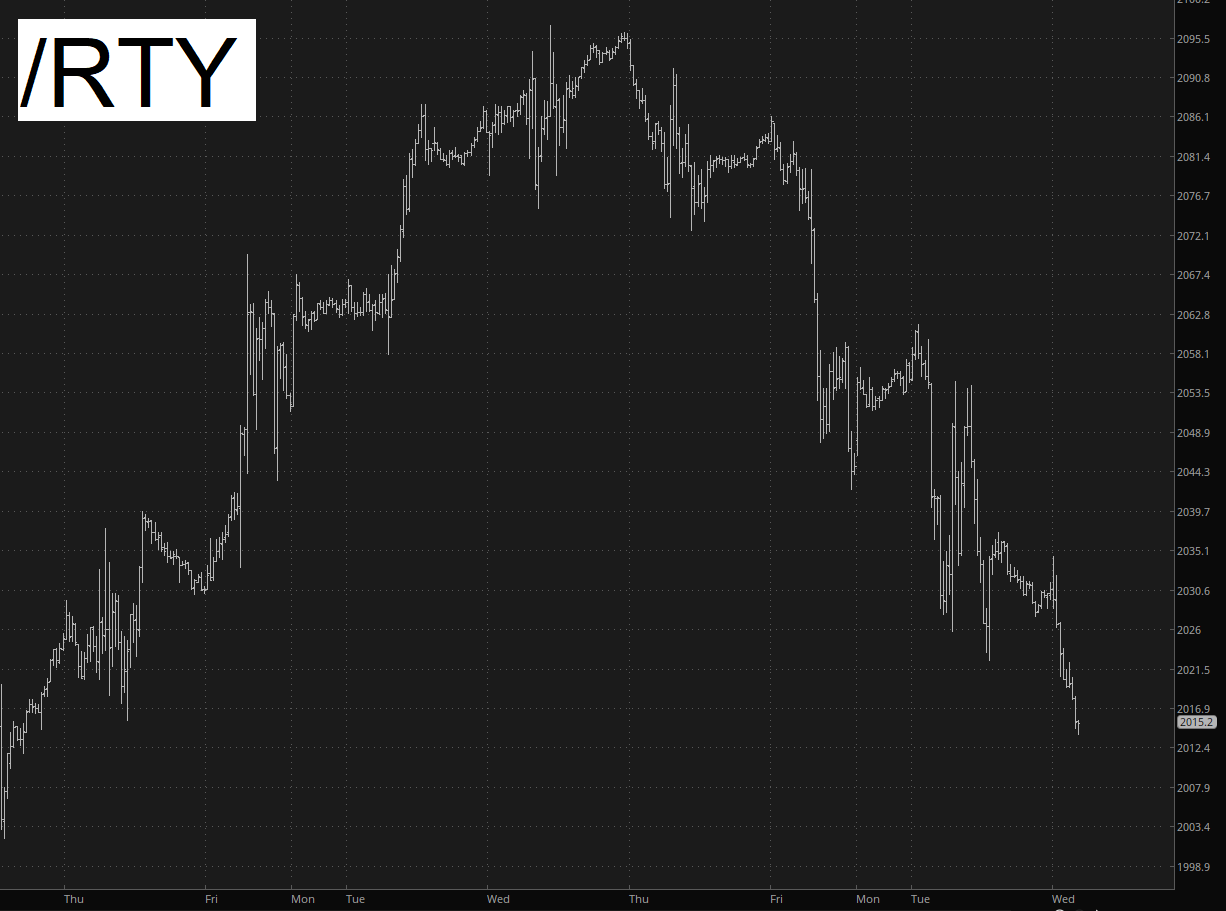
Good morning, everybody. It looks like we’re heading for a second red day (hopefully) as every single asset class has done a perfect U-turn over the past week. The end-of-year exuberance has perhaps morphed into a dawning realization that things maybe aren’t so peachy.
Today has been shamefully devoid of original content by me. Before I head to bed, I wanted to fix that! Thus, below, I share a number of ETF charts and a few words about each of them, now that this first day of the trading year is behind us.
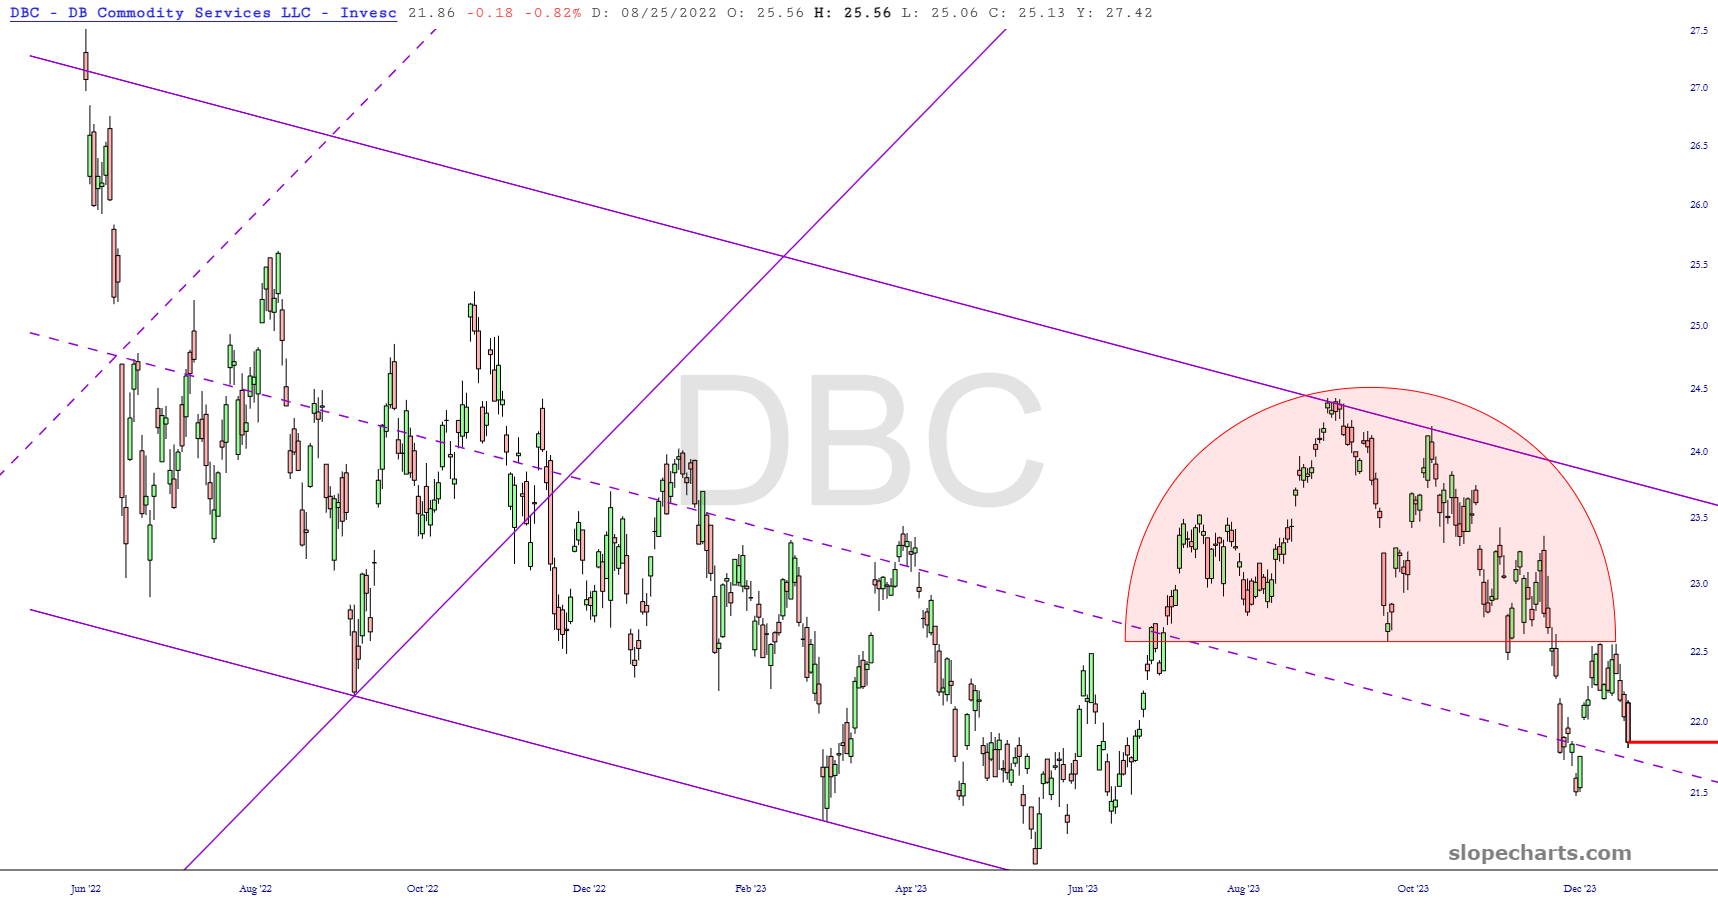
We begin with DBC, which is doing a yeoman’s job of sinking. It is approaching the lower half of its long-time descending channel, and I think energy is speaking truthfully to us about what’s ahead for the economy (as opposed to, let’s say, that four foot dwarf named Janet Yellen who ranks as one of the most vile and evil humans ever to be spawned on planet Earth, and whose very presence here is a curse to all decent men and women).