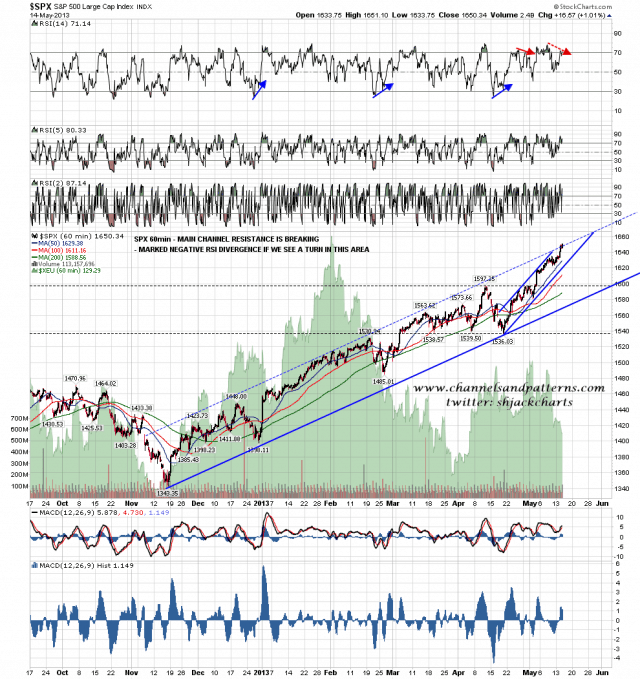
ES/SPX went to the level I expected yesterday …. and then a couple of points further. That was disappointing as it has compromised the upper trendline of the rising channel from the November low, to the extent that I don’t think that can still be relied upon as resistance. IF SPX turns back down here then the negative 60min RSI divergence should deliver a retracement for at least a couple of days or so:
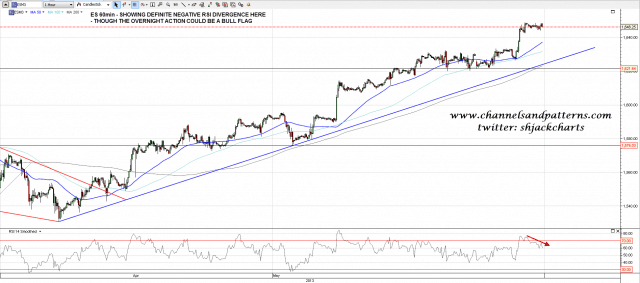
There is also marked negative RSI divergence on the ES 60min chart, though the overnight action looks rather like a bull flag so far. I’m expecting some pullback soon to test the area with the 50 hour MA, and that’s now in the 1637.50 area:
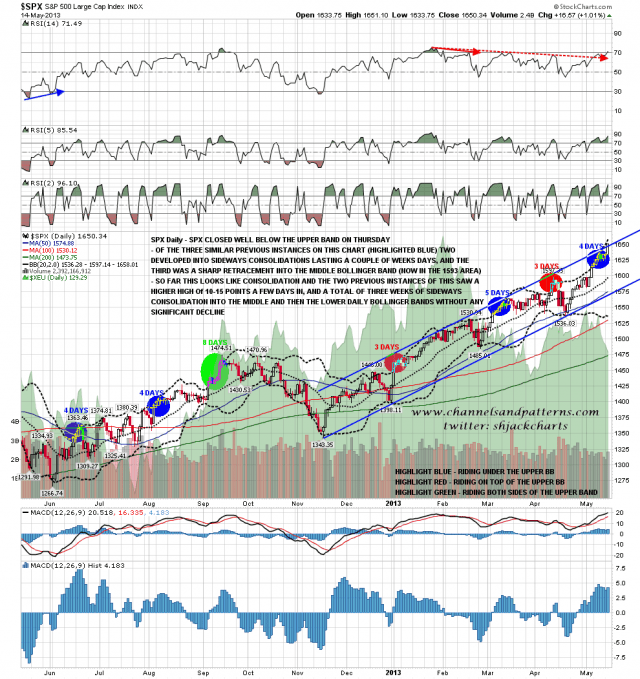
I was talking yesterday about the two comparable periods on the SPX daily chart, the last two highlighted in blue. Those both saw a a last push higher of 10-15 points three to five days after the three week consolidation began, and we saw that yesterday. If we are still following the same script then we might see slightly higher intraday today, but essentially a ceiling has been put in that should last two to three weeks from here as SPX consolidates sideways and the daily bollinger bands pinch together. I think we may well see that happen here:
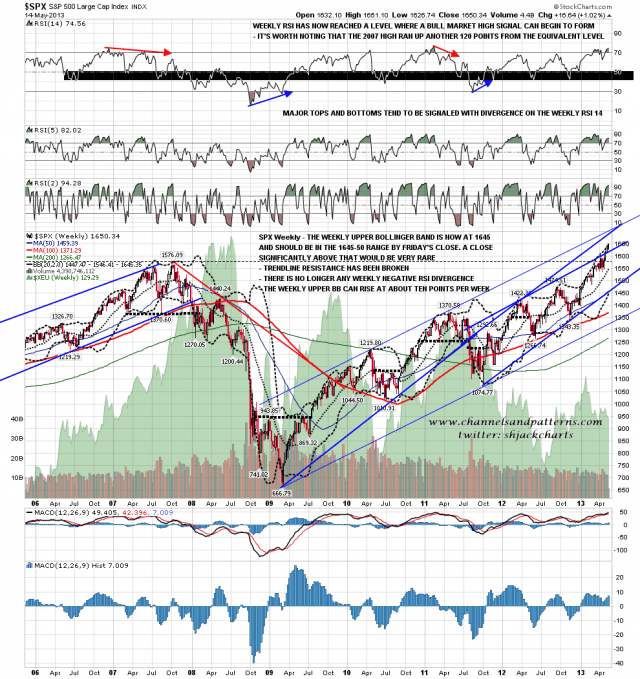
A key reason to think that we will see that consolidation here is on the weekly chart, where you can see that SPX closed five points above the weekly upper bollinger band yesterday. This weekly upper bollinger band can only rise at about ten points per week or so, and closes well above it are both rare and tend to immediately precede significant highs. Upside here is limited while SPX is so far extended, and we will see either consolidation here or a significant high in the next couple of weeks. I’m leaning towards consolidation, even in the absence of rising channel resistance on SPX:
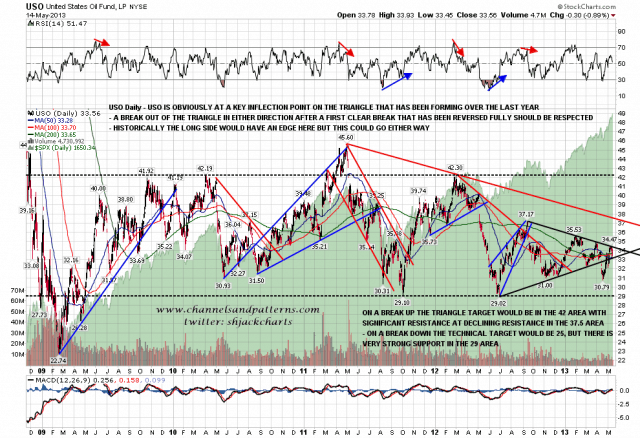
I posted a USO chart last week showing the important inflection point here on oil. Oil is still in the inflection point area at the tip of the year old triangle, but closed yesterday testing support there. If we see a break down that should be respected:
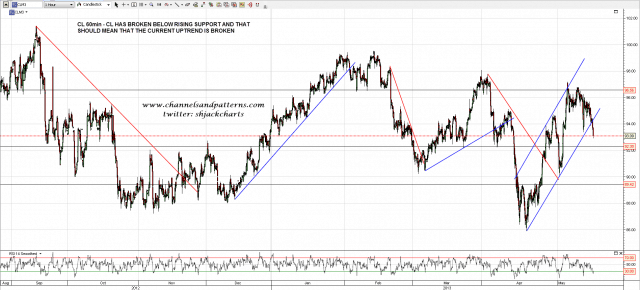
Will USO break downwards here? Most likely yes, as rising support for the recent uptrend has broken on CL overnight If we see that break down confirmed on USO today I’ll be looking for 29 as my first target there:
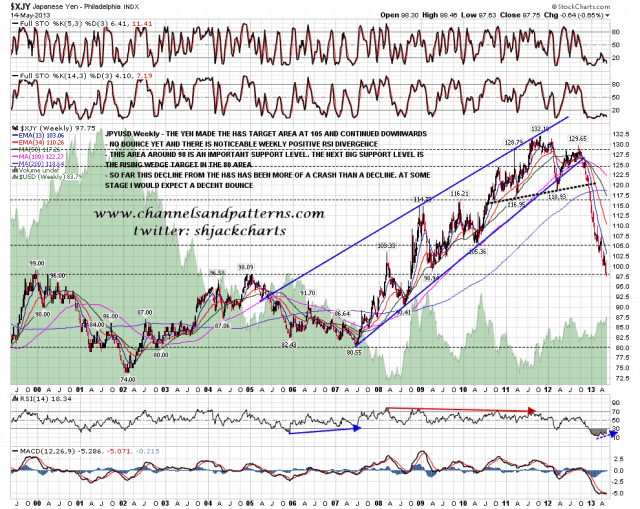
For my last chart today I thought I’d post an updated chart for Yen. Yen has fallen a long way since I called it as a short on 14th November, and blew straight through the H&S target and big support level at 105 with barely a pause. I marked in one further big support level at 98/9 between 105 and the rising wedge target at 80, and JPYUSD is testing the 98/9 area now. If it’s going to bounce before reaching 80 then this is the most likely place, and it’s worth noting the increasing positive divergence on the weekly RSI. Any bounce would mainly be an opportunity to reload short higher in my view, as I’m expecting that 80 target to be made sometime in the next year, and I’m not taking this counter-trend long, as this particular falling knife appears to have a very sharp edge and a wicked looking point:
We are at an inflection point on ES/SPX here. I favor consolidation, in which case we should have a daily closing ceiling at 1650 established now that will last two or three weeks as SPX trades sideways in the 1625-50 range.If we see continuation upwards and a weekly close more than ten points above the weekly upper bollinger band, which should be in the 1645-50 area by the close on Friday, then historically that should signal a significant high within a couple of weeks.


