
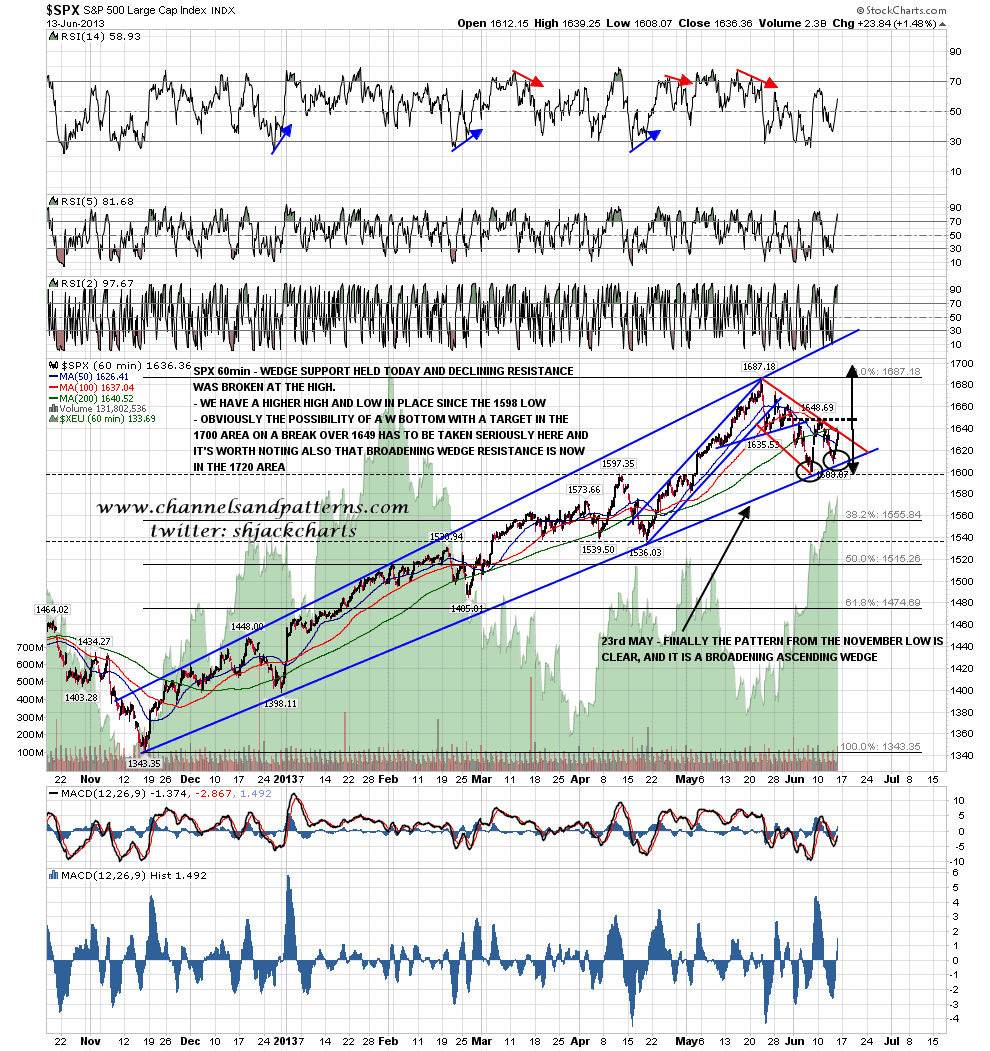
Well I was really expecting the SPX broadening wedge to break down yesterday or today but after yesterday’s strong reversal that’s now unlikely. On the SPX 60min chart there is a potential double-bottom that triggers a target in the 1700 area on a break over 1649. It’s worth noting that broadening ascending wedge resistance is now in the 1720 area. SPX 60min chart:
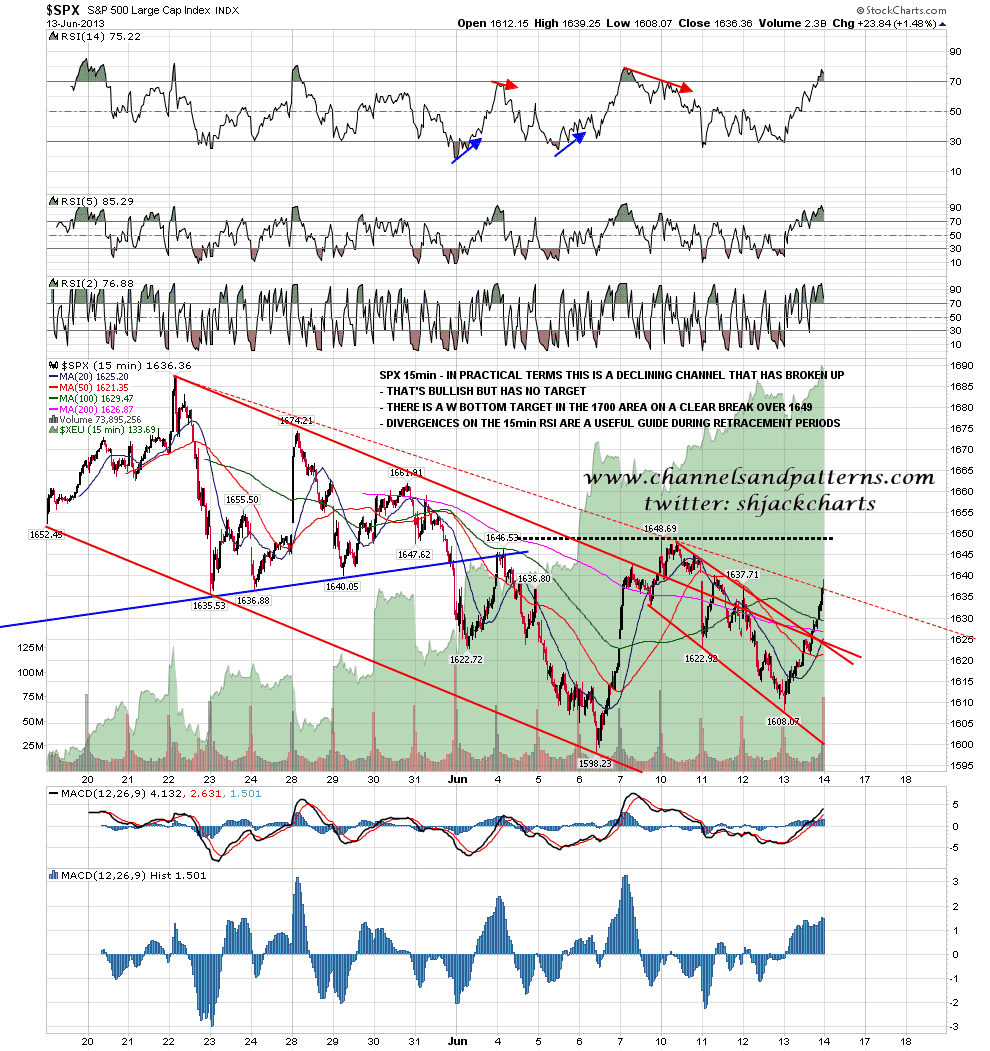
Looking at the SPX 15min chart, revised declining resistance was broken at the highs yesterday,and the pattern setup is a declining channel that has broken up. That broken channel doesn’t trigger any target but that double-bottom is obviously in play on a break over 1649. SPX 15min chart:
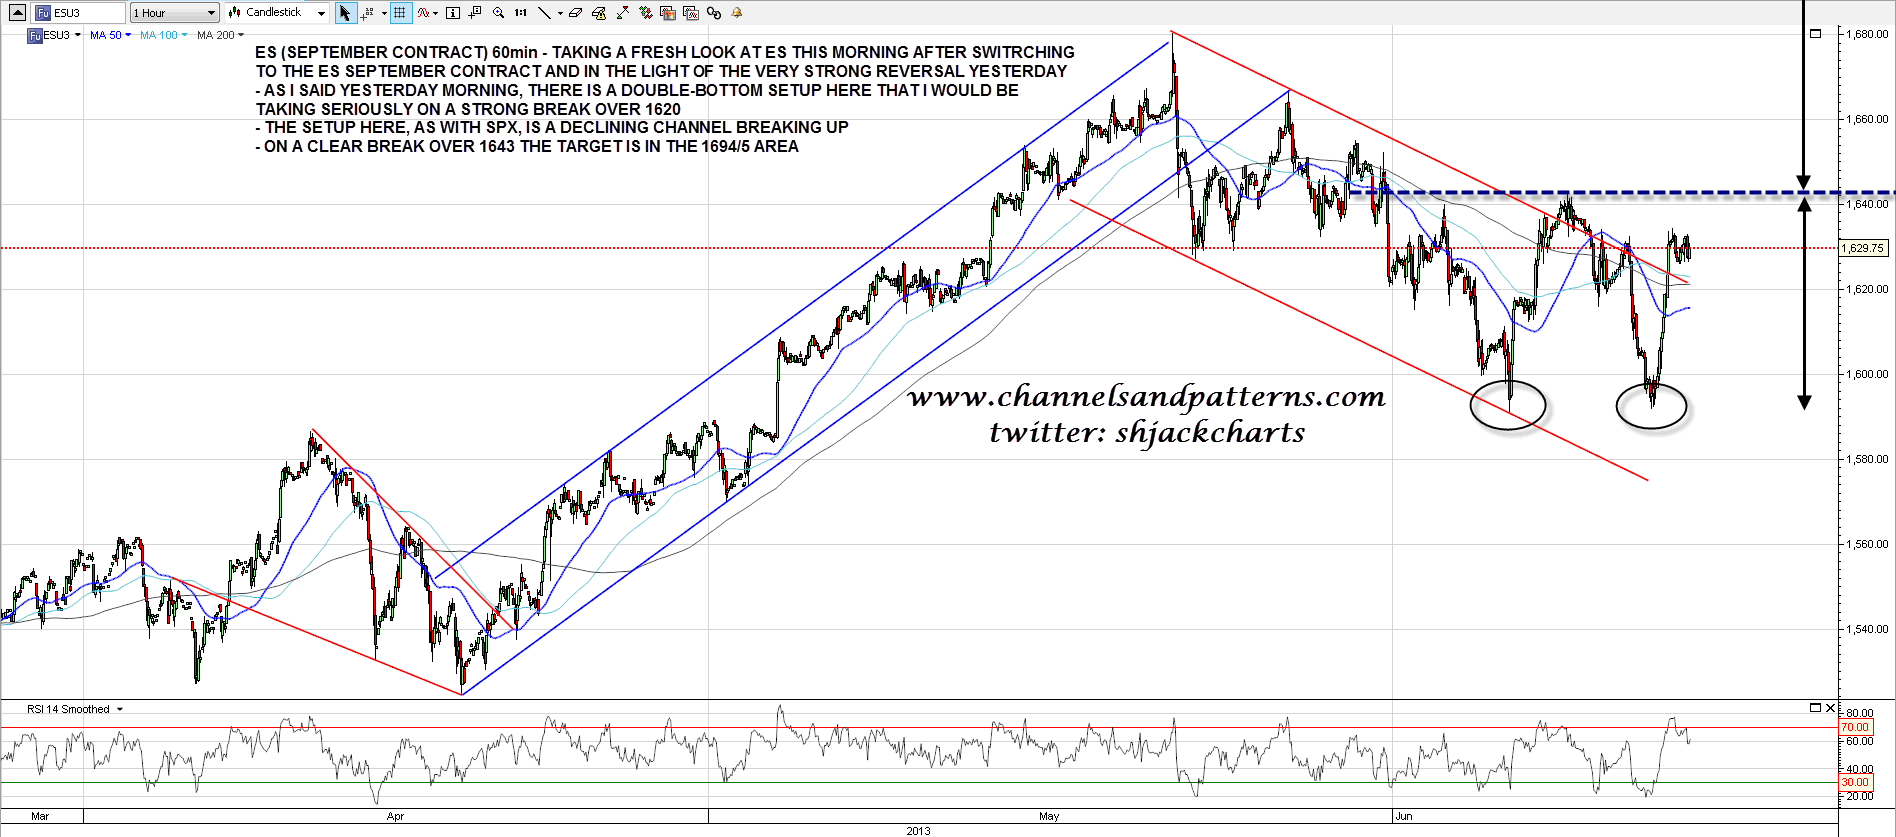
I’ve taken the opportunity with switching ES over to the September contract this morning of redrawing all the trendlines on the chart from scratch. As with SPX the basic setup on ES a declining channel that has broken up and that’s bullish without any set target. The double-bottom setup is very clean on ES however and on a clear break over 1643 the pattern target is in the 1694/5 area. I would also note that the action overnight so far looks like a bullish pennant. ES 60min chart:
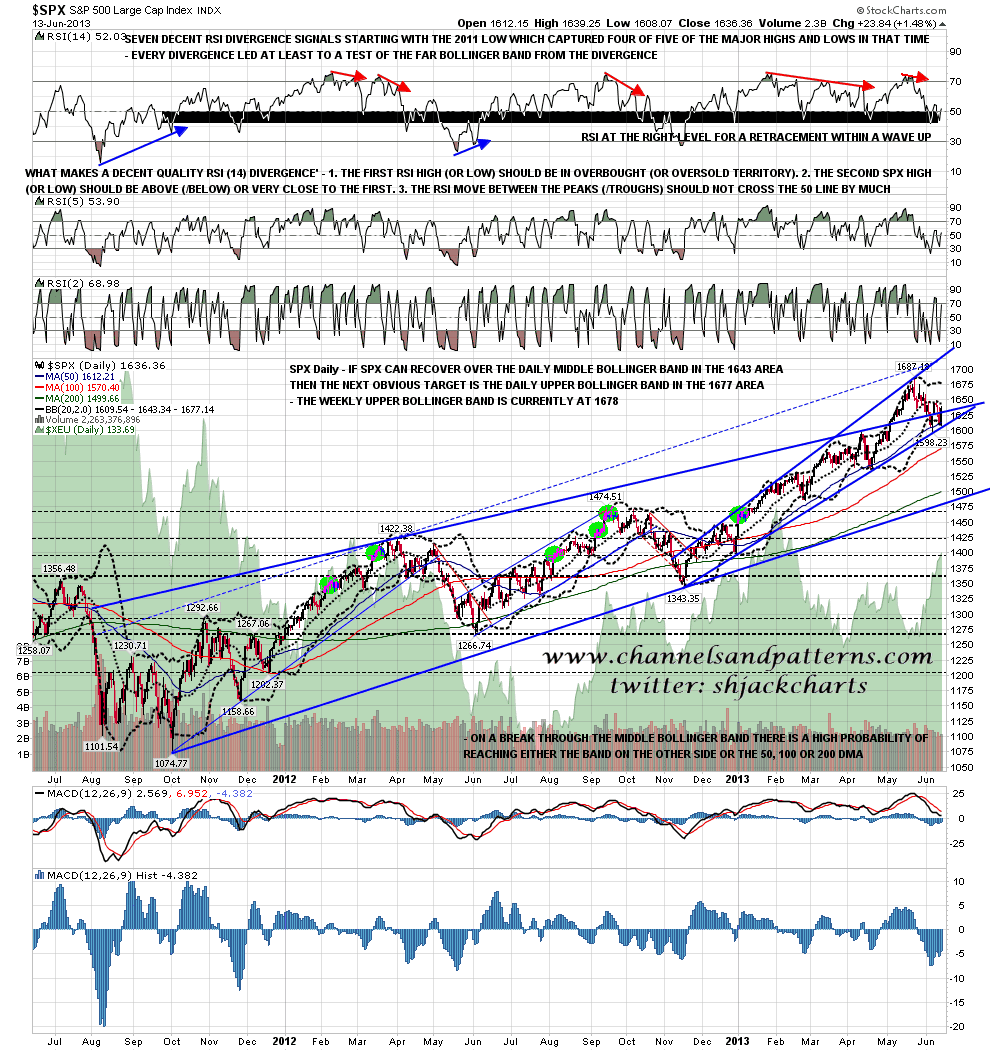
There is a word of warning with these double-bottom setups however, and that is that targets that are higher than the high made before the downtrend leading into the pattern tend not to make target as often. With that in mind it’s worth adding that resistance at the daily and weekly upper bollinger bands are respectively at 1677 and 1678 at the close yesterday, and that significant breaks above the weekly upper bollinger band are rare. SPX daily chart:
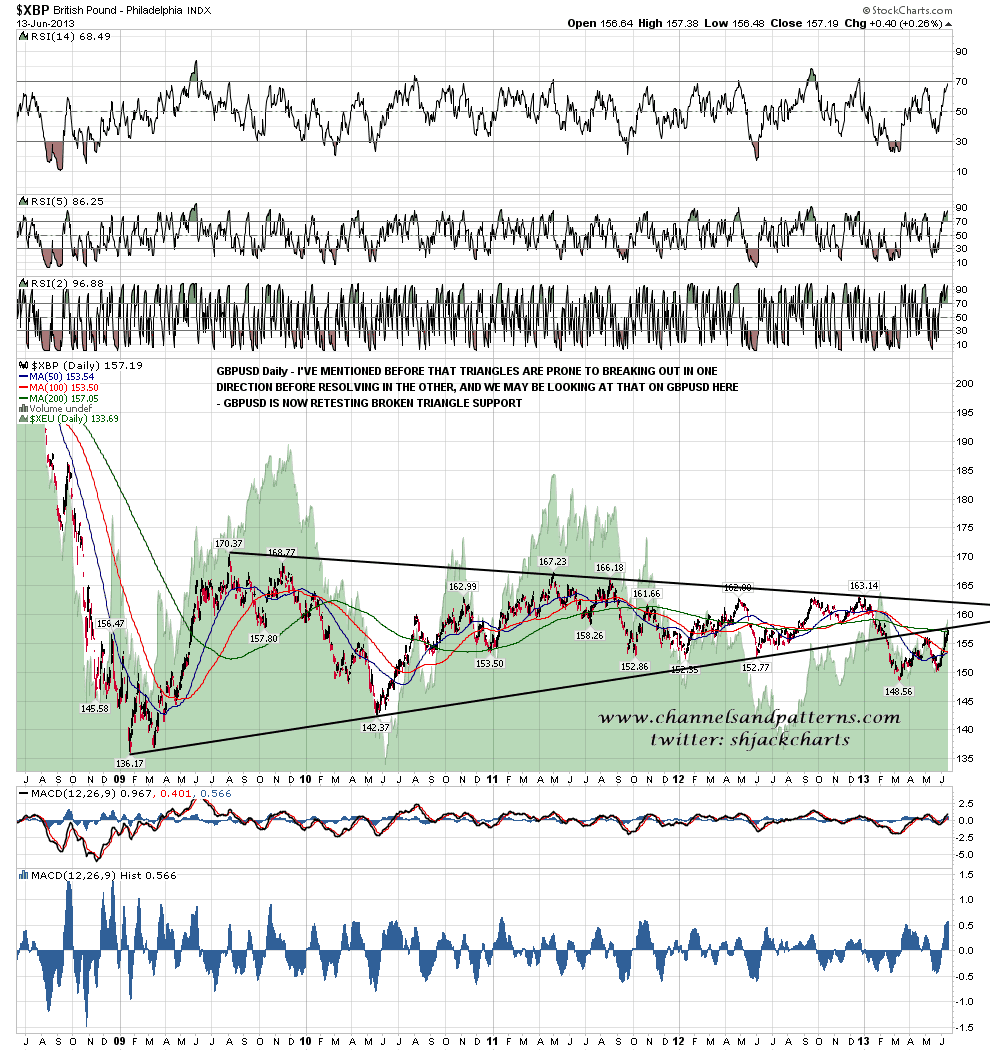
Obviously the technical picture on USD has been deteriorating rapidly over the last couple of weeks, and one of the key currency pairs has now rallied to an important technical level. GBPUSD broke down from a big triangle a few weeks ago and I mentioned then, as I generally do with triangles, that triangles often make a false break in one direction before resolving in the other. GBPUSD is now retesting broken triangle support and we’ll see how that goes. GBPUSD daily chart:
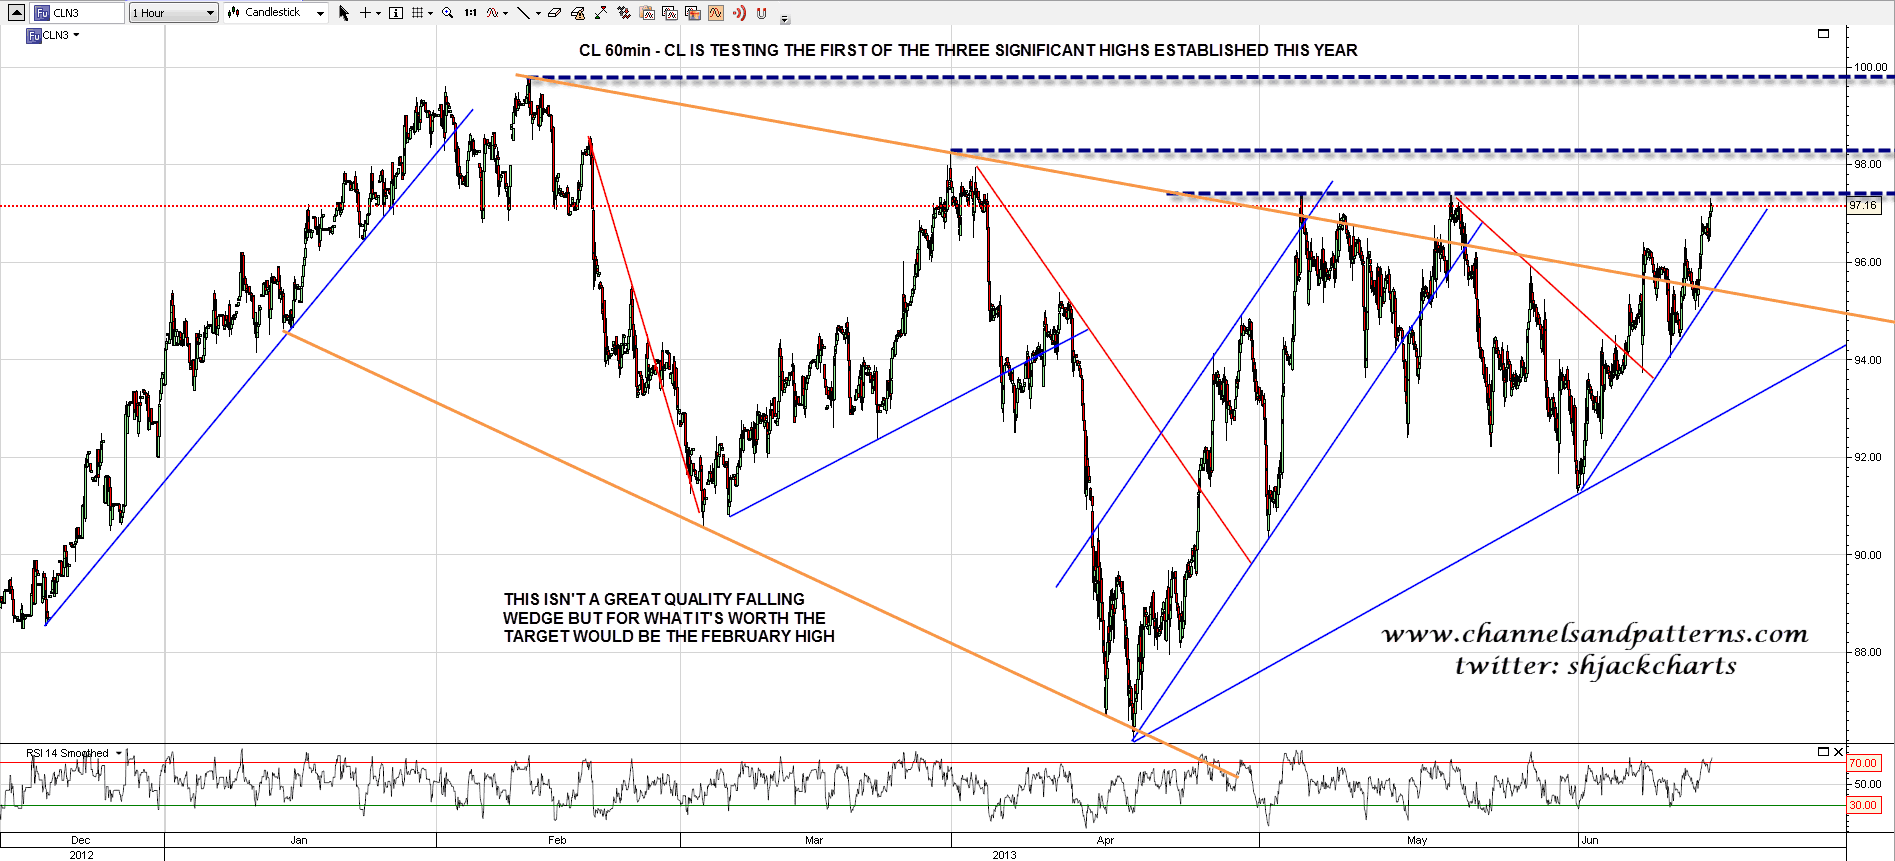
CL held support yesterday and is now testing the lowest of the three significant and declining highs made this year. Breaks over these will look increasingly bullish on the bigger picture. CL 60min chart:
The bears took a heavy technical beating yesterday and the advantage this morning is with the bulls. We may well retrace somewhat or consolidate today after yesterday’s very strong push up, but the next key resistance level is 1649 SPX and bulls will be looking for a strong push through this level in the next couple of days.
