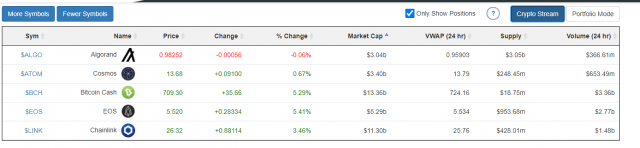
We’ve made some big improvements, so I wanted to review with you the CryptoStream page. It initially displays the largest symbols, but you can continue to increase the quantity shown by pressing the More Symbols button. The price data updates in real time, and the row highlights whenever there is a price change. You can also click the title of any of the columns to sort it by the values of that column. This is an easy way to instantly see the biggest gainers and losers of the day, for example.
Besides showing real-time quotes, CryptoStream is also useful if you want to keep track of your crypto portfolio. In many cases, it does a better job than the brokerages themselves. Just click the Portfolio Mode button, and you will be able to enter three items of information for any given crypto symbol:

- Quantity (which is accurate to 8 decimal places);
- Entry Price;
- Stop Price (optional) which will make the row highlighted if violated
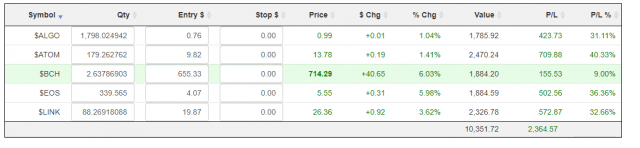
We can plainly see the value of each position, the profit/loss in dollar terms, the profit/loss in percentage terms, as well as relevant sums at the bottom.
If you are using the Portfolio feature, you probably will want to have the Only Show Positions box checked, since that will make all the symbols in which you have no position disappear. This makes for a very clean presentation, and this clarity will persist if you go back to the regular CryptoStream mode.
With your positions thus entered, the page will keep you updated second-by-second as to how your positions are doing, as opposed to your crypto brokerage site, which normally requires the clumsy pressing of the “refresh” key over and over just to smack the page into actually showing you recent prices.
The Columns in Portfolio
Here, in more detail, is a breakdown as to what each group of columns in Portfolio mode means.
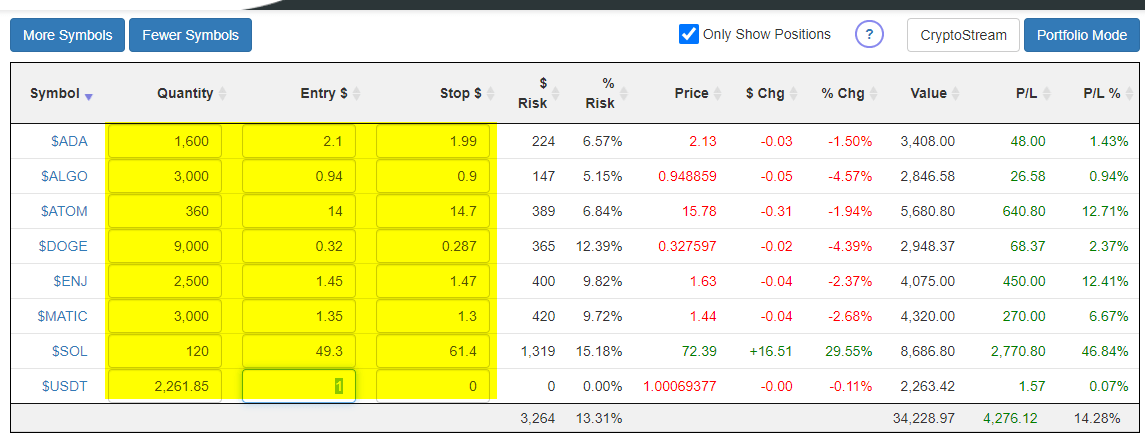
The first set, Quantity, Entry, and Stop, are the fields you enter. Quantity is the number of coins, Entry $ is the purchase price as measured in US dollars, and Stop $ is optional and defines what the stop-loss price is that you’ve set. This third field is especially helpful if you want to keep records of the stop-loss values you give to your brokerage. If the trade price reaches this level or below, then the entire row will be highlighted to draw your attention to the fact that the price has sunk to your stop-loss level.
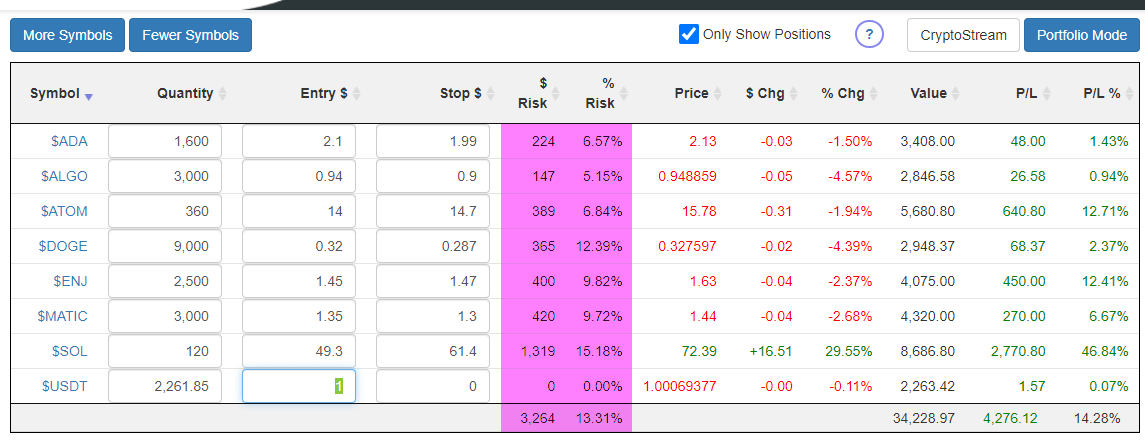
The next two columns, $ Risk and % Risk, only display information is there is a Stop $ entered. These are calculations of the amount of dollars at risk (and the percentage equivalent) between the present valuation of the position and the valuation at the stop-loss level. As a simple example, if you owned 1,000 coins at $10, and the stop-loss price was $9, then the $ Risk would be $1,000 ($1 times 1,000) and the % Risk would be 10% ($1,000 versus the $10,000 present valuation).
The next three columns are the price of the coin, the change in dollar terms, and the change in percentage terms.

The Value is the total value of that particularly coin based on the latest price.

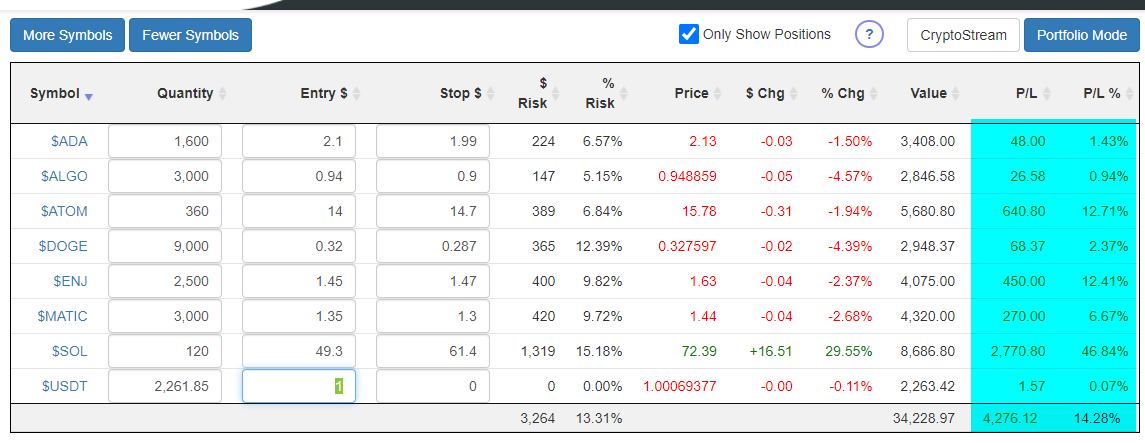
Finally, the P/L shows the dollar-based profit or loss, while the P/L % shows the same information in percentage terms.
It all comes together in a package which gives you a clean view into both the crypto market and your own portfolio in particular.