
I had my final divorce hearing this week and that is settled and done. It was a strange sight, lawyers really do strain at gnats and swallow camels. I do wonder how often anything resembling justice is seen in these places and whether, if seen, it happens by chance. I’m glad to be done with it and plan never to return.
In my last post I was laying out the obvious options for this week, and we saw the confirming close below the daily middle band, SPX did go down to the 4120 area as I suggested would be ideal if an H&S was to form and we saw the rally in the last two days that may have largely formed the right shoulder on that possible H&S.
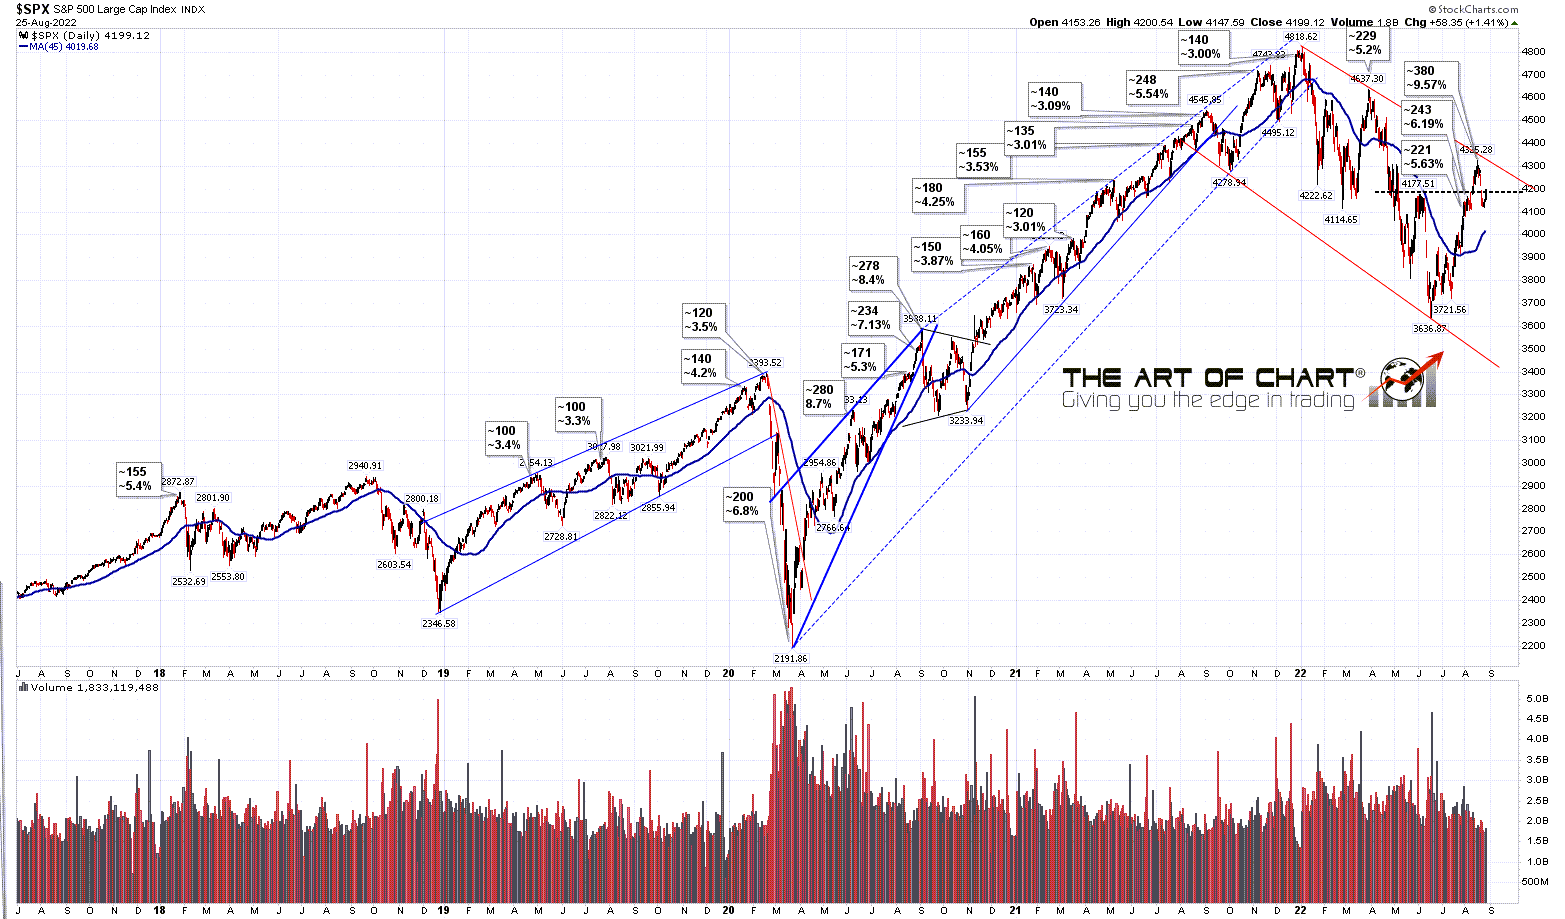
On the 45dma chart I’m expecting to see at least a near miss of the 45dma on this retracement, so it is unlikely to complete here and wherever this current rally goes it is likely to be forming a topping pattern to go lower.
SPX daily 45dma chart:
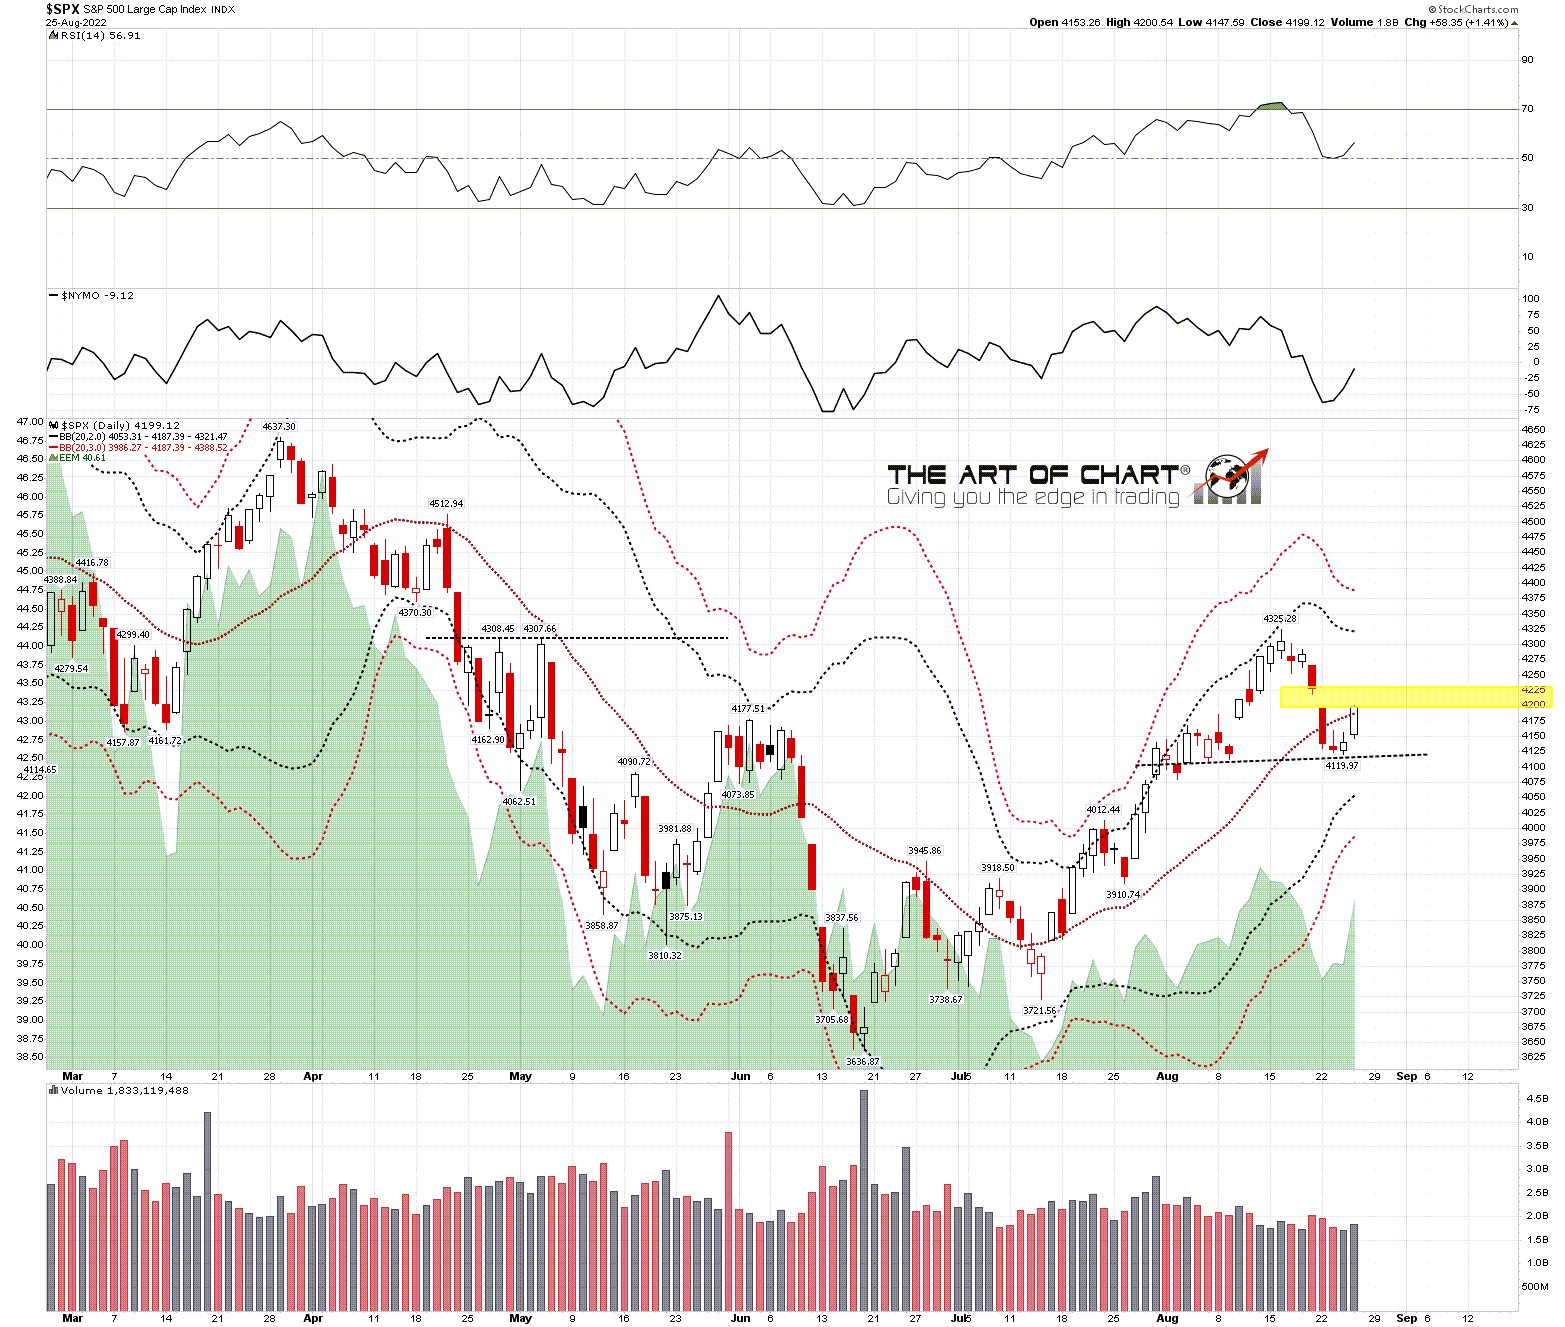
SPX broke back above the daily middle band, currently at 4187 at the close yesterday. That is inviting a possible rejection back below today. If seen that would be bearish and favor the H&S scenario. If we see a close back above today that is modestly bullish, but mainly here I’m watching the 5dma here.
SPX daily BBs chart:
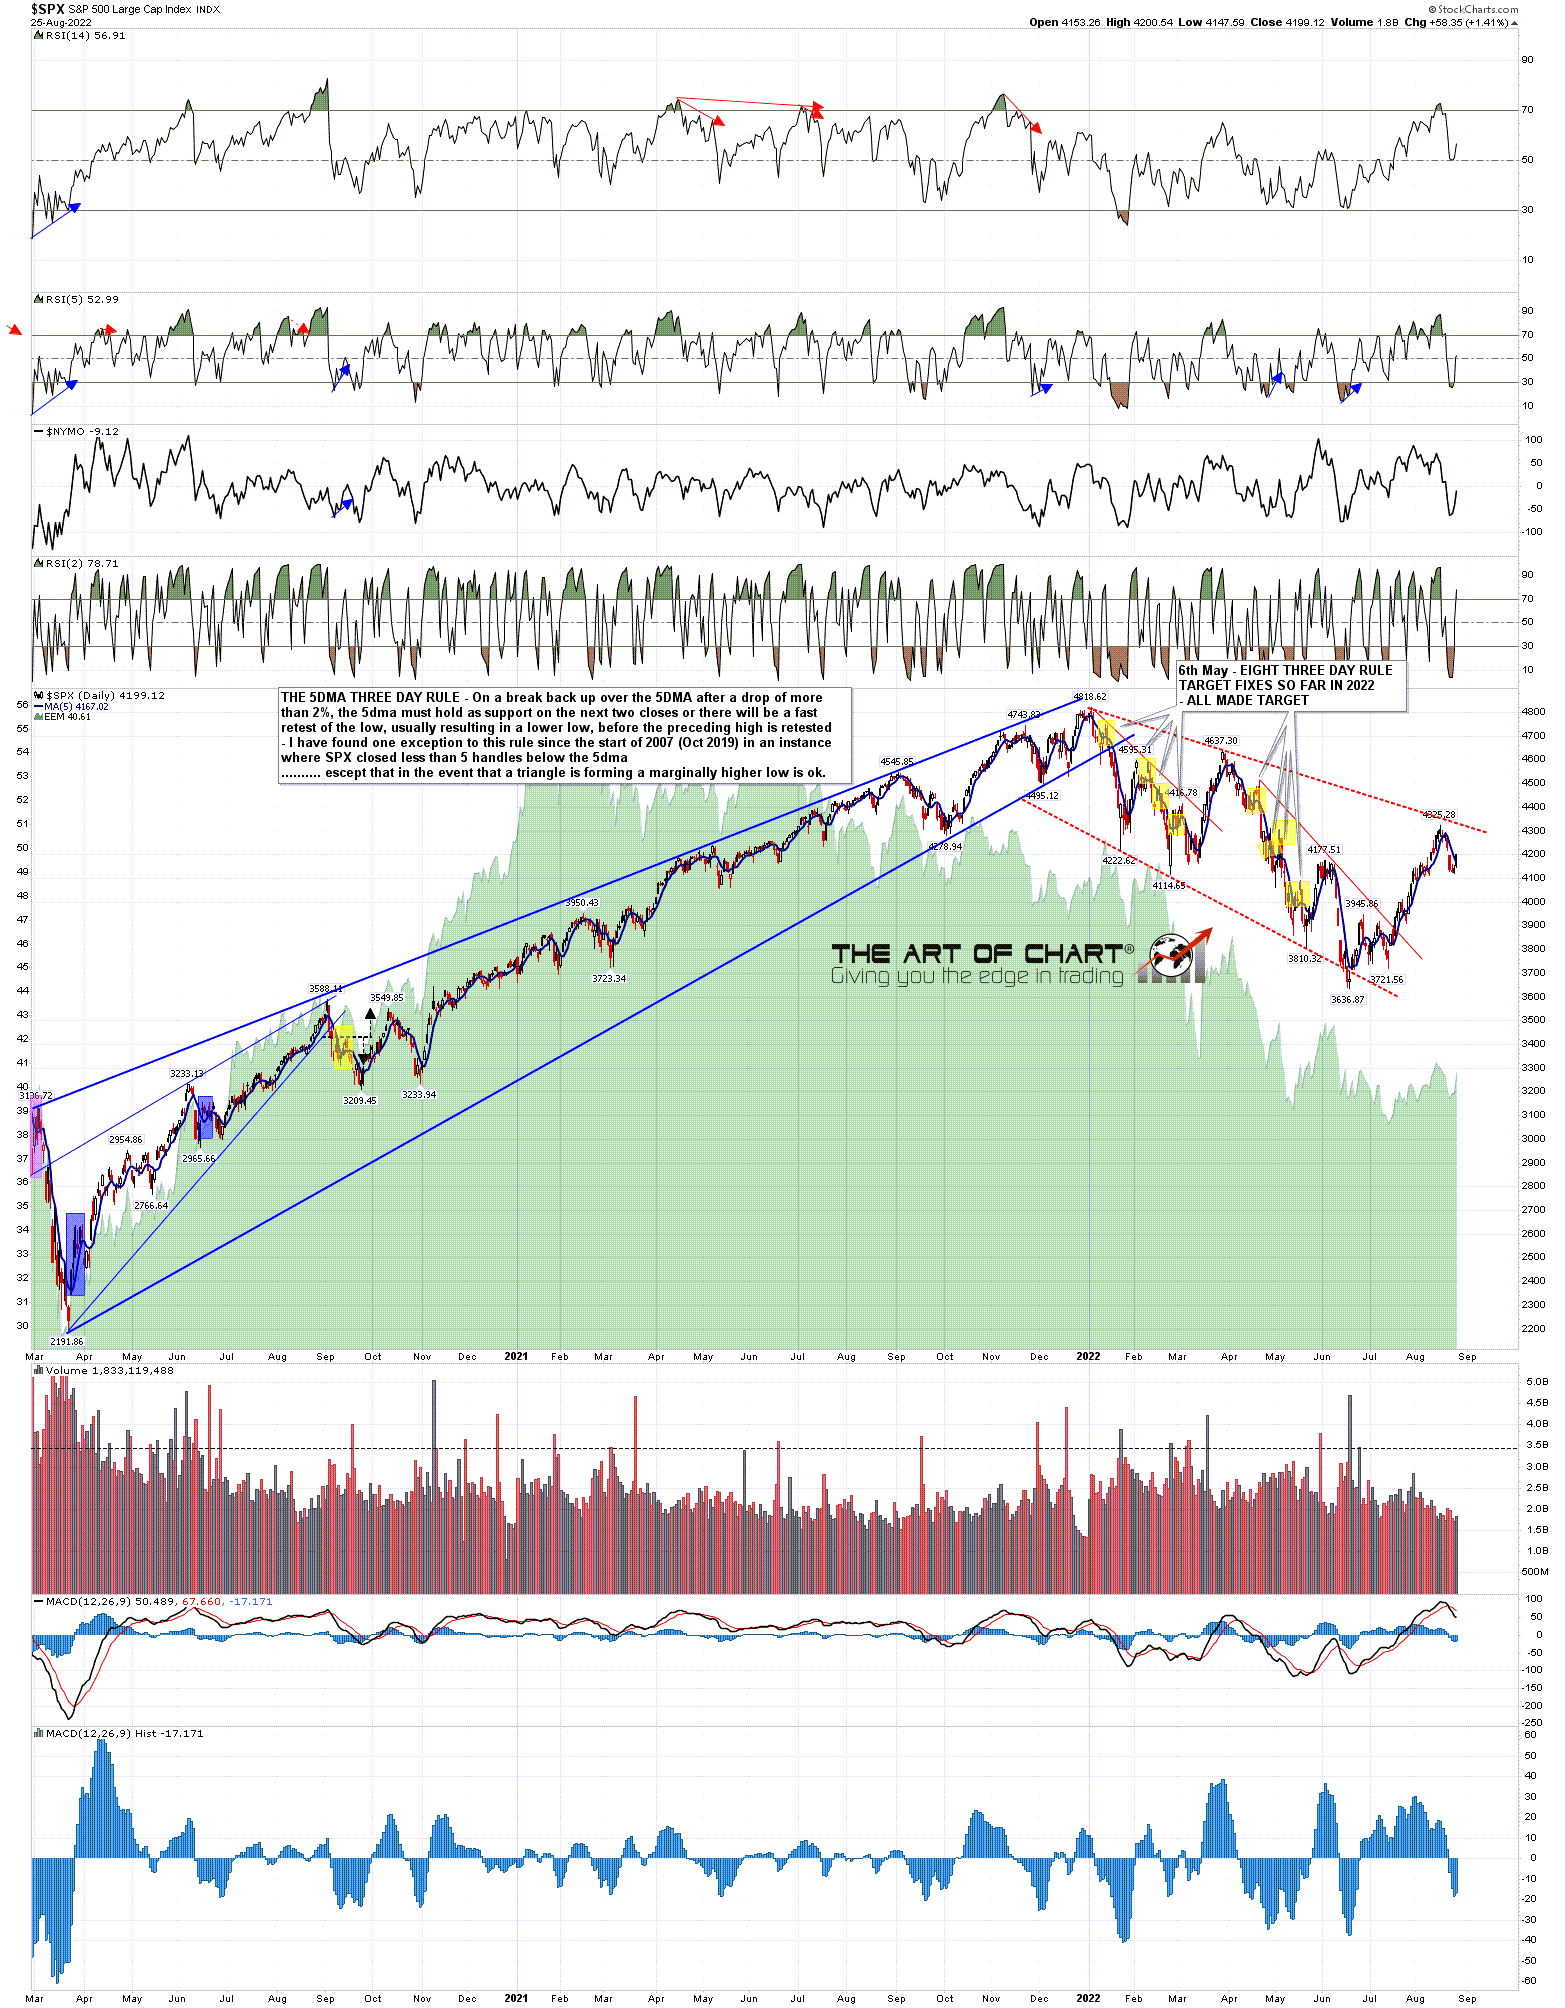
On the SPX 5dma, currently at 4167, we also saw a closing break back above yesterday, and as the decline into 4119 was over 2% from the rally high, that puts SPX back on the Three Day Rule. That rule states that if SPX delivers a clear break back below the 5dma on the second or third day, so today or Monday, then the prior low at 4119 will be retested. This rule has fixed and delivered eight times so far in 2022 and is VERY reliable. If the low at 4119 is retested then the H&S will have completed and started to break down.
SPX 5dma chart:
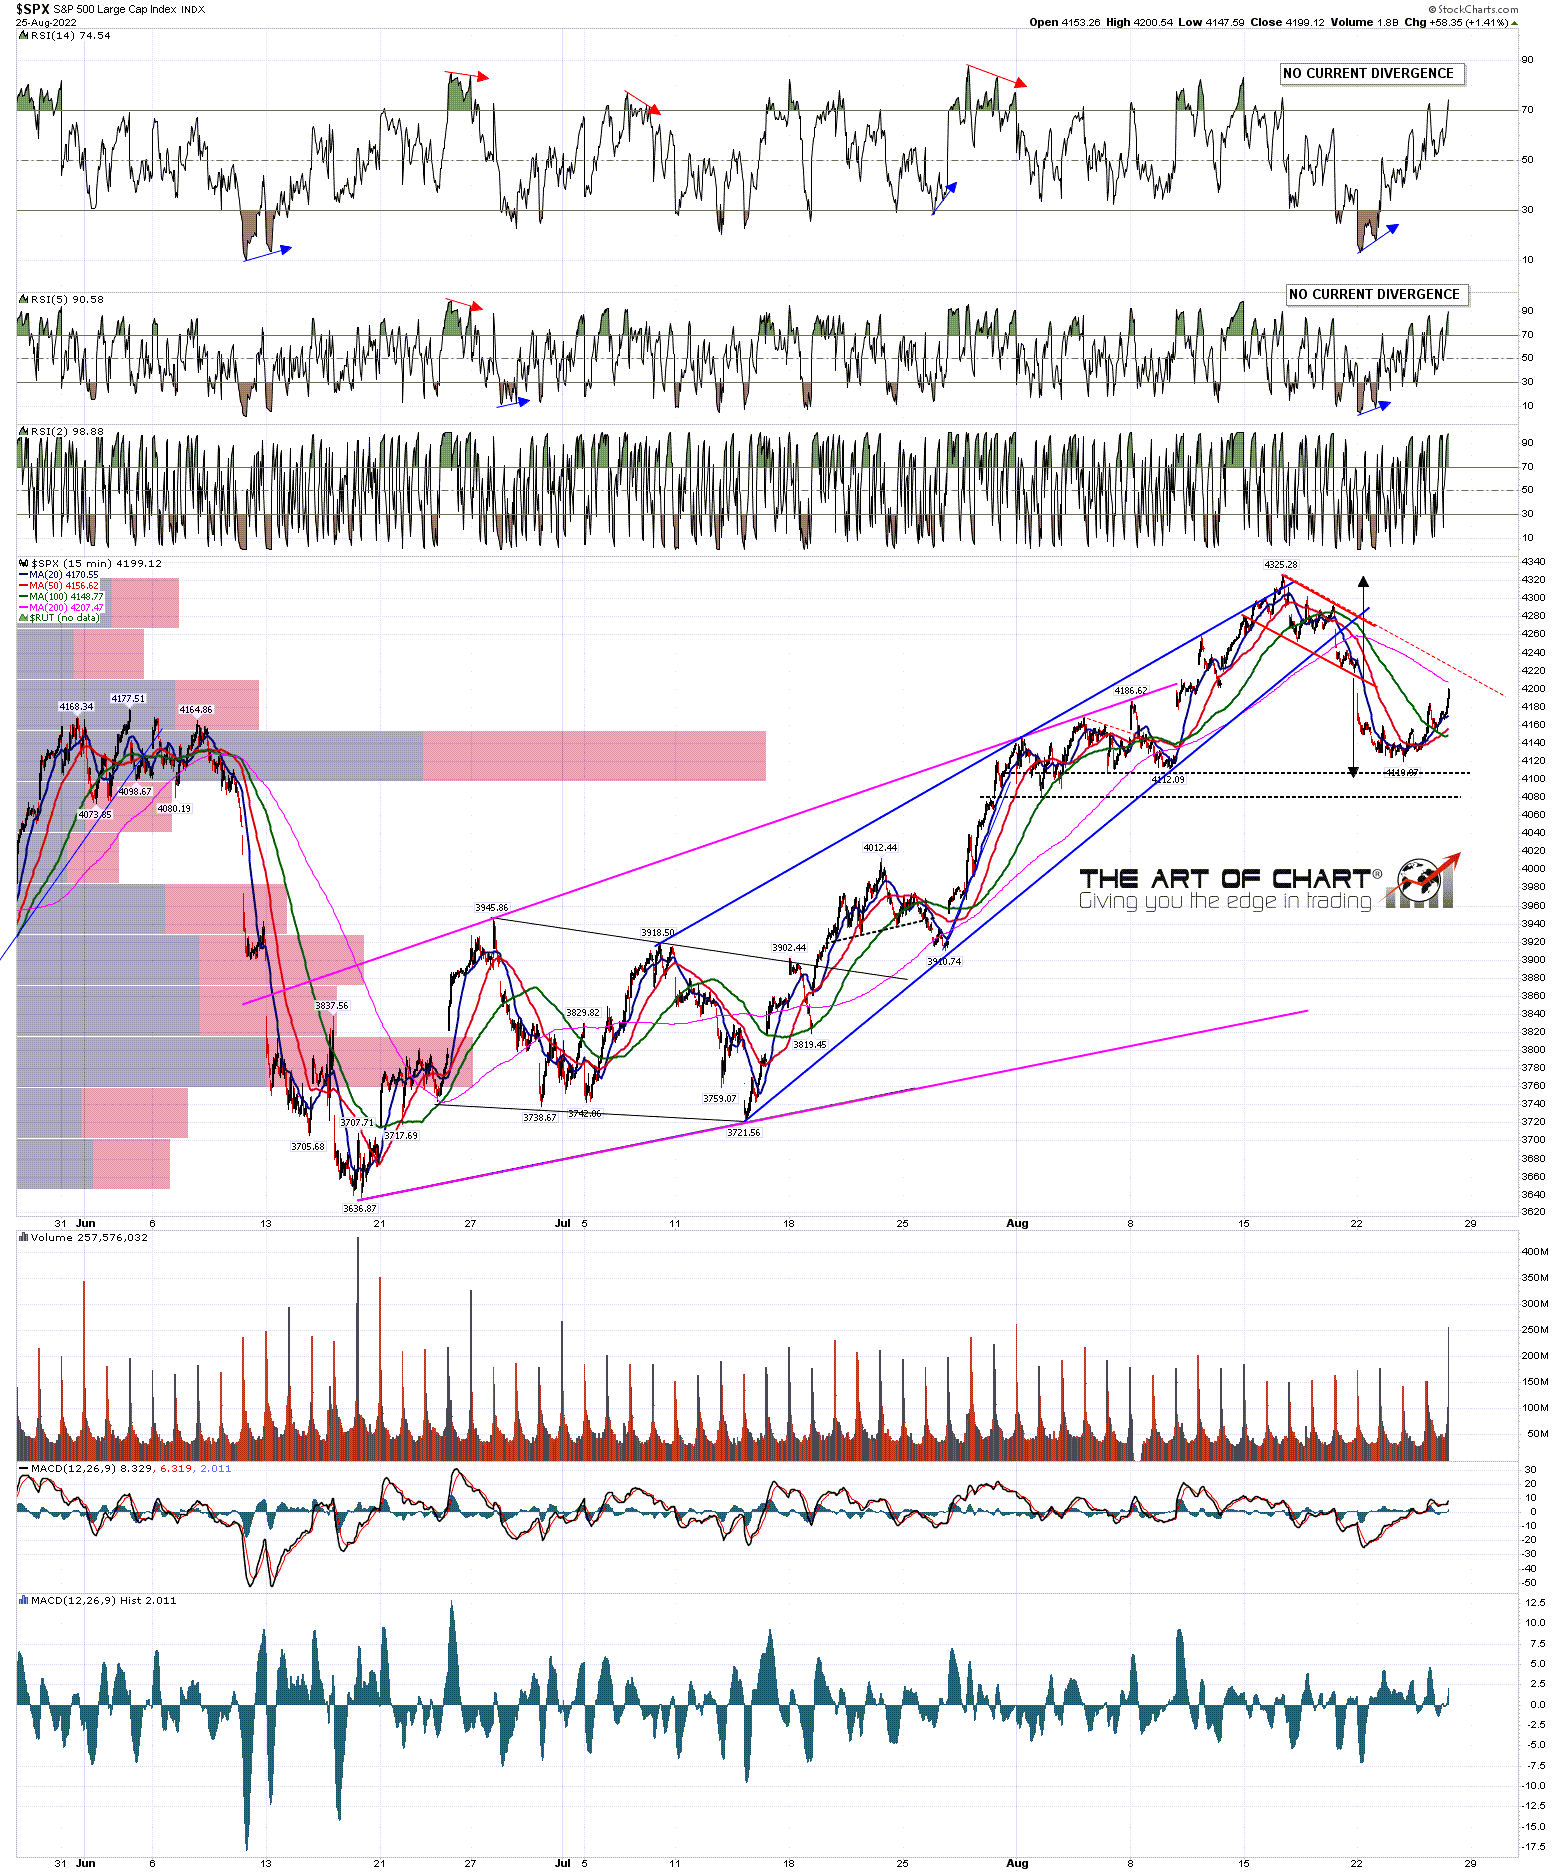
Possible H&S patterns are forming on all of SPX, NDX, IWM and Dow, though the Dow version is lower quality. A sustained break below 4119 on SPX would look for an H&S target in the 3920 area.
SPX 15min chart:
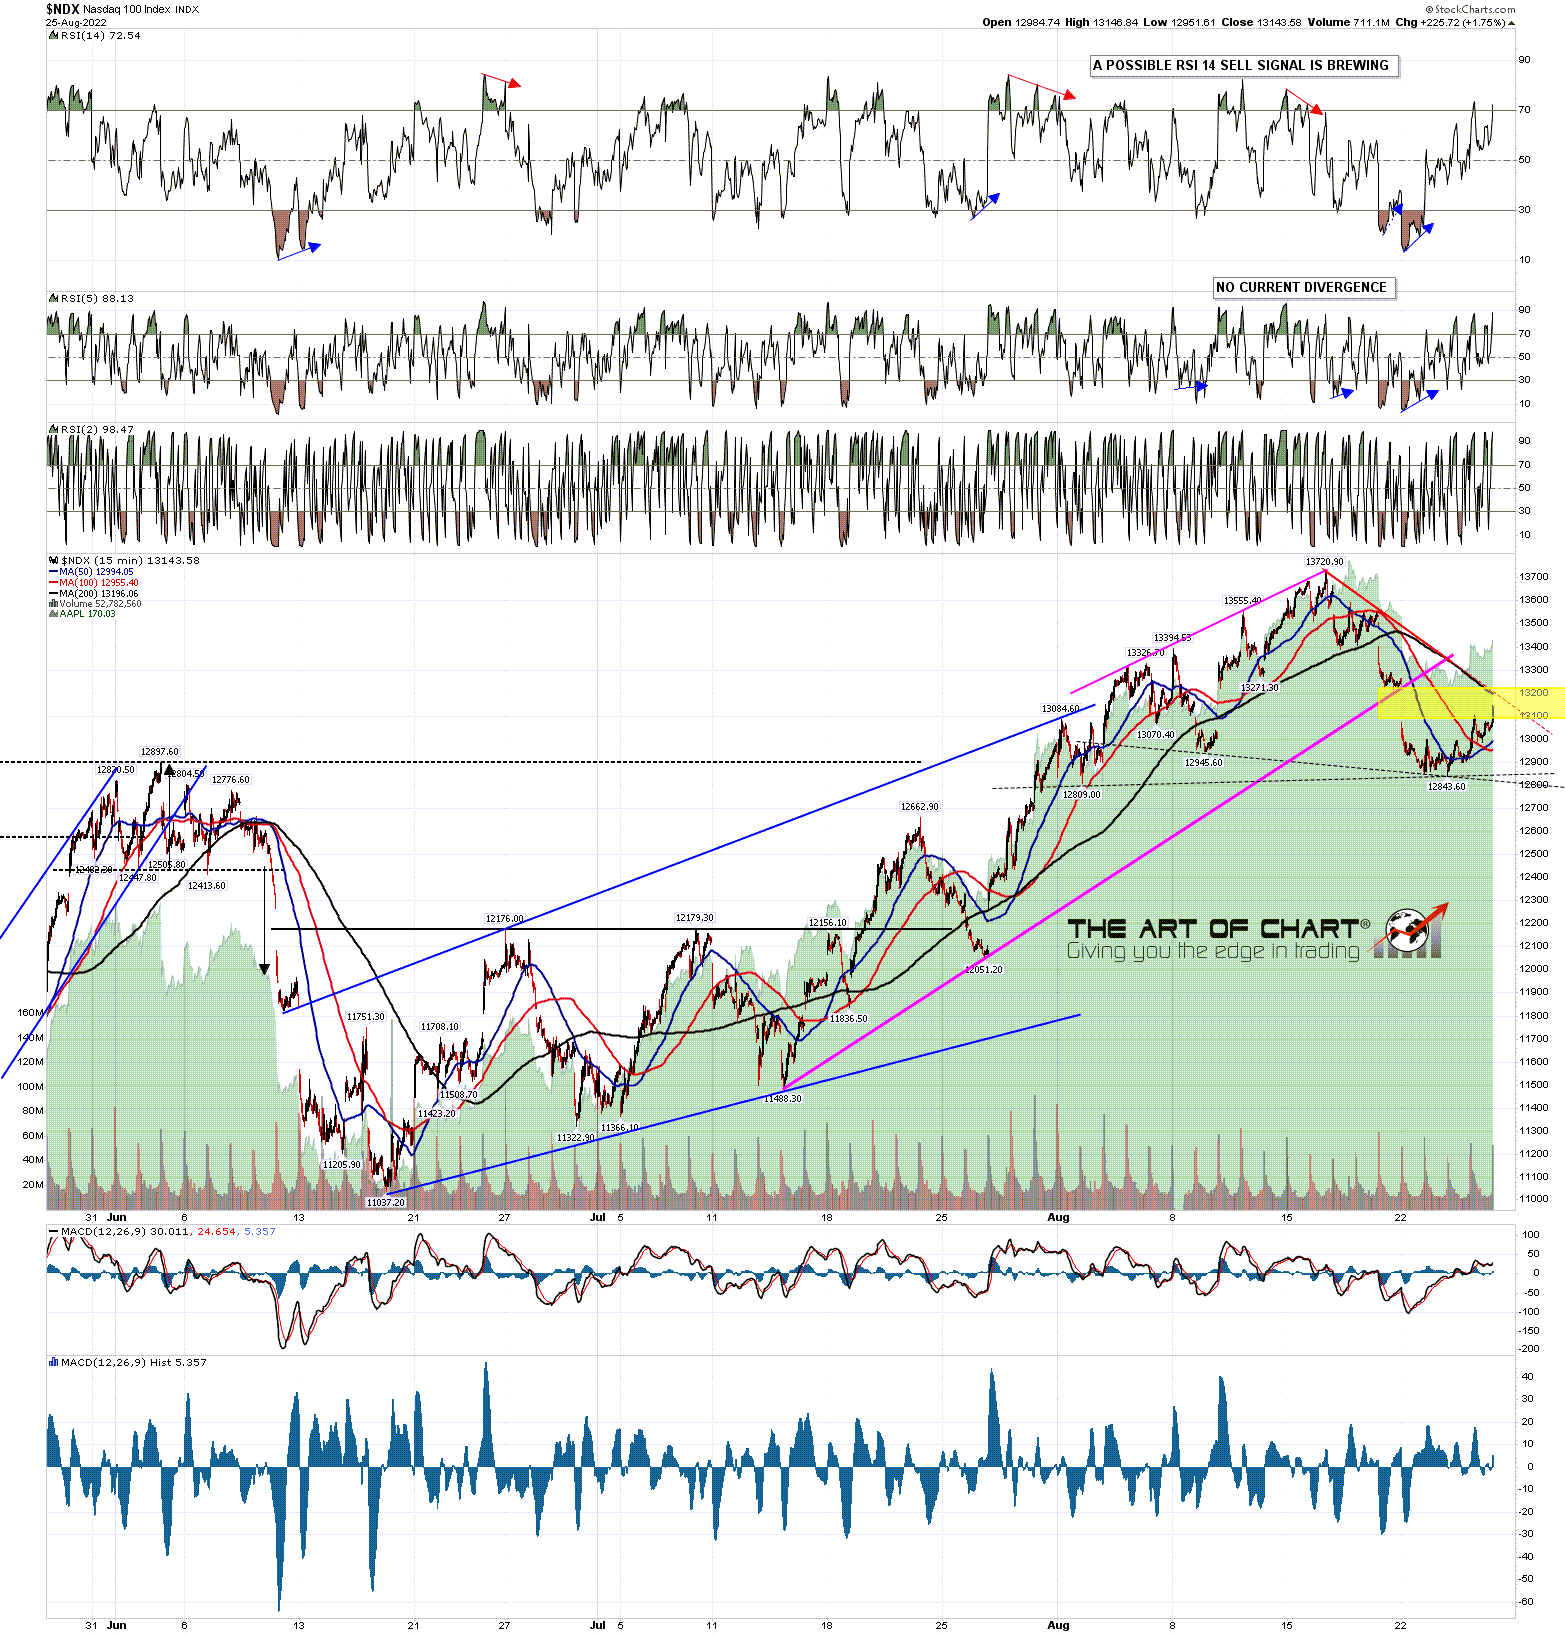
There are two possible H&S necklines on NDX, and I will be choosing which to use depending on the height of the right shoulder, but it will be a decent quality pattern either way.
NDX 15min chart:
I’m leaning towards the H&S scenario here, but it wouldn’t take a lot to change that. A fill of the breakaway gap on SPX from 4228.48 would be bullish. A conversion of the daily band back to support and two daily closes above it would also be bullish. If SPX can do that the odds of a retest of the rally high at 4325.28 will increase considerably though, if seen, I’d expect that to be the second high of a double top.
My next post will be on Monday or Tuesday before the open. Everyone have a great weekend.
