Well, I am trying to look at the indices as unbiasedly as possible, simply looking at technicals and things don’t look good for bears. I’m sure this comes with a “well duh” response, but it doesn’t hurt to look at the charts and say the obvious out loud.
But I am more concerned now as I am trying to add a behavioral profile to the market while watching the action lately and we are in the midst of climbing this wall of worry which (when in the thick of it) seems to have no end. So how do we plan for possible turns? I certainly can’t profit by holding shorts throughout this rally (from an index perspective). At best, this is a stock picker’s market to find decent shorts to ride down while riding the broad indices up. But here is what concerns me the most:
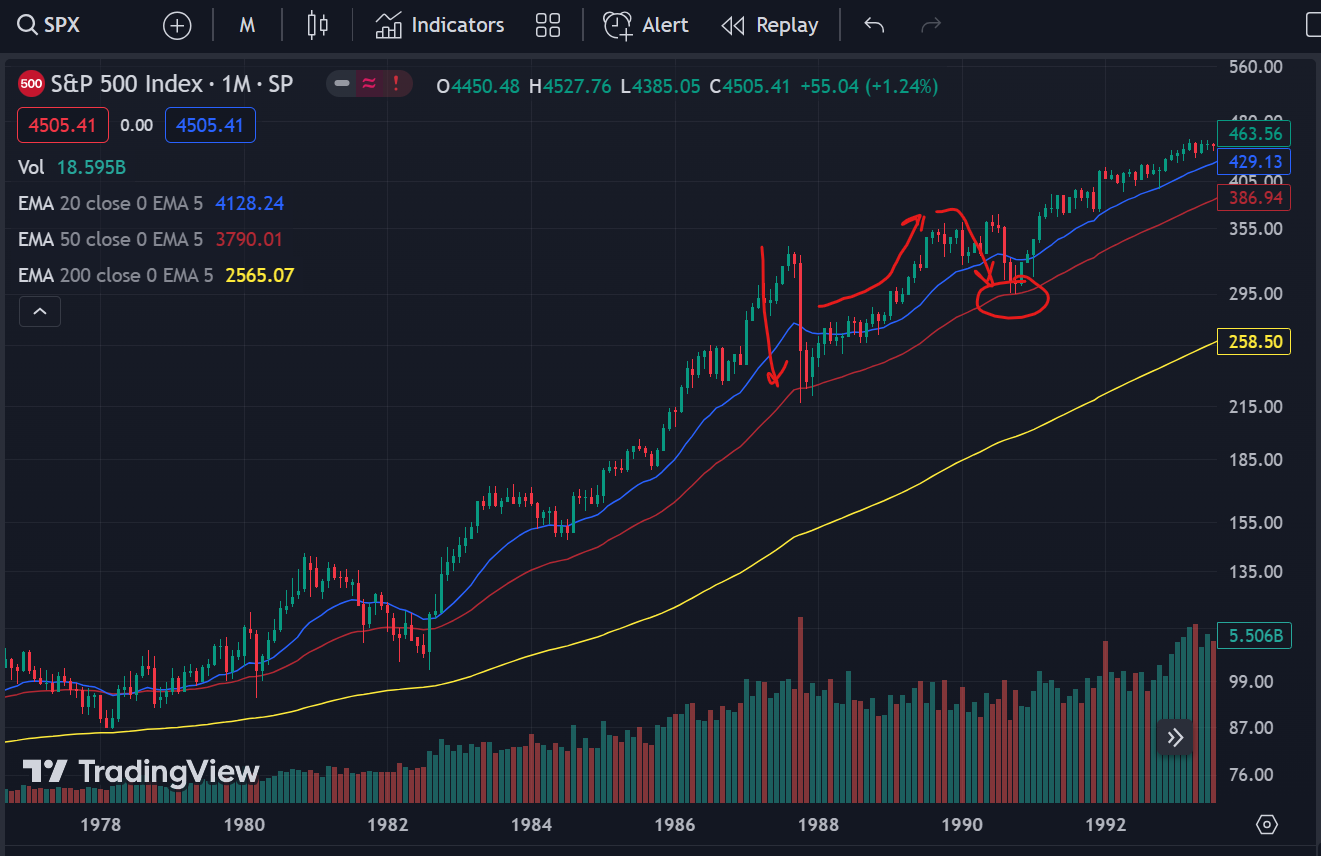
Here is a chart of the S&P500 during the 80’s. I specifically marked the ’87 crash and highlighted the action in the months following.
First, what led to the crash was a massive overleveraging of the investors in the futures markets (this statement of ten words is an incredible simplification, but you get the idea). After the crash, the market felt an incredible bearish sentiment and felt, like I imagine I would have at the time, like a new potential drop was ready at any moment to hit the market, much like the great depression (look at S&P500 chart after the first dead cat bounce).
So instead, the market climbed slowly, just drifting higher up this “wall of worry”, trading with then pulling up away from the 20-Month moving average (blue line). And again, everyone was waiting for the market to turn. Then the index started hitting new highs in a matter of months! After hitting those new highs, however, we actually traded sideways and stabilized and actually turned back down, finding a base at the 50 Month moving average yet again. Which brings me to today’s S&P500 chart:
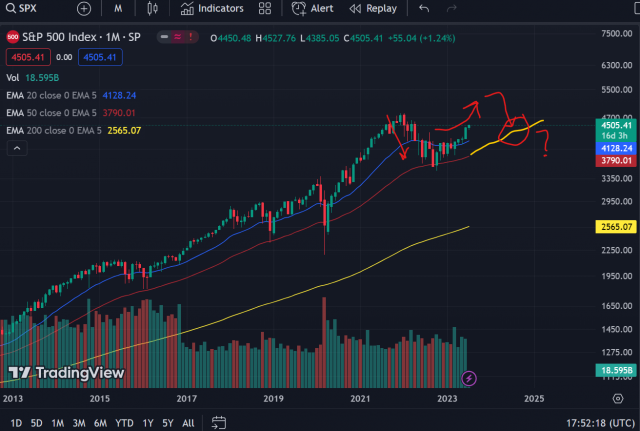
This is the action we see today, with similar markups. The downward move was not as sudden as 1987. That was a 20% crash in a single day, it took us nine months to do the same damage this time around. We again found support at the 50 Month moving average. And again, we had been trading underneath and just along with the 20 Month moving average. And again, the sentiment is downtrodden (I wouldn’t say bearish) with a continued concern of “a market drop is just around the corner”. The reasons for this potential market drop are nonetheless very real, but the stock market often does not immediately reflect reality.
So why am I concerned? Well, I believe the market turn is very much “right around the corner”, but which corner? How far can this market rally before it actually does manage to drop? It feels like we will need to hit those new highs in the indices so we feel the cheering of bulls that the next bull market is here (Yippee hooray!) at which time that irrational exuberance will finally find its turning point and we can see something of a significant drop. However, any significant drop will have to test that 50 month moving average again and that will be the true test. It could find a base there, like it did in 1990 or it could finally break down.
To give numbers to this melt-up scenario, if the market continued up in similar fashion to the 1987 crash low, then we could see 5200-5300 on S&P500 before stabilizing and hopefully reversing. If we do manage to turn back down, the 50 Month Moving Average should be somewhere around 4200 or so. After that, who knows? All I can say is, given this potential path of the market, it looks like us bears will continue to get tea-bagged by the bulls for the near future.