
At the risk of being melodramatic, I am going to begin this post with a plea for decency. All right, “decency” might be a bit dramatic after all, but to come right to the point, I’d like to ask regular users of the site who aren’t yet members to seriously consider signing up for a Bronze account. Like……..now.
I want to make this as tempting as possible, because I’m serious about this. Click here, and your membership is all of ninety-nine cents for the first month and, if you decide to stay with it, permanently discounted by 25% thereafter (14.95 instead of 19.95). It honestly isn’t about the money (well, maybe 1% of it is). It means a lot to me to bump the subscription numbers higher. And, in my sincere opinion, it’s the right thing to do.
Having spent over 18 years building up the Slope of Hope, I am very proud of it, but that pride prevents me from slathering the site with paid advertisements. Added to this, my respect for my readers is too great for me to sell their email addresses (which I’ve been offered to do countless times).
Thus, my livelihood depends on people who use the site regularly to step up and spend, at a minimum, a few cents a day to compensate me for my hard work 365 days a year. And keep in mind, this needn’t be done out of pity. The Bronze membership has dozens of excellent features.
I won’t browbeat you about it, but I’m asking you to do this from a place of respect and humility. Here’s that link again. Thank you.
And while I’m dishing out gratitude, I also want to thank all my current Bronze, Silver, Gold, and Platinum members for making this place possible!
Now, on to the charts…………
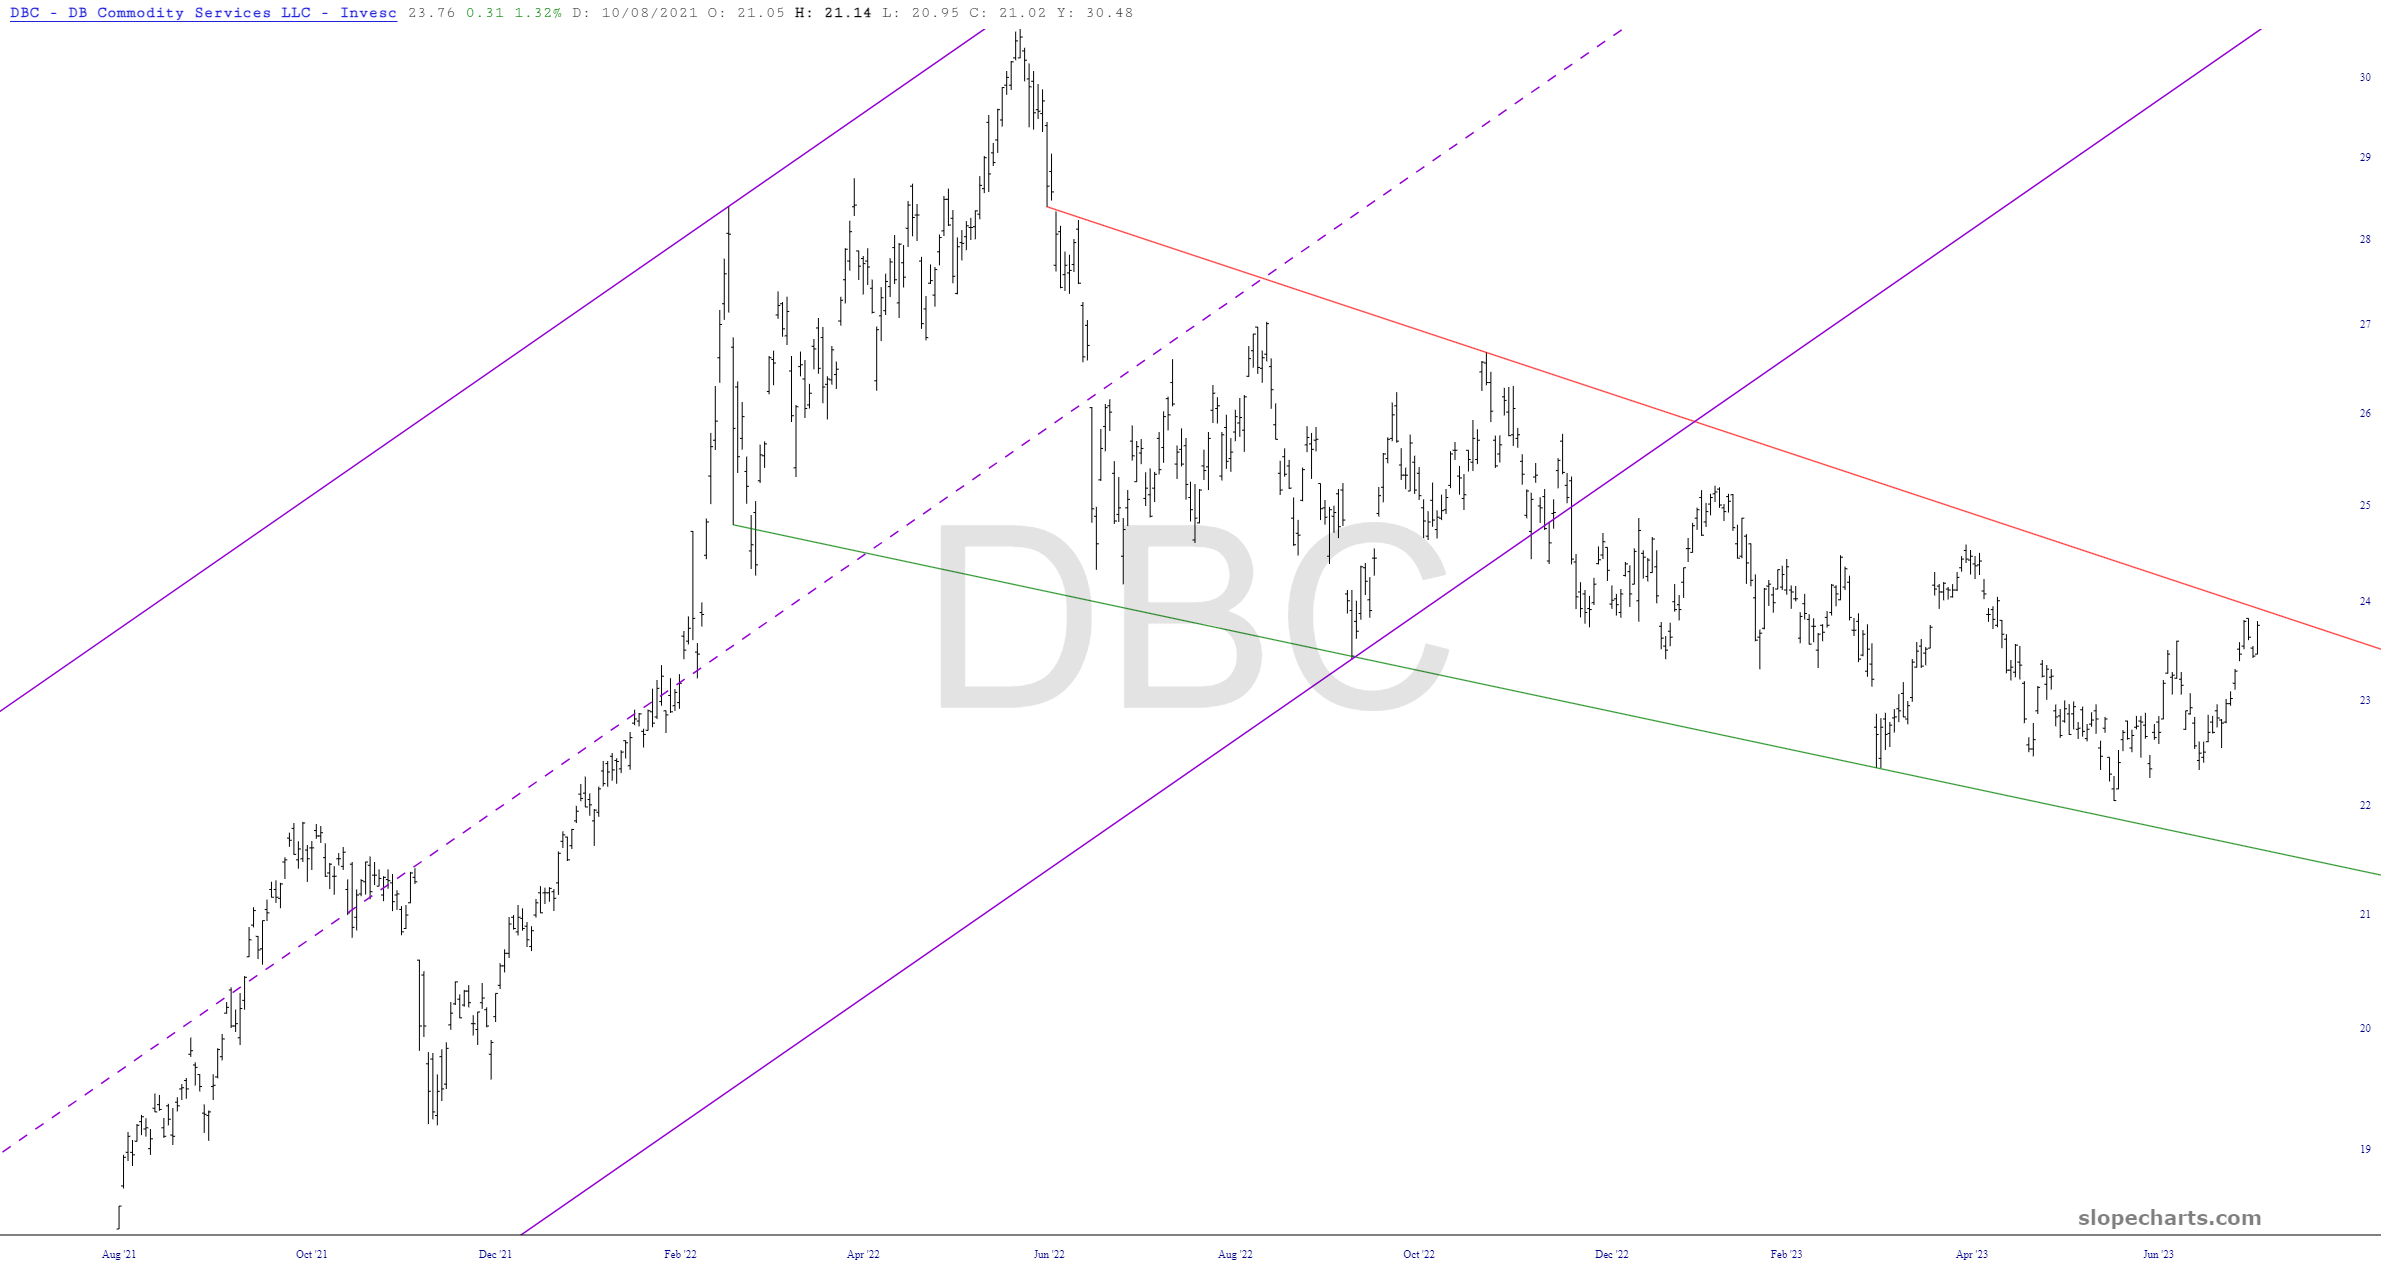
Commodities continue to slip ‘n’ slide lower, although it’s not out of the question they could bust above that resistance line. Lord knows there have been plenty of patterns busted to the upside this year. It hasn’t happened yet, though, so it currently remains in a (very slow) bearish downtrend.
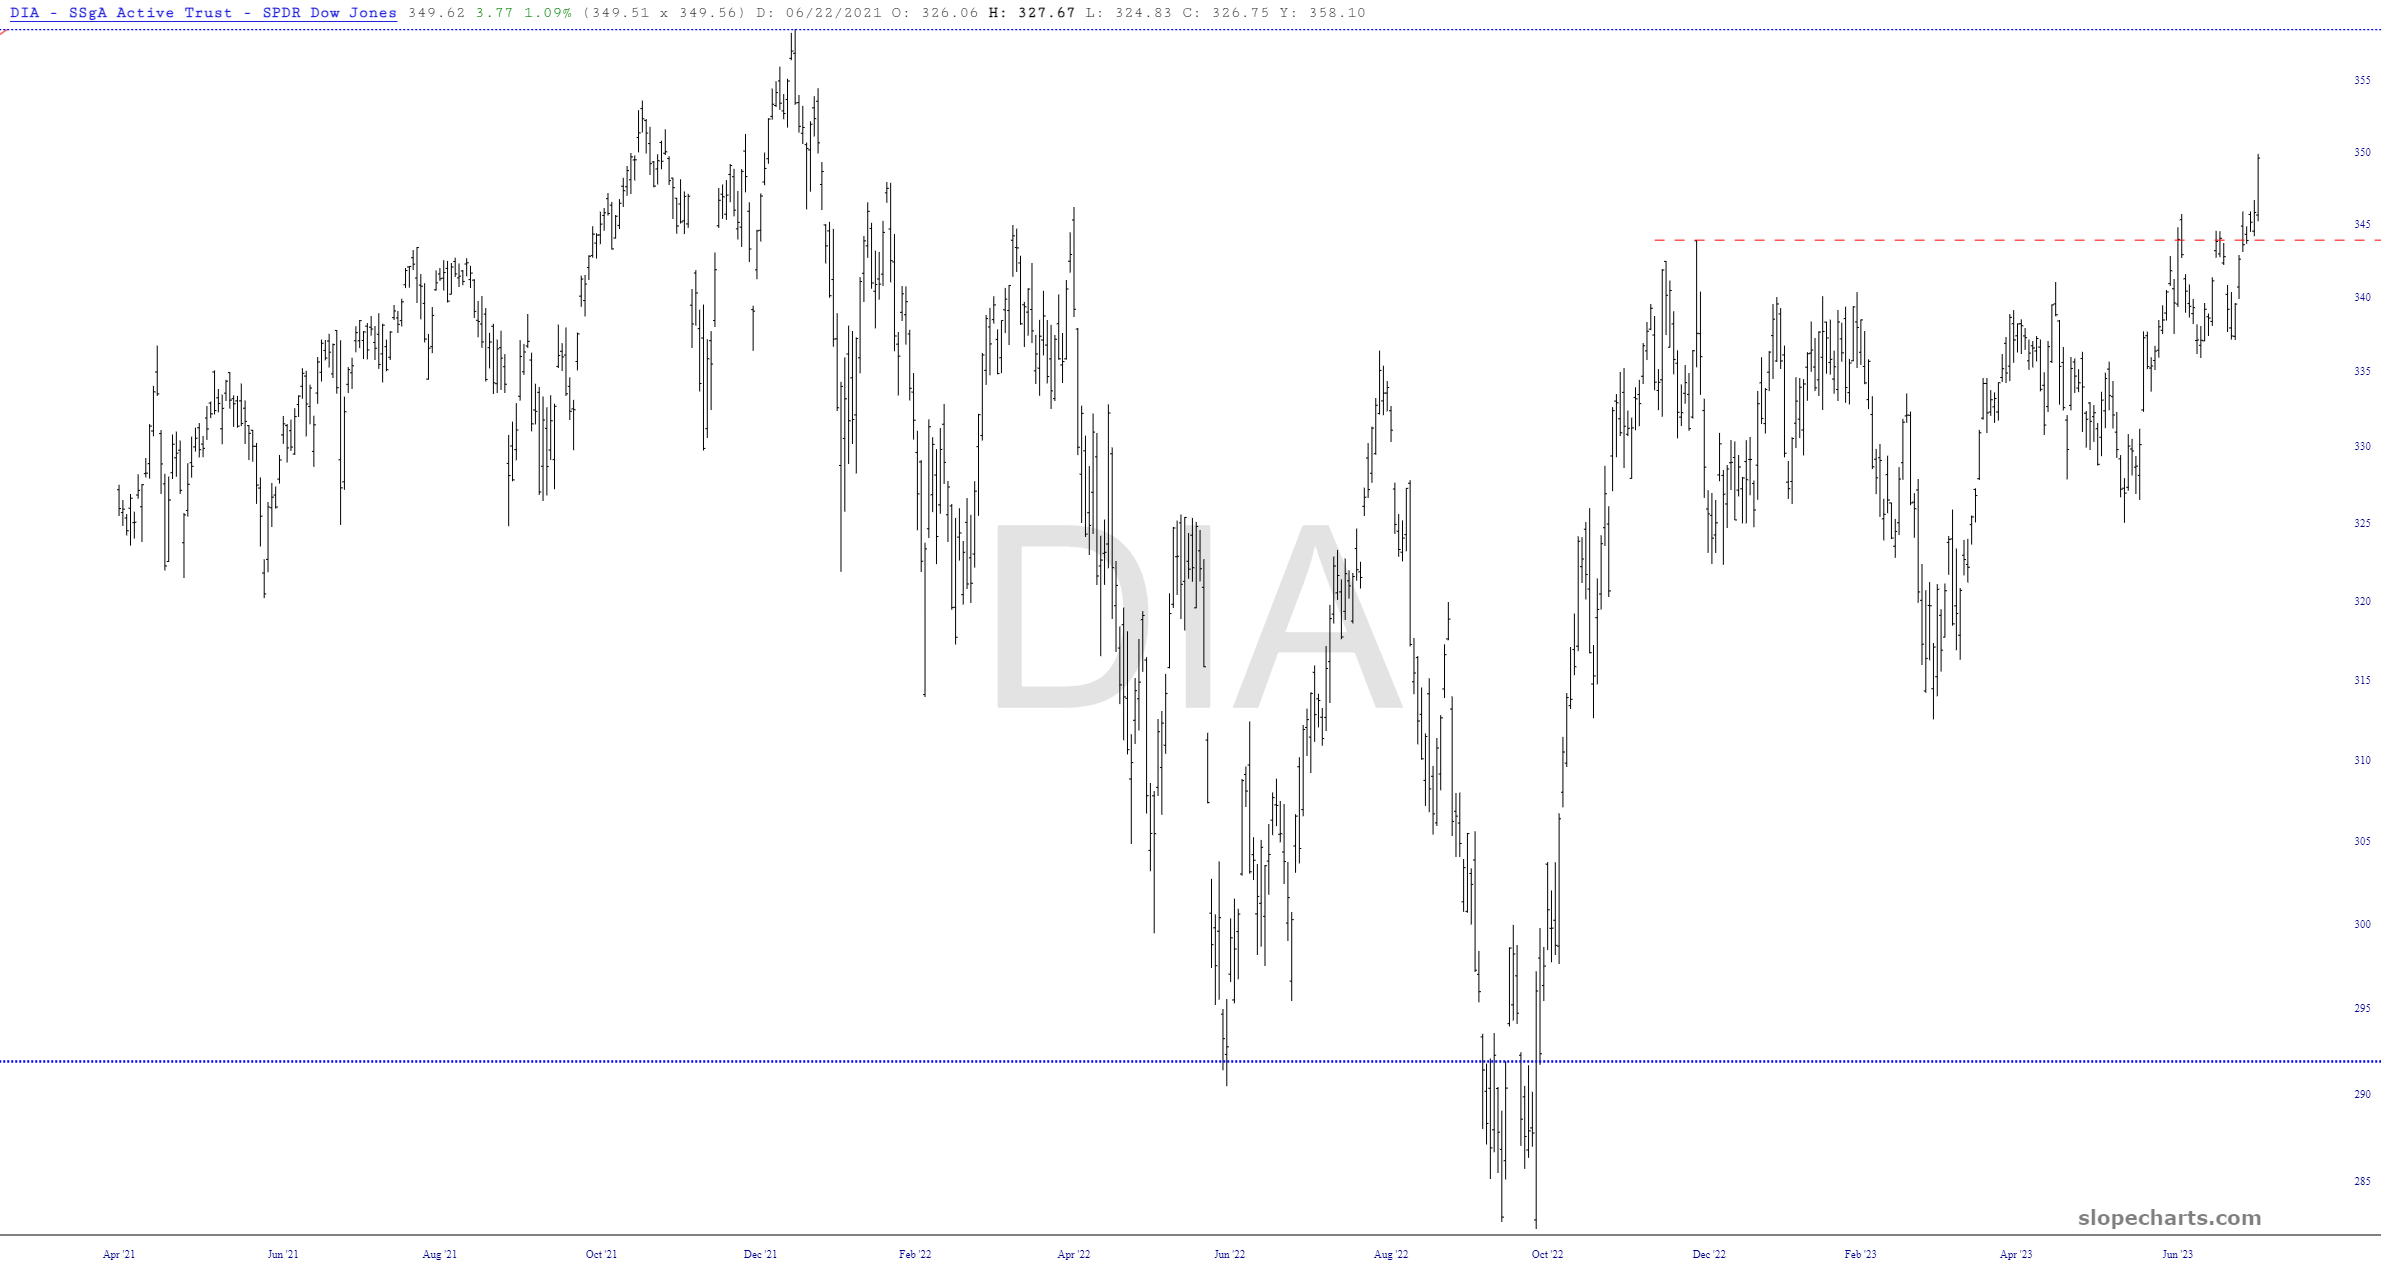
The Dow Industrials “diamonds” fund burst above its completed inverted H&S pattern and is threatening to make a new lifetime high. DIA is much closer to a lifetime high than the $INDU itself, because this instrument takes into accounts dividends that have been paid out, which are substantial.
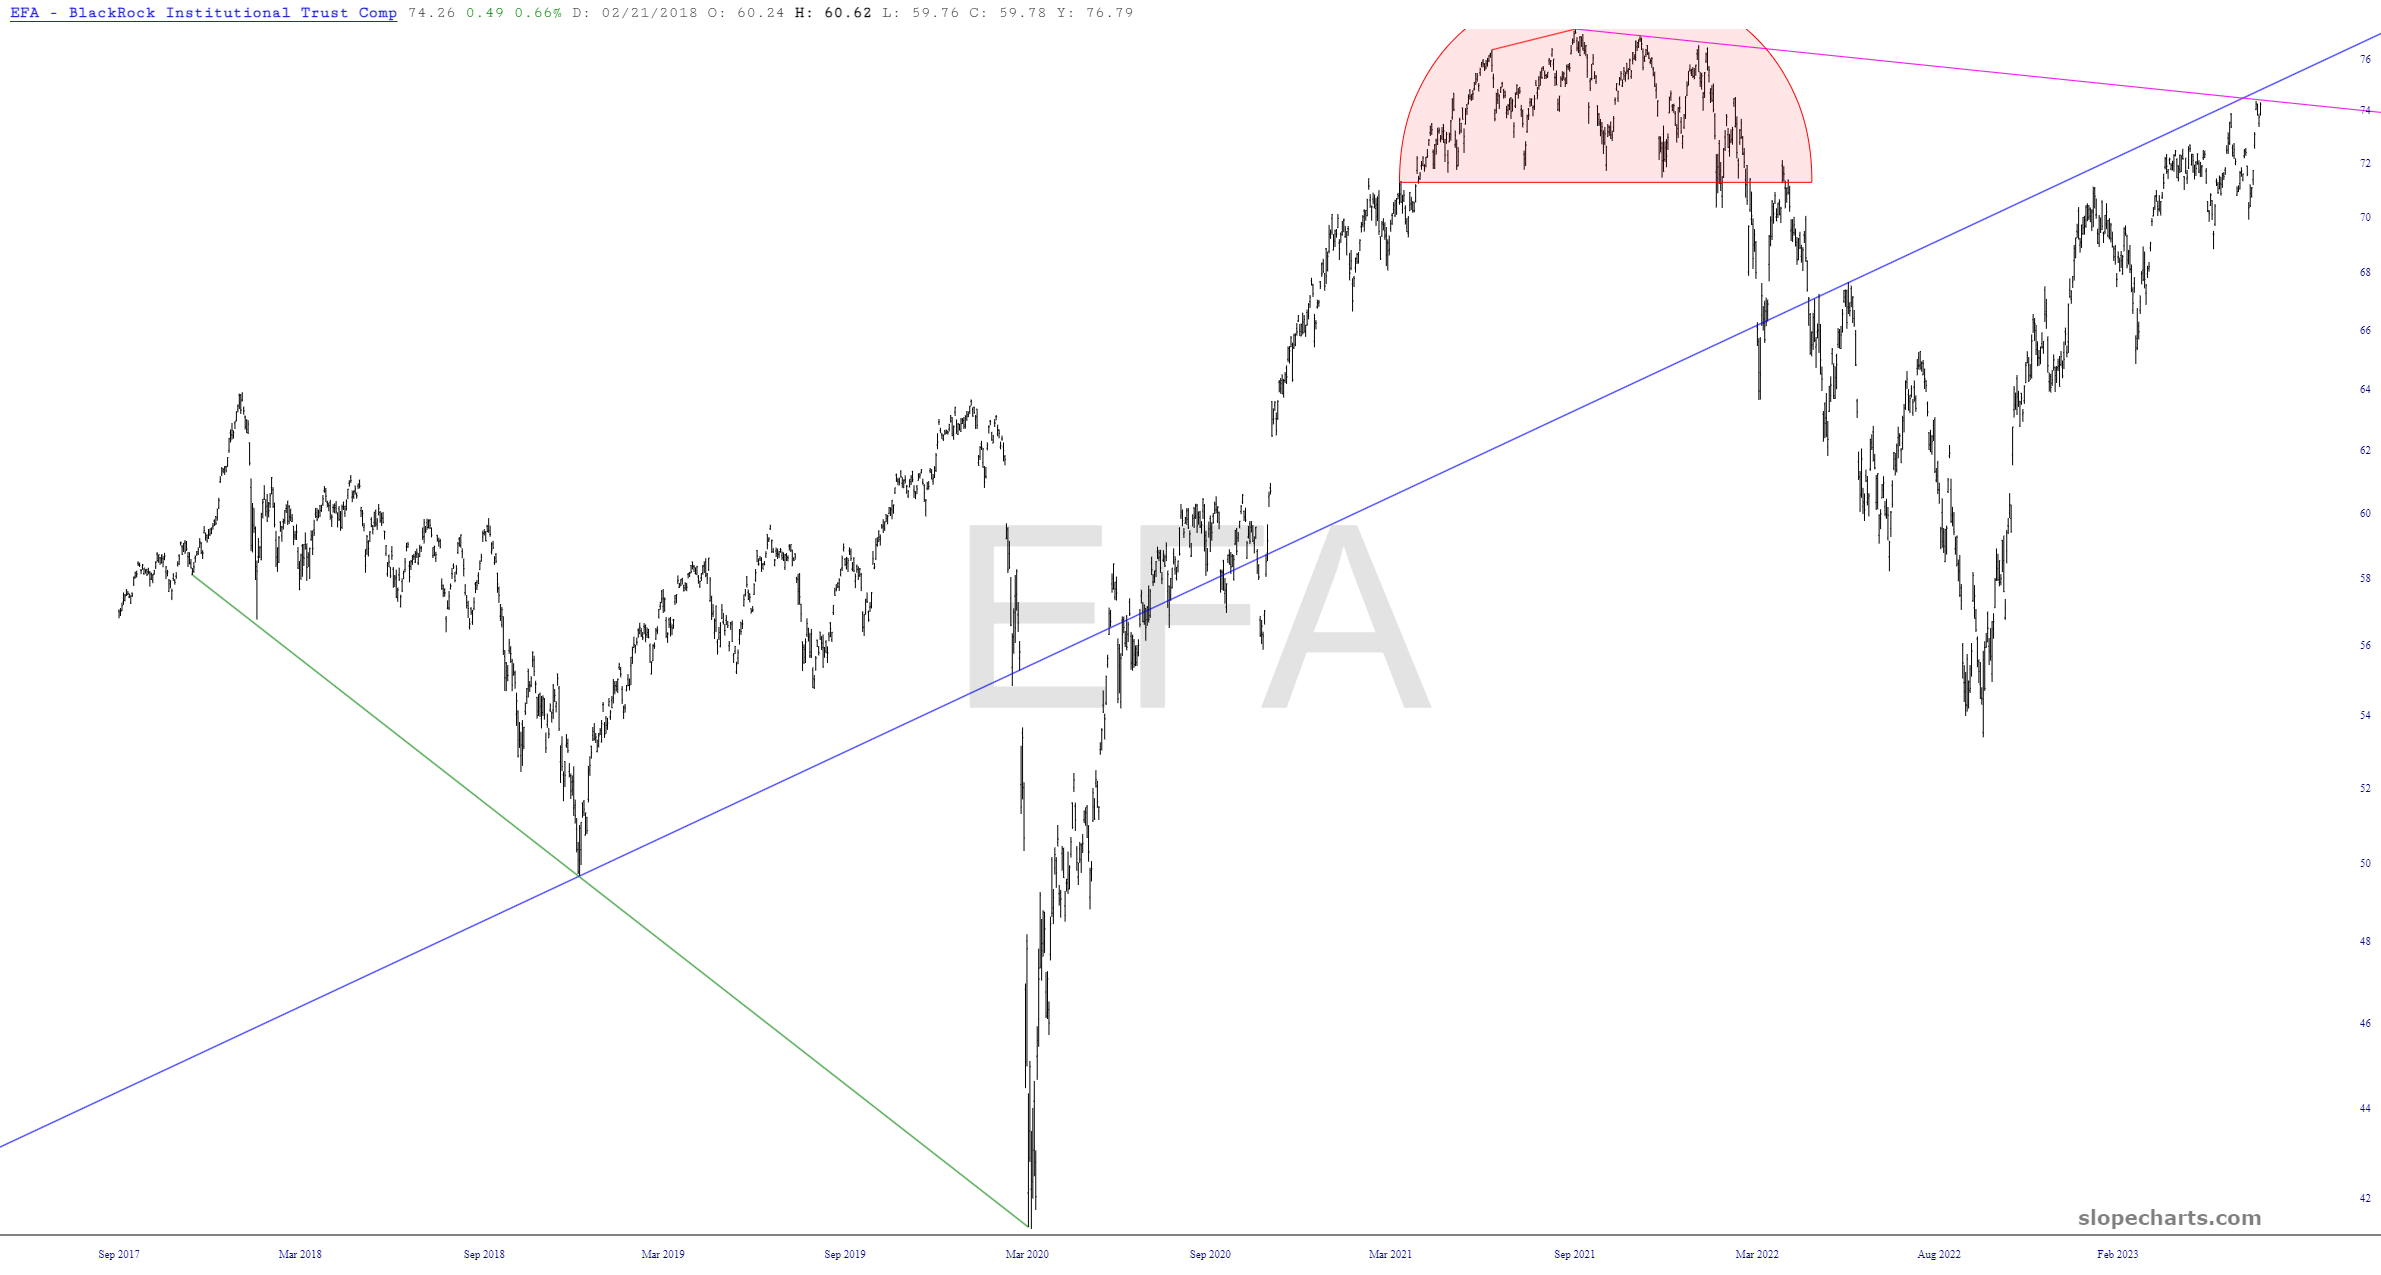
Presently, I have January 2024 puts on only two ETFs: EFA and XLU. The first of these, EFA, is mashed right up against two powerful trendlines: the first of these is the lifelong trendline which was broken by the Covid crash and the 2022 bear market. My view is that this line has changed from support to resistance. The second line is the one at the top, which represents the resist-and-reverse point of prior price peaks. Let’s just say I am crossing everything I’ve got two of that this thing turns south.
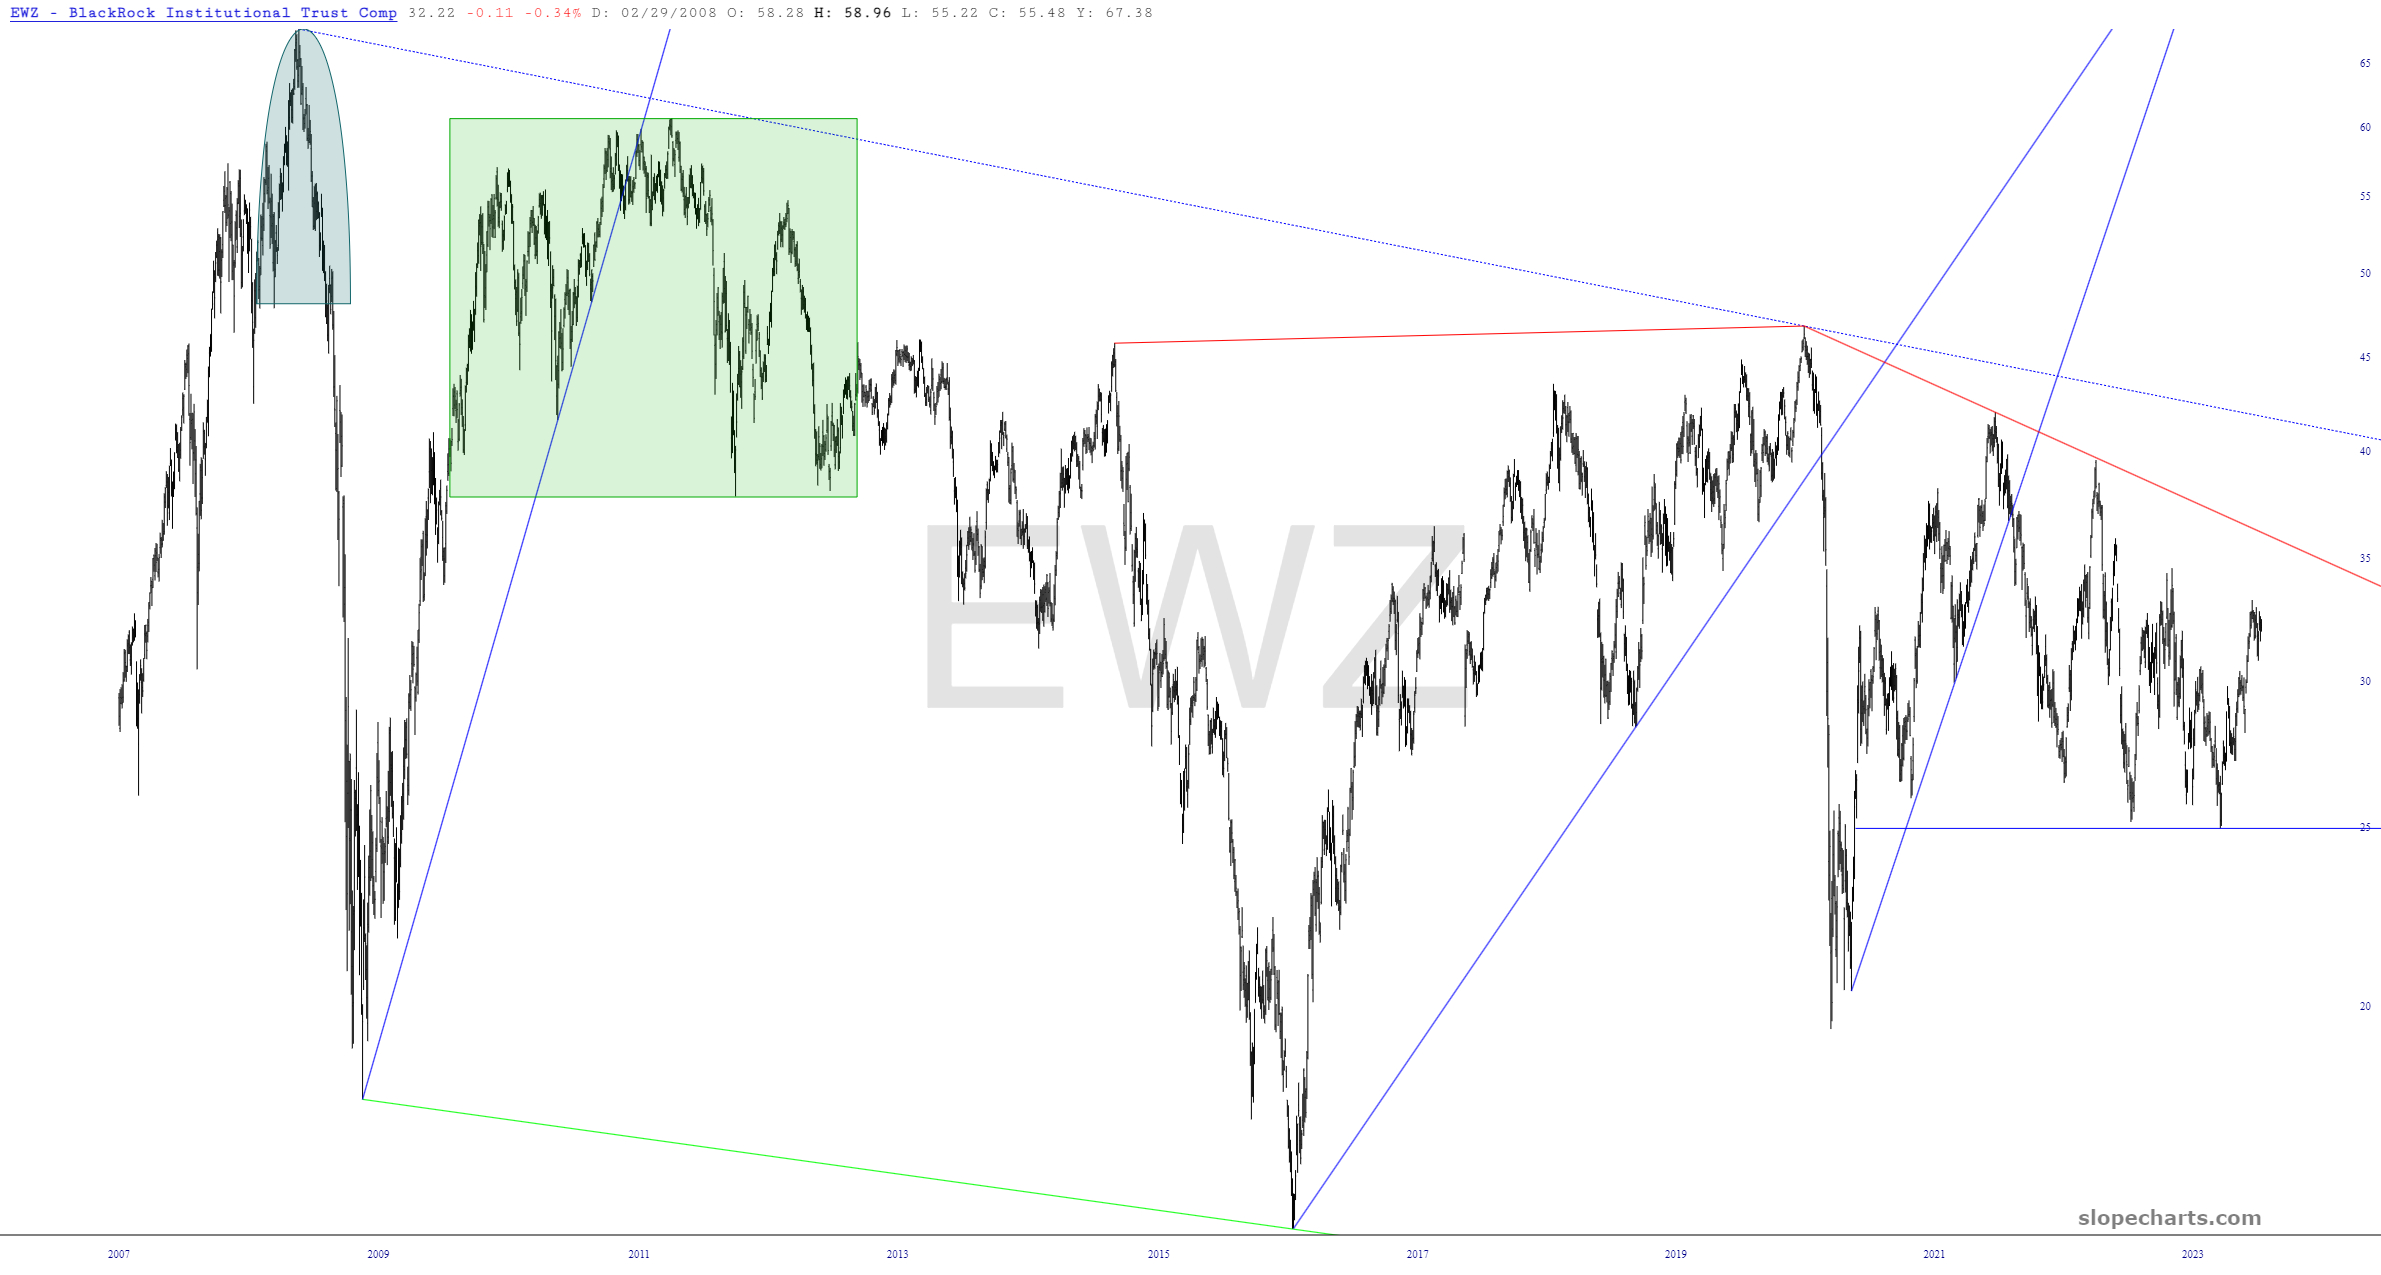
Brazil is remaining relatively weak and has been hammering out a steady series of lower lows and lower highs for years. If and when oil truly turns lower, I think EWZ will fall hard.
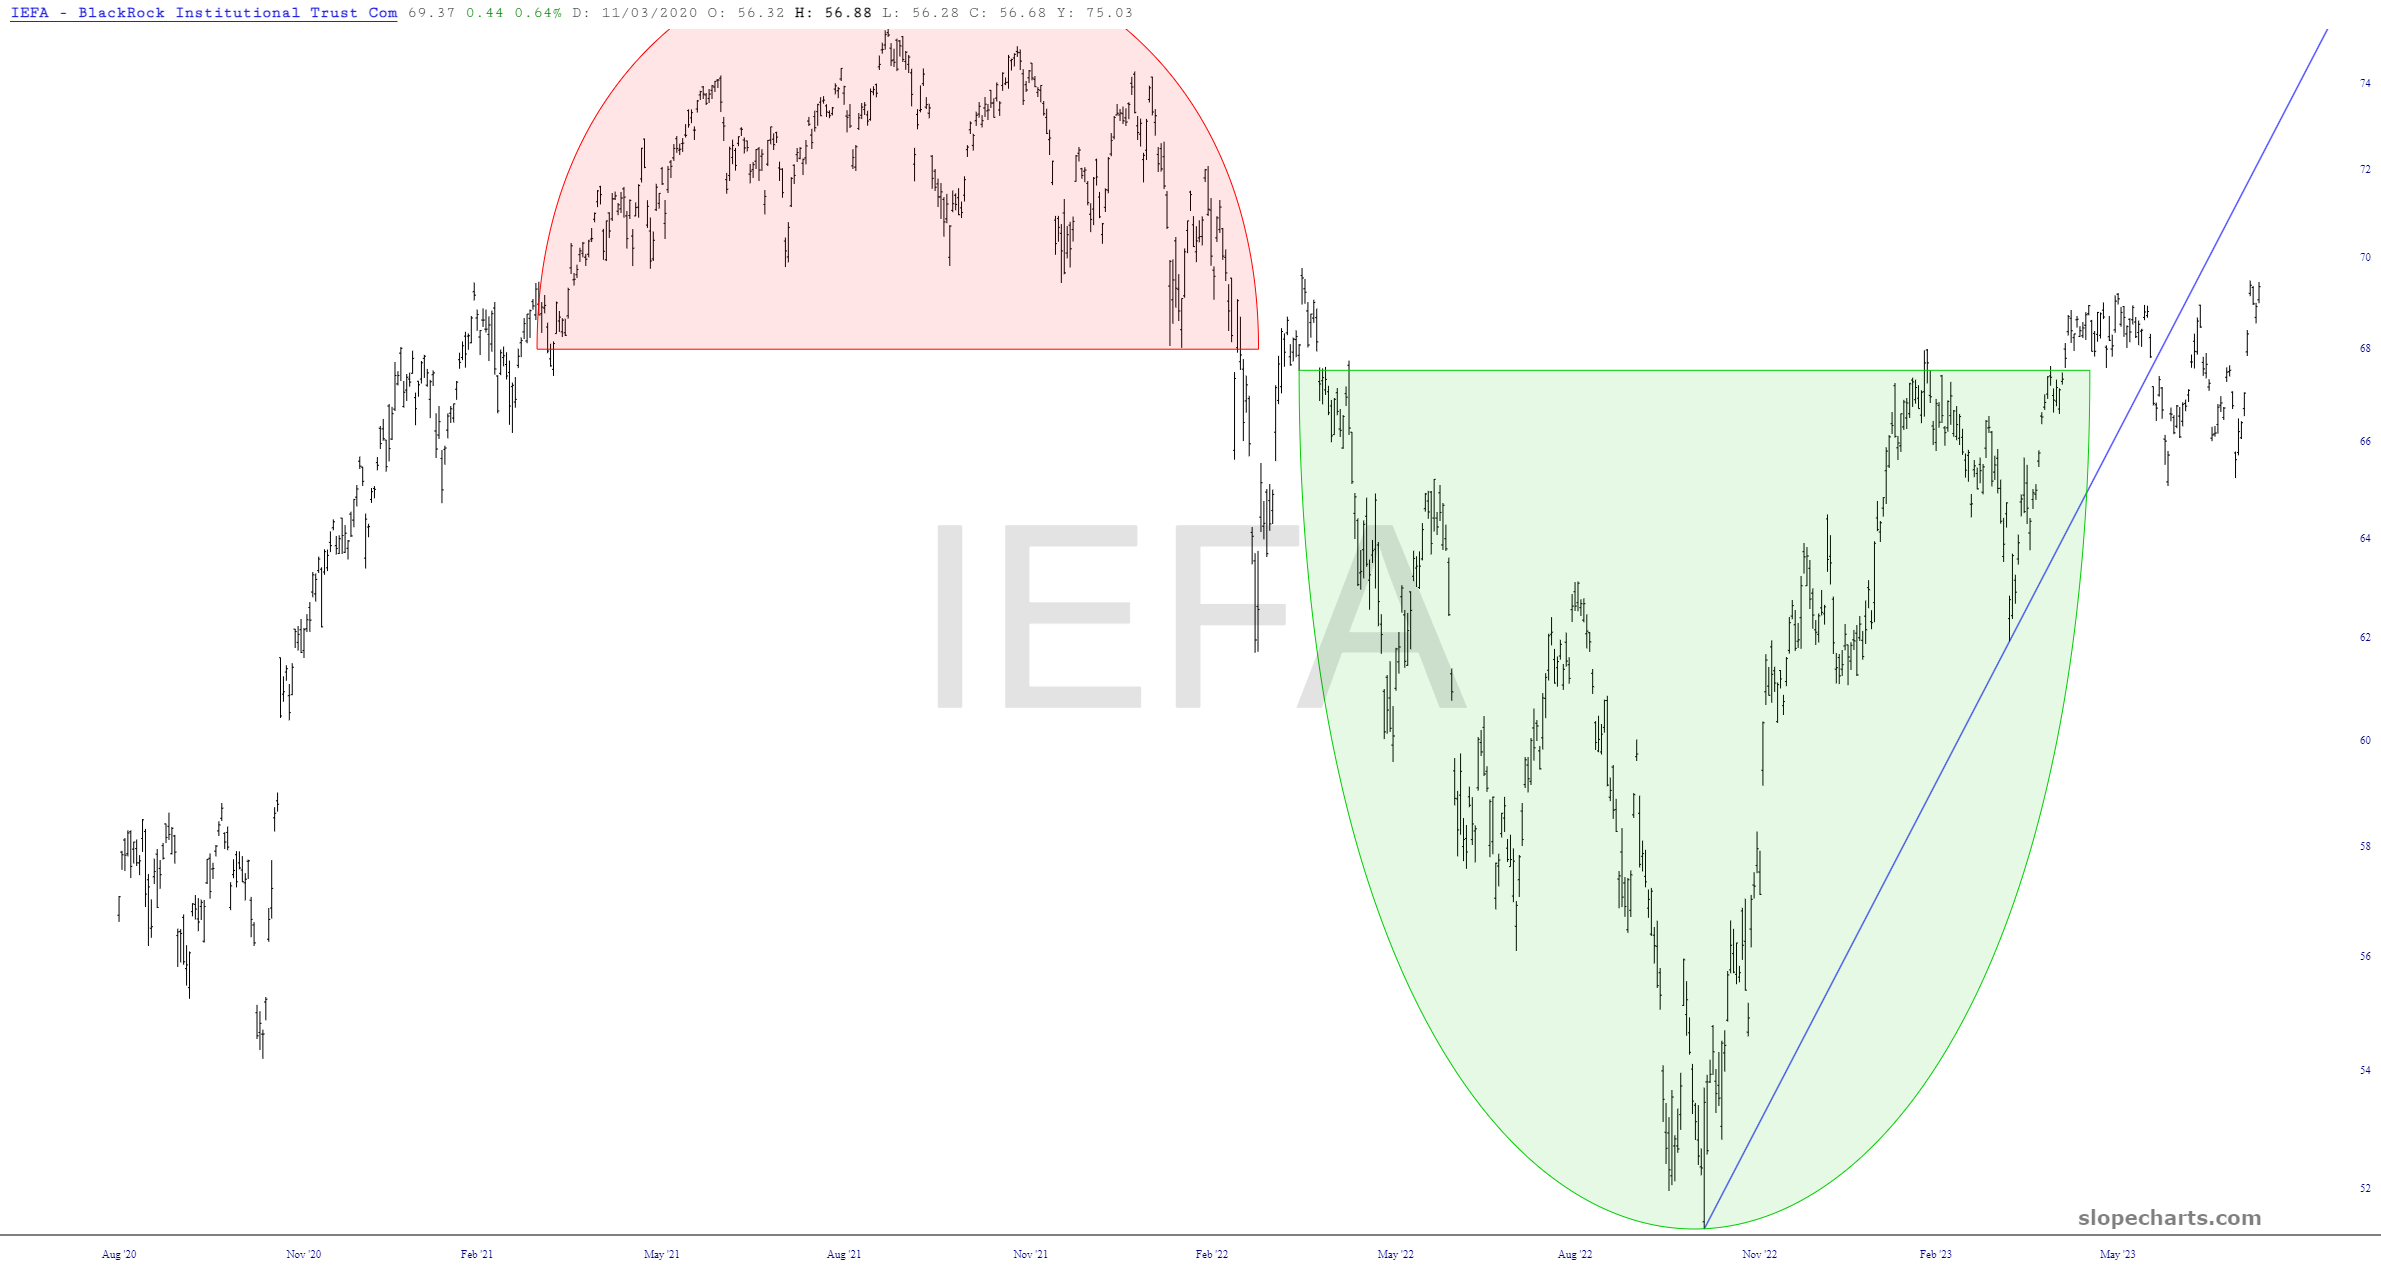
The IEFA and EFA are virtually the same, tick for tick, but I like looking at this since I have a different “take” on the chart. Below you can see the bearish and bullish patterns having off with each other, and, over the past five weeks or so, the up-and-down action below the broken trendline. If the prices can manage to take out June’s lows, it think we can look forward to a more meaningful drop in this sucker.
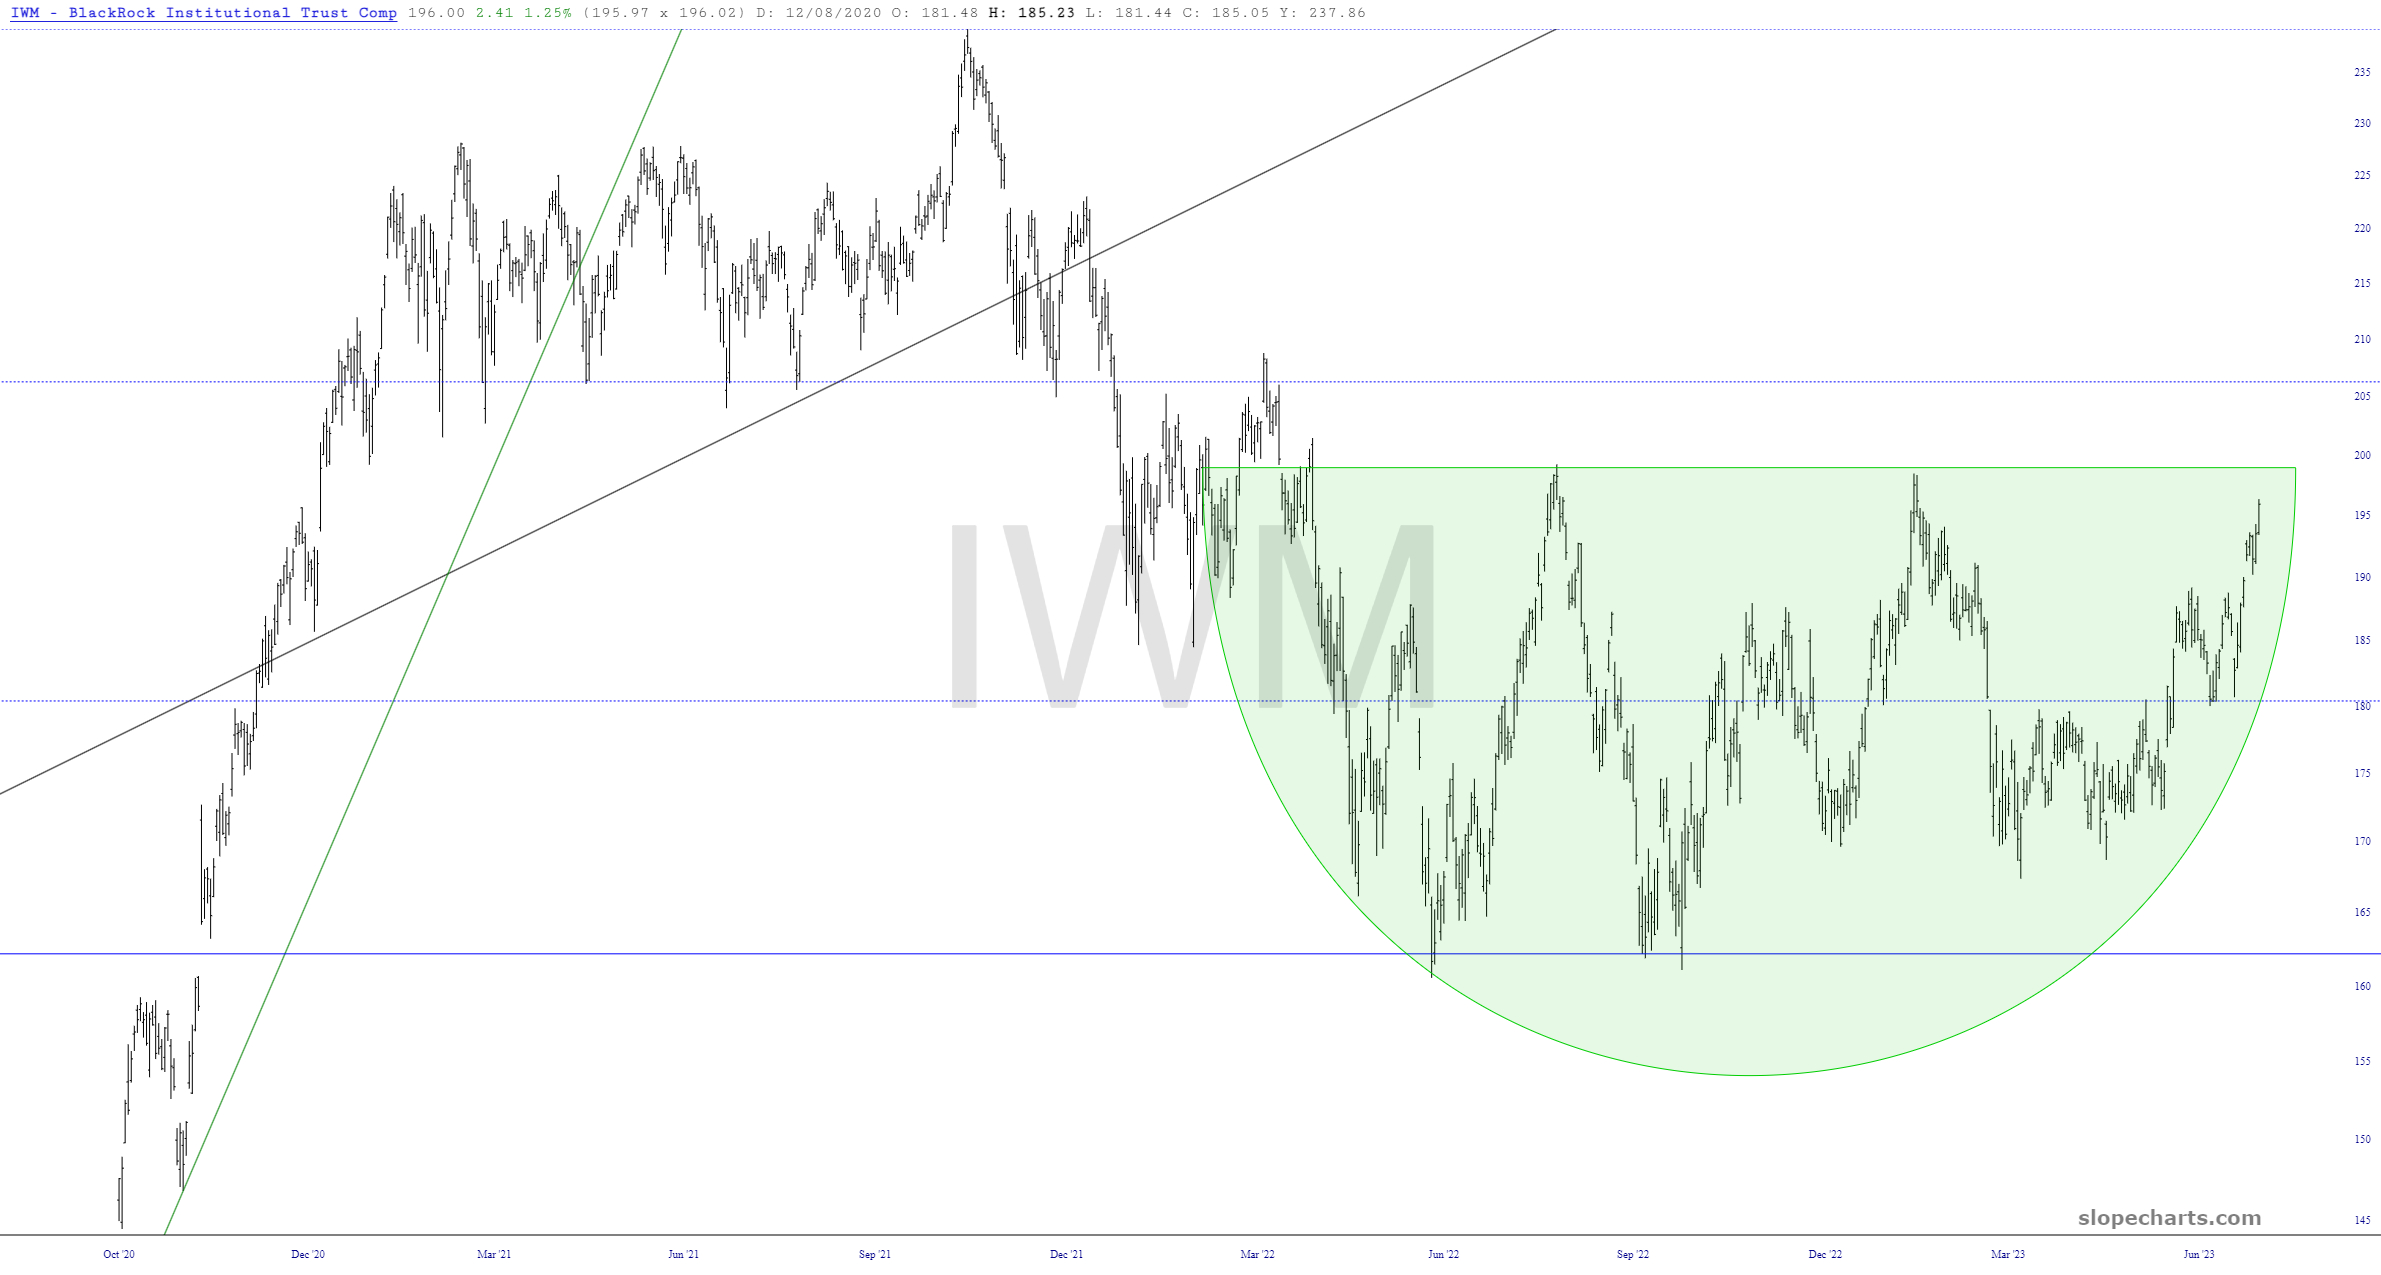
Of course, one looming threat which would negate that possibility would be the successful completion of the small caps pattern. This is getting terrifying close to its neckline. Push above it, and it would add a giant metal drum of fuel to the bullish fire.
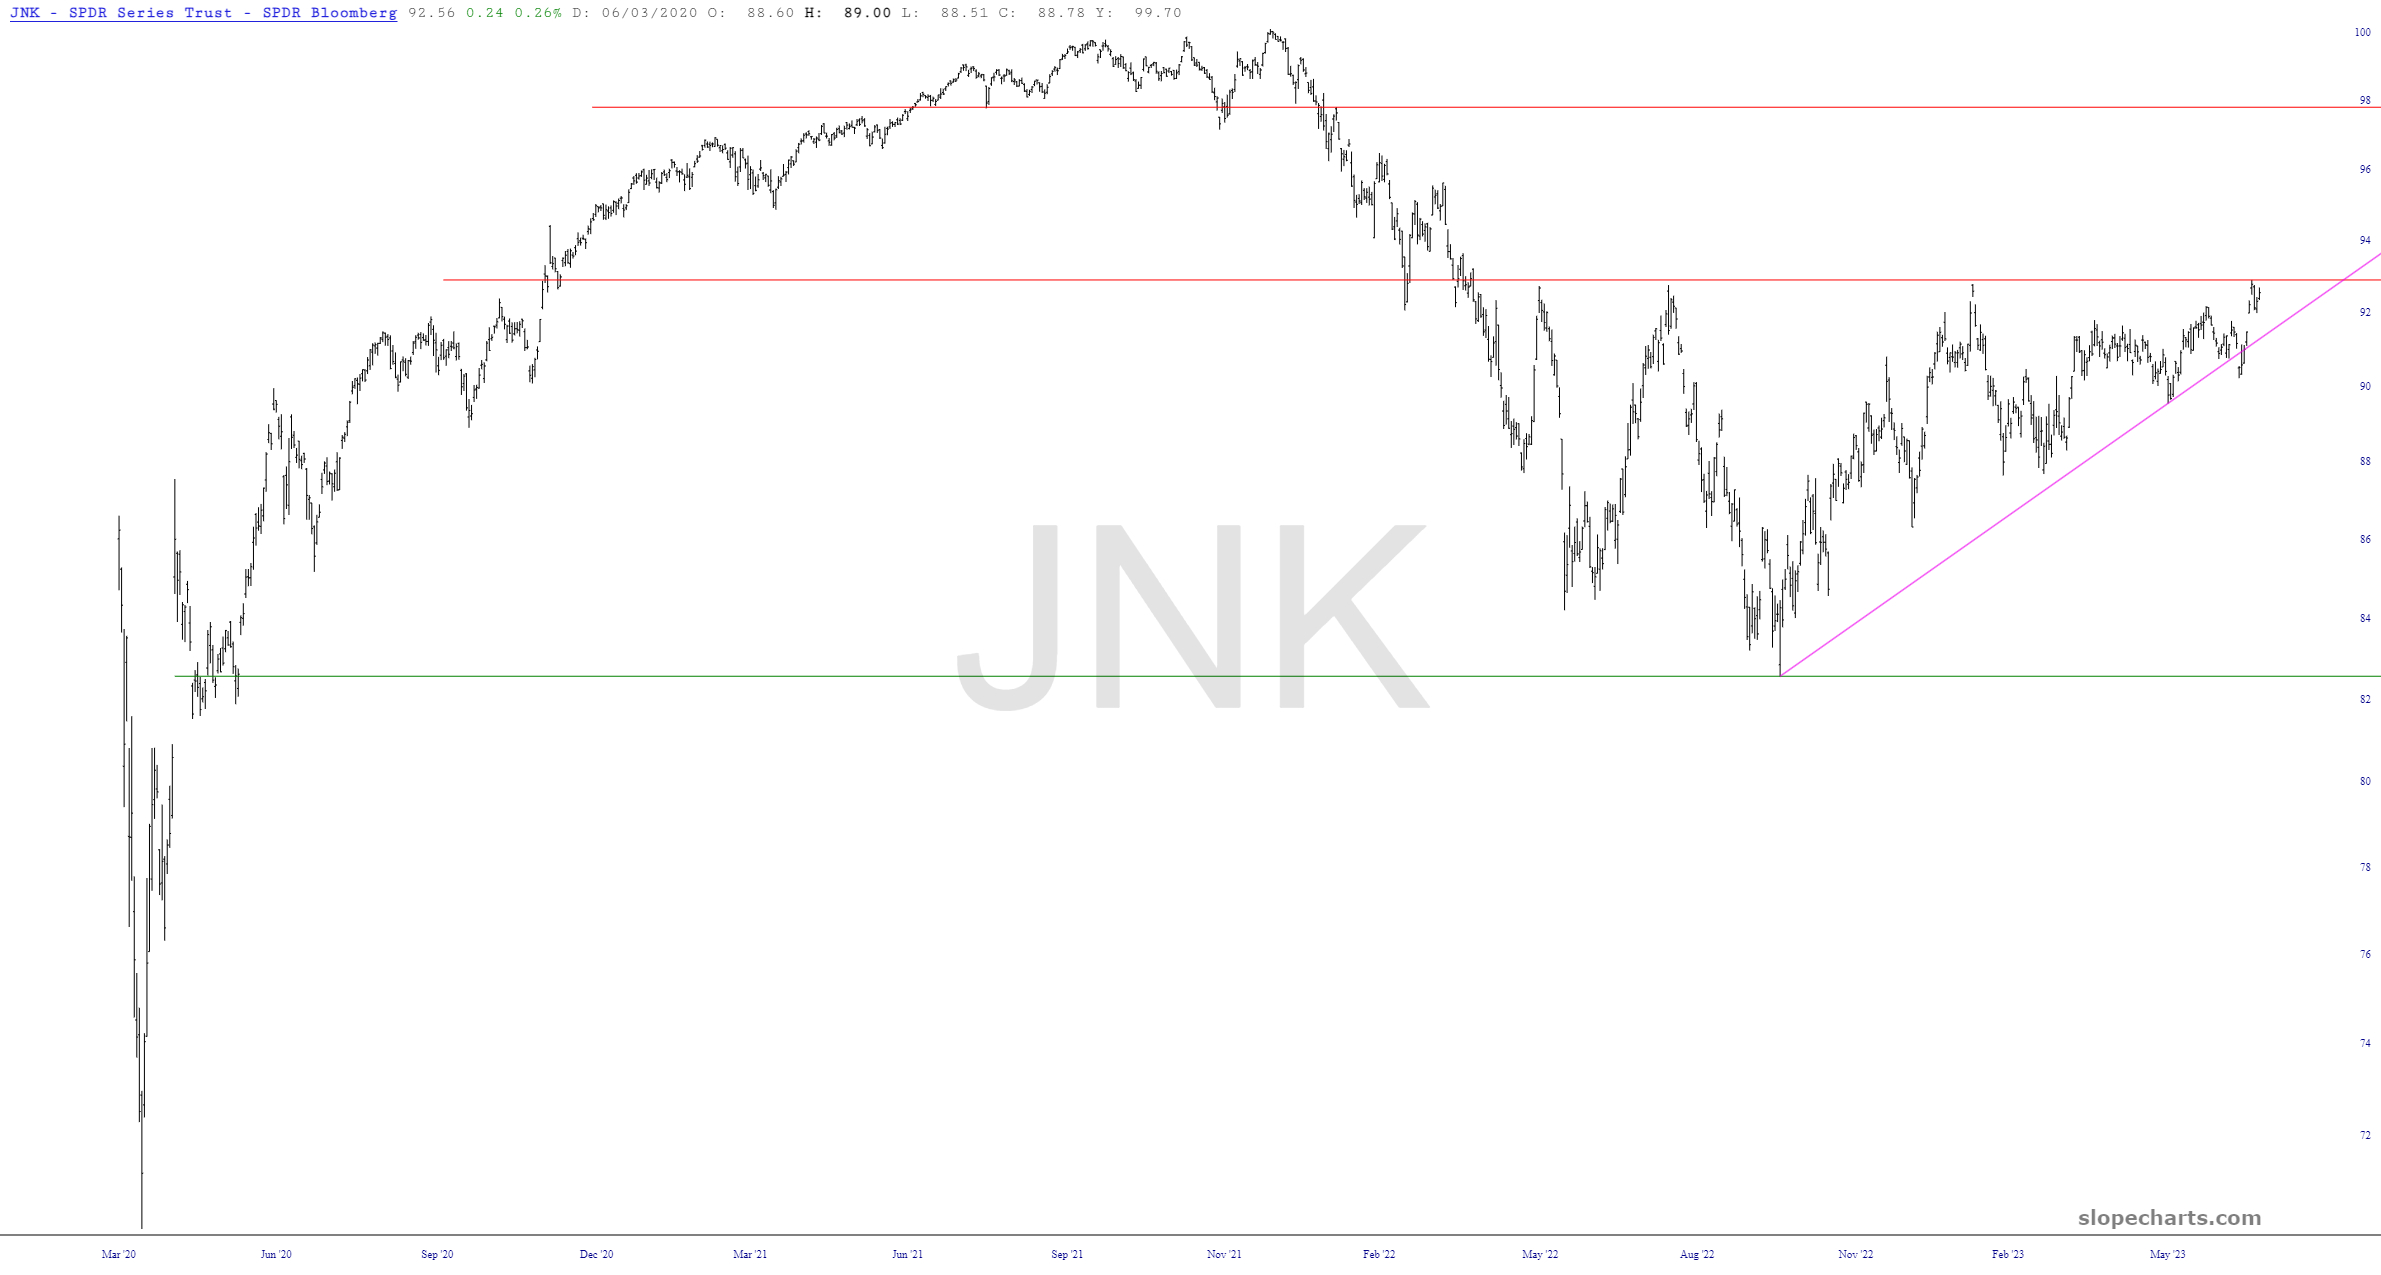
The high-yield fund for “junk” bonds is well worth watching. If it breaks above the horizontal, that augers well for the bulls. If, on the other hand, it slumps to that supporting trendline and breaks it, that could delay further prices gains or, indeed, reverse the trend altogether. JNK is at a key price decision point.
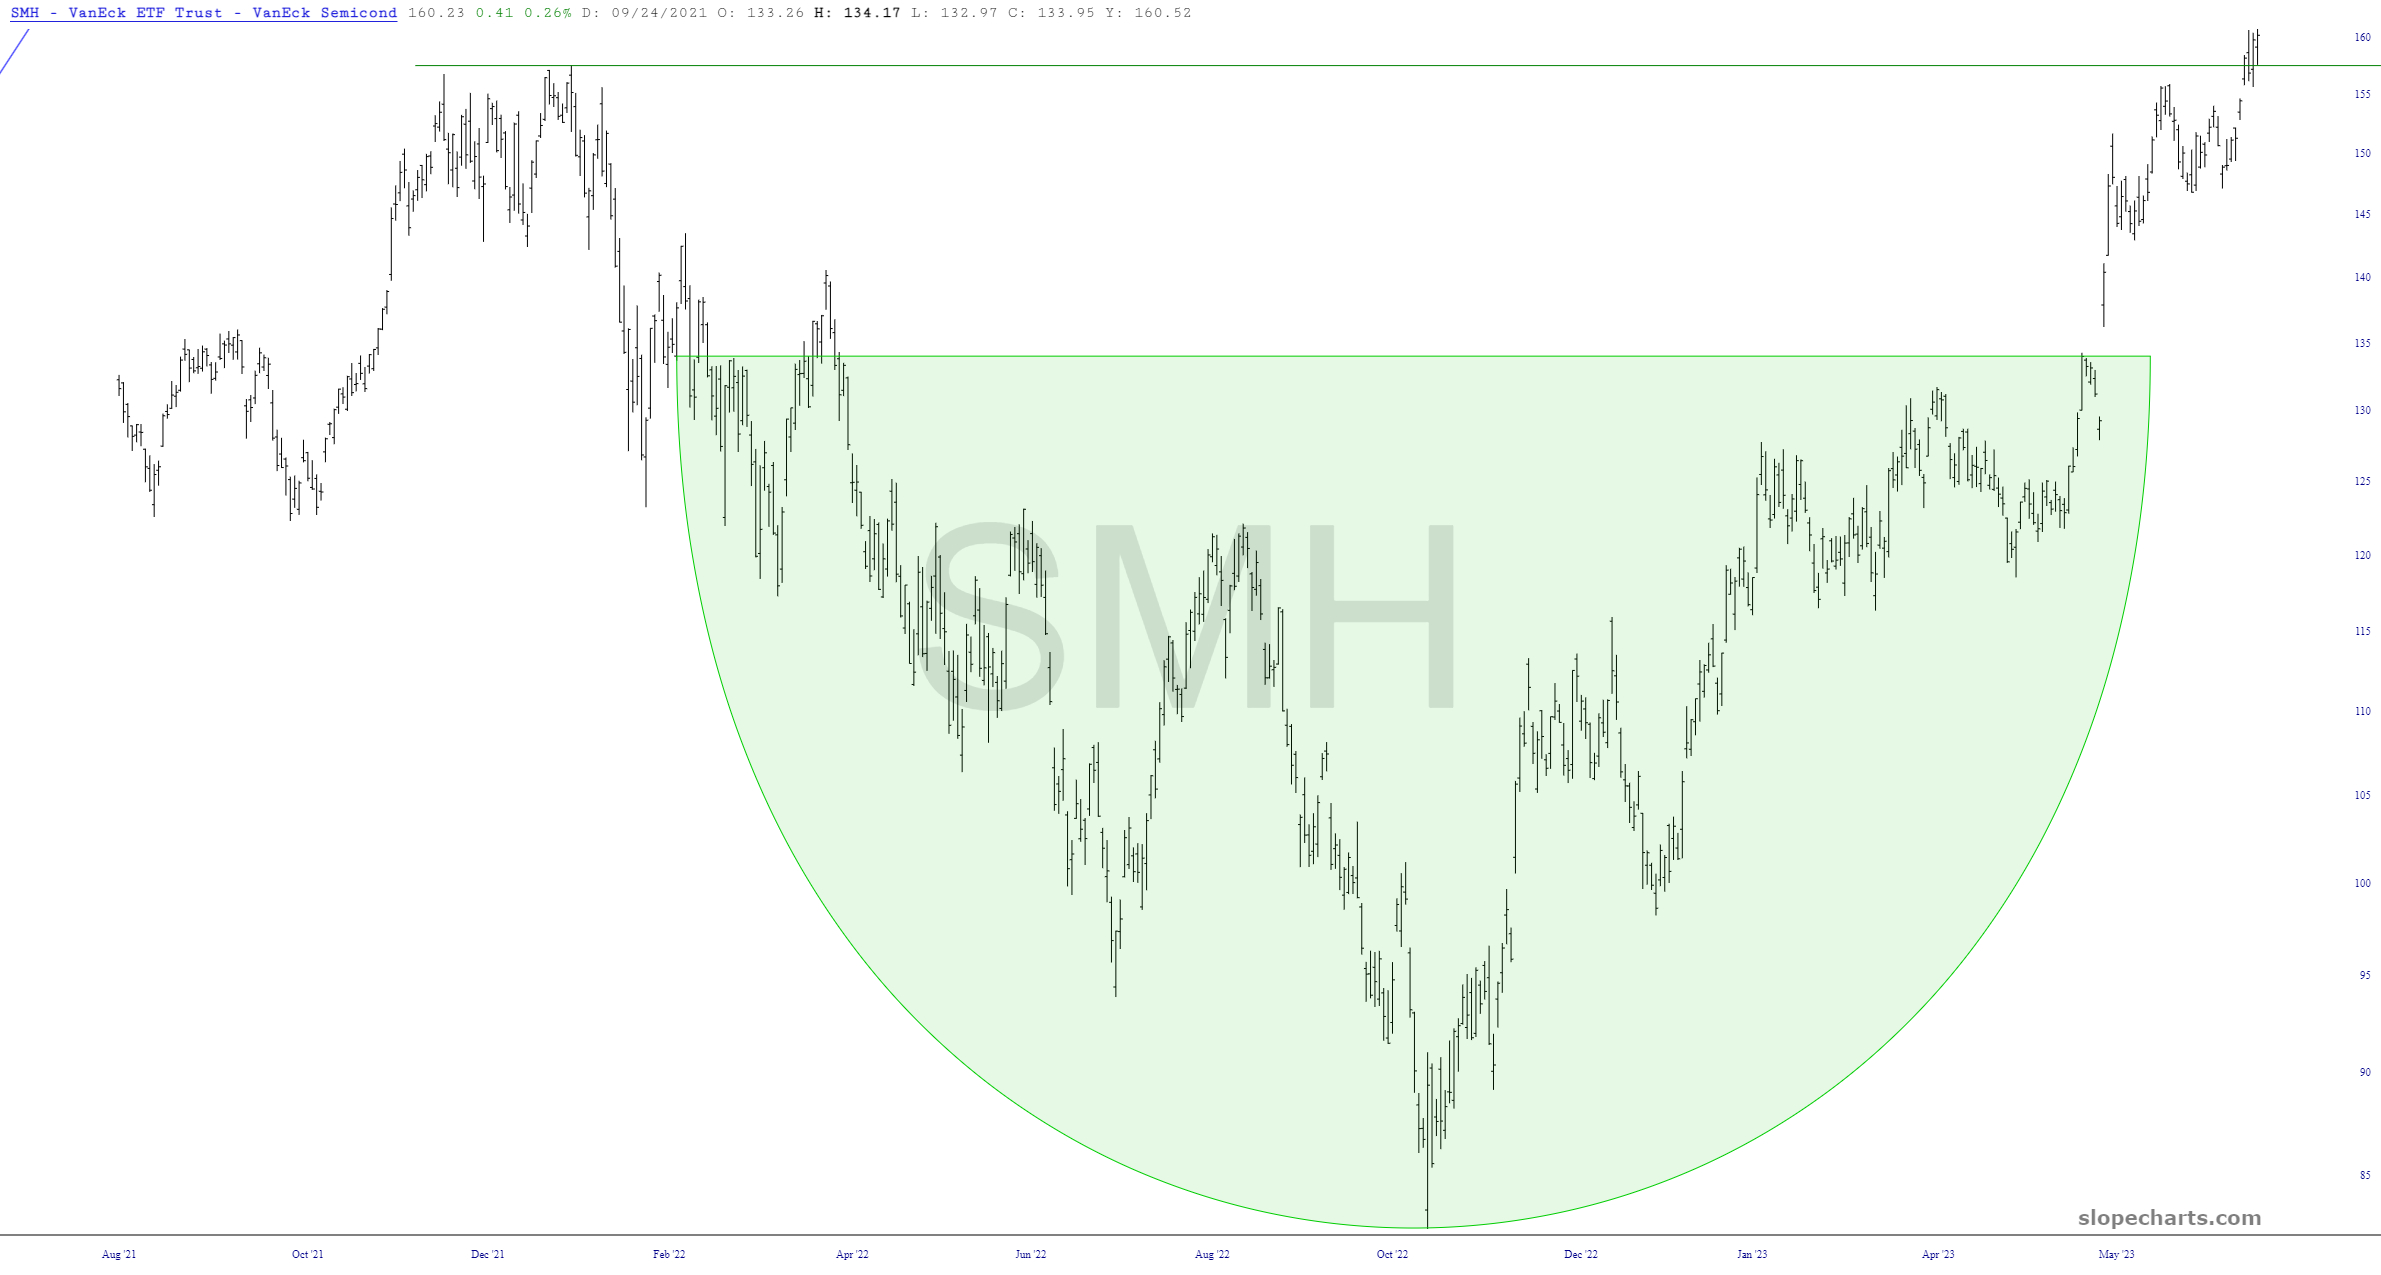
The semiconductors have, of course, been absolutely setting the world on fire for nine months now, led by that member of the Trillion Dollar Club known as Nvidia. Below we see the semiconductor ETF at a new lifetime high. What’s crazy about this chart is that it could fall 17% and still be bullishly configured.
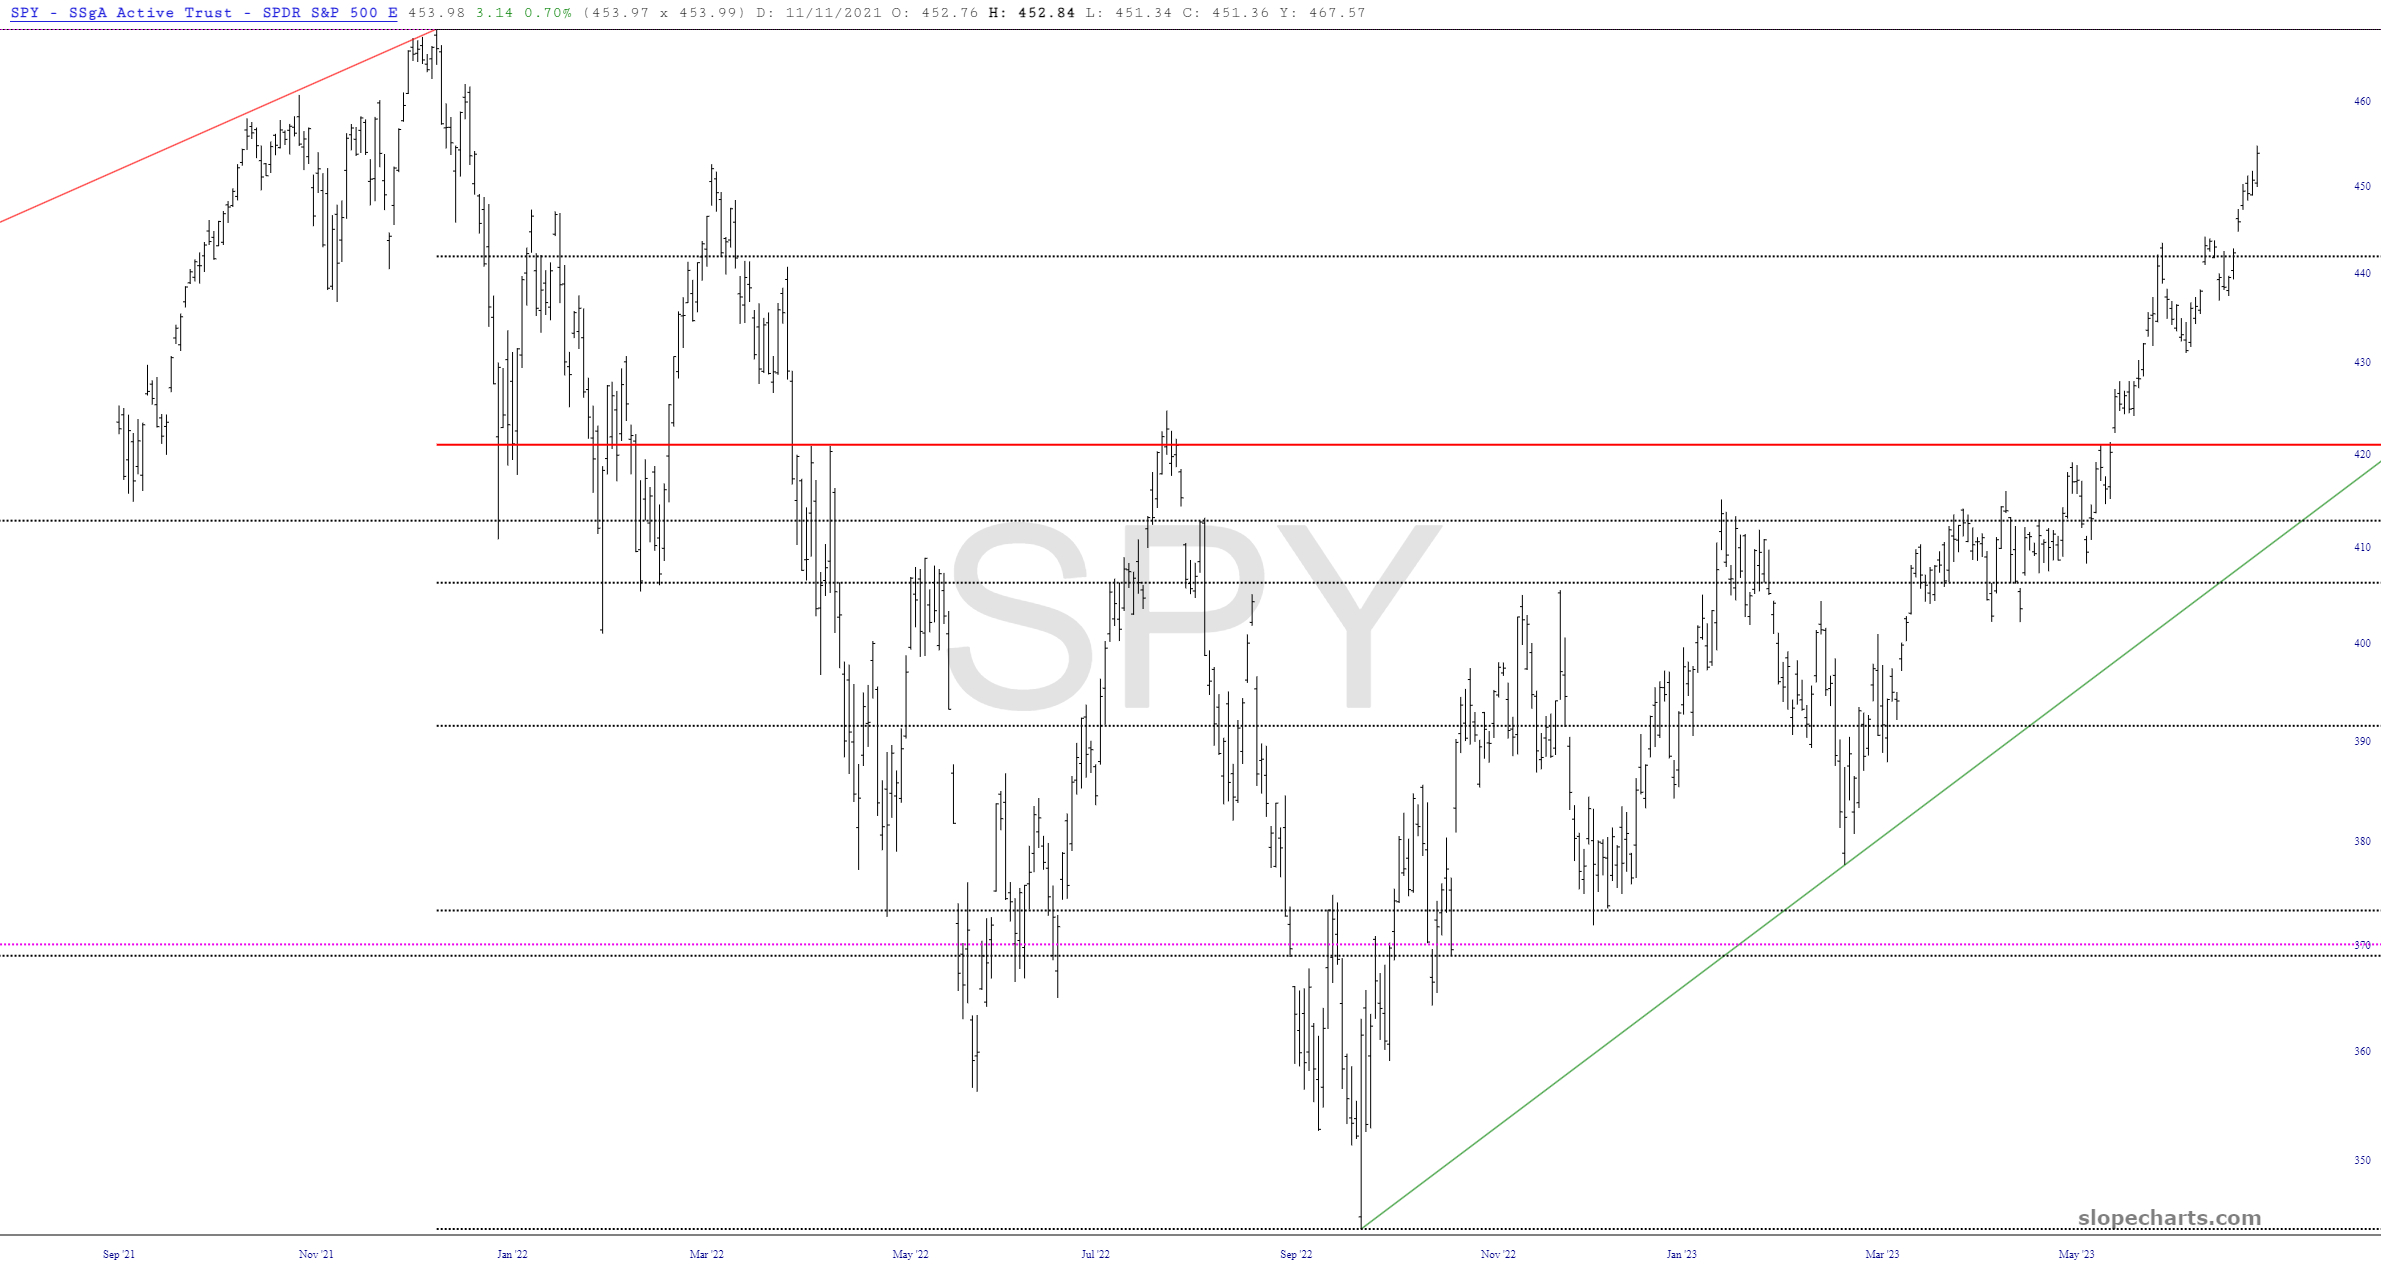
Lastly, we have the fund that started it all back in the vastly simpler times of January 1993. There is nothing the least bit bearish about this chart. Once it pushed above that red horizontal, it was off to the races. The most the bears can hope for at this point is some backing-and-filling, since this is indisputably a sharply-ascending series of higher highs and higher lows.
I remain very thinly positioned, with January 2024 puts on the two ETFs already mentioned as well as five positions on equities (FIVN, HAL, MET, META, and RCL).
