
It is April Fools’ Day today and also the first trading day of Q2, which since 1990 has on average been the most bullish day of the most bullish month of the year. It seems very possible that the current all time high on SPX will be tested today and obviously this is an auspicious day for the bulls to be doing that.
It has been an impressive five full quarters now without a test of either the weekly lower bollinger band or the daily 200 DMA, and if that could be extended into the end of 2014 then the two full calendar years without hitting either would be only the second time in history that this has been achieved. I’ll be taking a look at the historic charts to see what happened after the only other time this was managed in 1927/8, but it could well be that stock prices might then have achieved a permanent high plateau from which any significant decline would have become unthinkable. Heady times indeed.
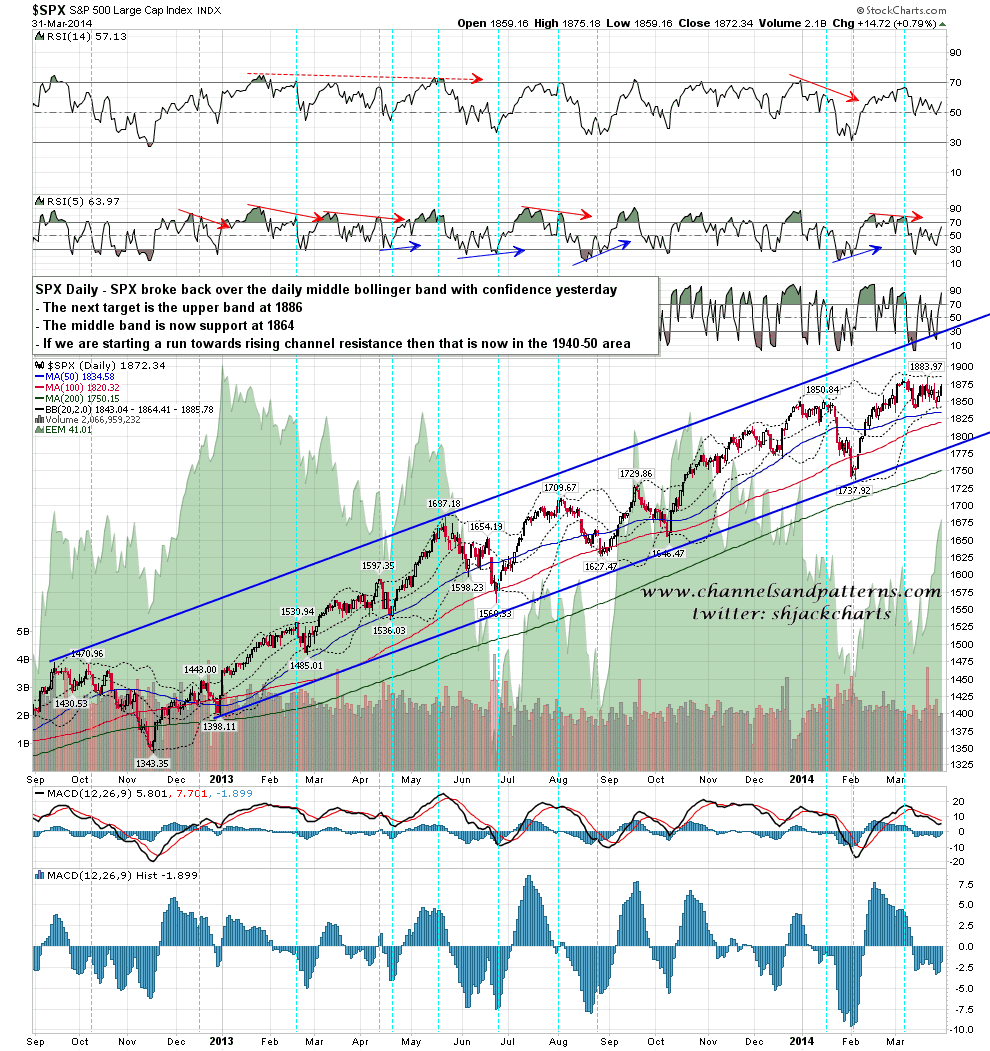
On the daily chart yesterday SPX gapped hard over the middle bollinger band and did not fill that gap, closing convincingly over the middle band. Assuming that holds today then the next target is the upper bollinger band, now at 1886, slightly above the current all-time high at 1883.97. SPX daily chart:
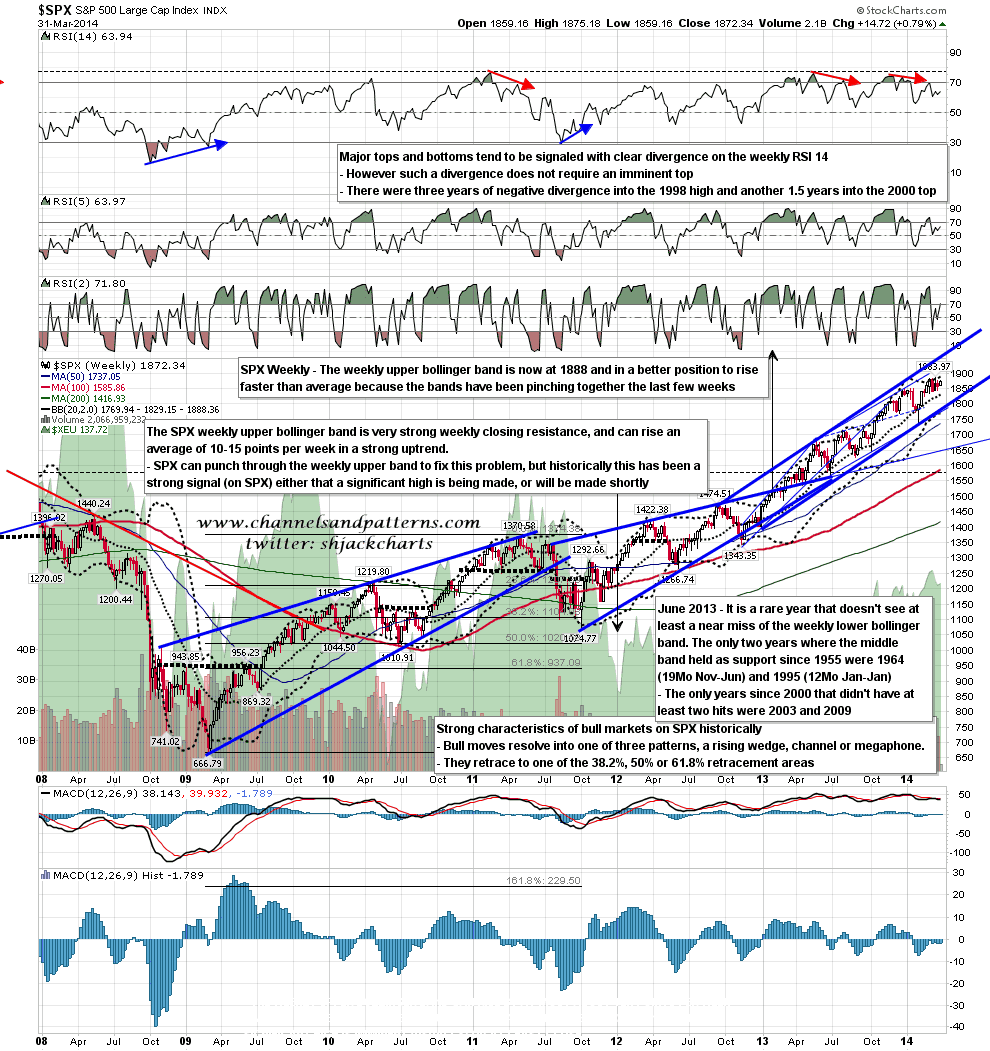
The SPX weekly upper bollinger band is a good fit with the daily at 1888. That could rise to the 1900 area by the end of the week if there is a strong break up. SPX weekly chart:
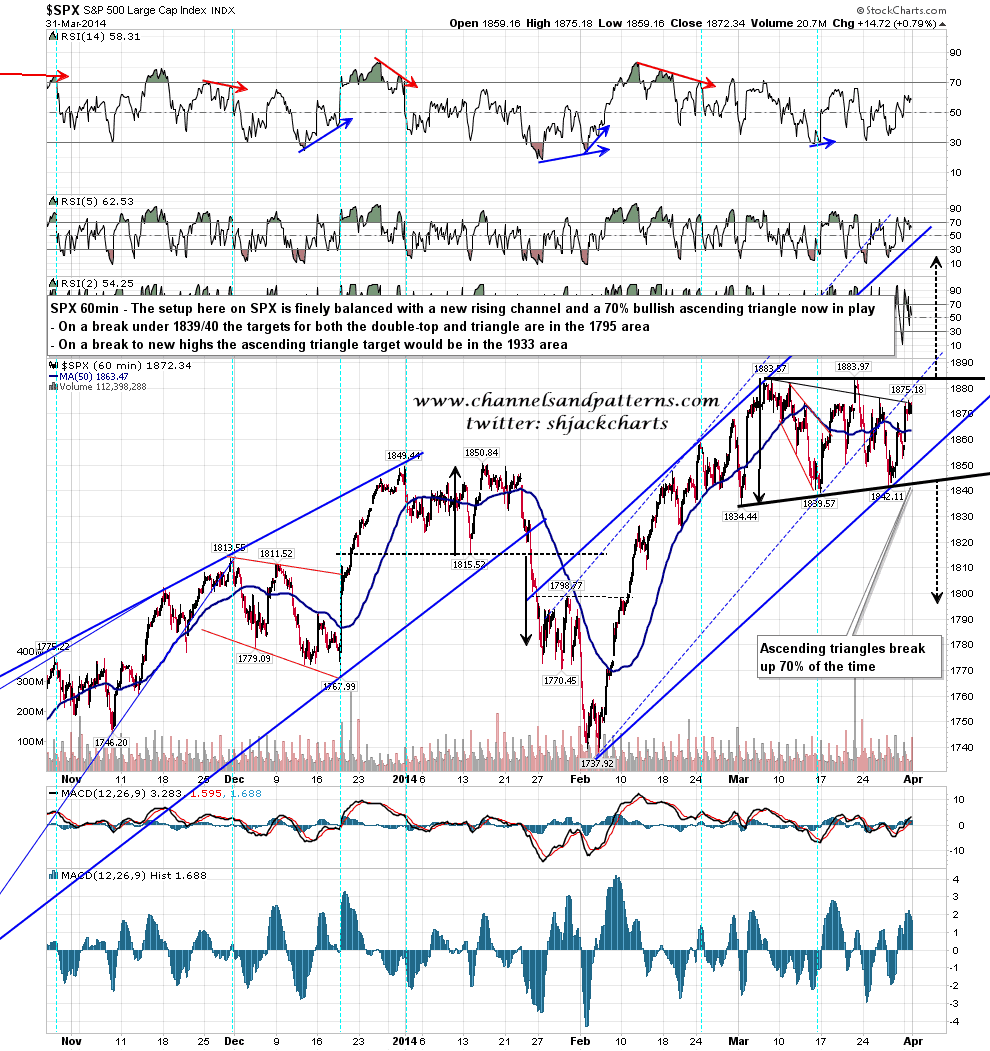
On the SPX 60min chart a retest of the highs is a test of resistance on the ascending triangle that I was talking about yesterday. The odds would favor a break up through that now I think, and if we see that then the triangle target would be in the 1933 area, not far below my wedge target at 1965. If we see a strong reversal there and the new rising channel breaks, then the bears should get another shot at breaking strong support at 1839/40. SPX 60min chart:
On Dow there is another new rising channel established, though no triangle. Dow needs to take out the last two lower highs in March and January before it can challenge the all-time high in December. I’ve seen a lot of talk about the IHS forming on Dow over the last few months and just wanted to mention today that any H&S or IHS in classical charting terms has to be a reversal pattern by definition, so this is not technically an IHS. The ‘neckline’ is obviously a strong resistance level though, and a break over that would still be impressive. Dow 60min chart:

I’m expecting a test of the SPX highs today and if we see a break up from the ascending triangle that should be respected, at least as long as SPX stays above broken triangle resistance. Triangles can be treacherous to trade so there is always the possibility of a false break up with these.
