From Sloper Ray……….
There are four elements to a meaningful understanding of employment: 1) Employment, 2) Unemployment, 3) Job Openings, and 4) Jobless (AKA Unemployment Insurance) Claims.
1) Employment
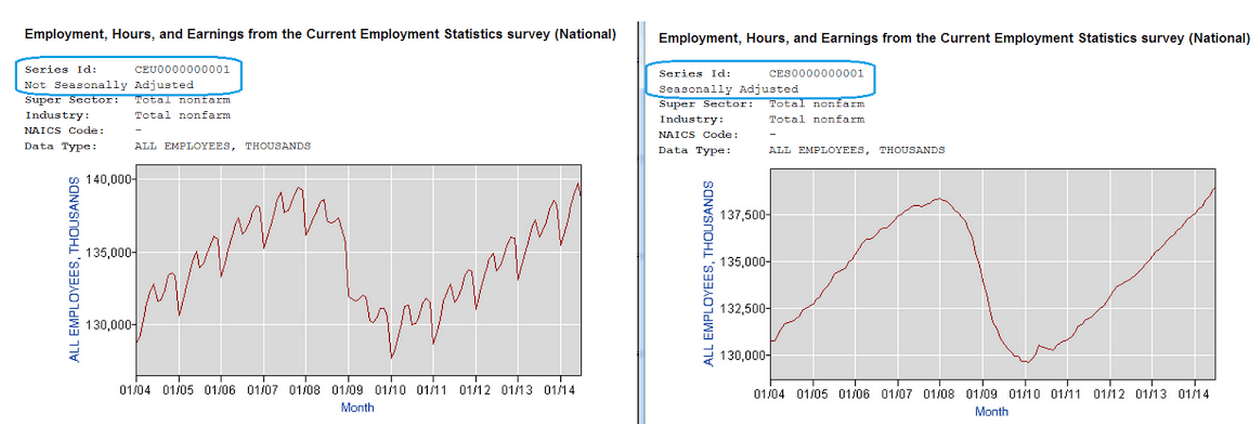
Employment measures the number of people with jobs providing paychecks. Paychecks to employees drive the economy by providing revenues to businesses. The most favored measure is the Non-Farm Payroll (NFP) released by the Bureau of Economic Analysis (BEA) the first Friday of each month for the preceding month. NFP numbers are commonly known to fluctuate month to month across seasons due to predictable differences in the number of days per month, holidays, and college student movement into and out of the labor force. Because these factors can be predicted the current employment (CE) actual numbers, series CEU0000000001, can be “adjusted” to eliminate these variants to provide more meaningful results, thus the most commonly referenced numbers will be “seasonally adjusted” numbers, series CES0000000001. (However, my personal preference is for actual numbers since no one pays for mortgages, utilities, insurance, or food with “seasonally adjusted paychecks.”)
These data sets can be accessed several ways.
The Employment Situation Summary provides a general overview narrative for news agencies to grab quick and dirty numbers and observations. It is provided in HTML and PDF formats released here as “Employment Situation (HTML) (PDF)”:
http://www.bls.gov/bls/newsrels.htm#OEUS
The HTML version provides access to the next depth layer of multiple reports as tables, the most relevant being Table B-1.
http://www.bls.gov/news.release/empsit.t17.htm
Employment is broken down into great depth across industries, across three months + YoY month, and by both Not Seasonally Adjusted and Seasonally Adjusted numbers.
Historical monthly data going back years can be accessed a couple ways.
Seasonally Adjusted numbers (the most popular) are found here, top box “Total Nonfarm Employment – CES0000000001”:
http://data.bls.gov/cgi-bin/surveymost?ce
Click it and hit the “Retrieve Data” button at the bottom of list. To get the graph click the “include graphs” button beneath the from and to dates, then hit the little blue “GO” button.
However, I don’t care for artificial seasonally adjusted numbers. I want the straight intel.
http://www.bls.gov/webapps/legacy/cesbtab1.htm
Click the button for “Total nonfarm” under “Not seasonally adjusted”, then hit the “Retrieve Data” button at the bottom of page. To get the graph click the “include graphs” button beneath the from and to dates, then hit the little blue “GO” button.
2) Unemployment
Unemployment data (not to be confused with weekly jobless claims) is available on the same HTML or PDF release as the Employment, but further information is available in the latter two of the three formats: Table and Historical Data.
Table “Table A-13. Employed and unemployed persons by occupation, not seasonally adjusted” is found here: http://www.bls.gov/news.release/empsit.t13.htm
Historical data for seasonally adjusted “Unemployment Level – Civilian Labor Force – LNS13000000” is found here: http://data.bls.gov/cgi-bin/surveymost?ln
Unemployed people do not drive the economy forward since they are not pulling paychecks to spend. Savings & unemployment insurance (UI) = stored labor.
3) Job Openings
We all know that people are looking for jobs. But how many jobs are available for the unemployed to fill? The Job Openings and Labor Turnover Survey (JOLTS) program produces data on job openings, hires, and separations.
http://www.bls.gov/news.release/jolts.a.htm
4) Jobless (AKA Unemployment Insurance Claims
Unemployment Insurance Weekly Claims data is put out every Thursday.
http://www.dol.gov/dol/topic/unemployment-insurance/
Most of the attention goes to initial claims (new people getting money) while my attention goes to continued claims (people still on the dole after weeks and weeks without finding one of those nine million jobs.)
http://www.dol.gov/ui/data.pdf
Last week there were non adjusted initial claims of 247,133, continuous claims were 2,480,488.
A Complete Picture
Employment situation Table A-1 is of the entire labor force, employment, unemployment, and persons wanting a job:
http://www.bls.gov/news.release/empsit.t01.htm
Putting all of the above data together in a coherent summation, according to the BEA June 2014 data there were (in thousands):
156,997 available to work
– 90,817 not in labor force*
= 147,104 working employed
9,893 unemployed
– 3,199 not looking for jobs
= 6,694 wanting a job
– 4,830 hired
= 1,864 haven’t found a job among the…
4,671 jobs still remaining open.
2,394 of those unemployed were pulling continuous unemployment insurance (UI) checks.
http://workforcesecurity.doleta.gov/unemploy/claims.asp
Employment (147.1 million working) is by far a much more meaningful economic impact factor than the sensationalism of unemployment (9.9 million not working) and initial/continuous UI (0.3/2.4 million living off UI).
Matching the nearly two million people looking for jobs with the over four and a half million jobs available is apparently a more daunting task than I would have thought.
Correlation: Economic Employment vs. Stock Market
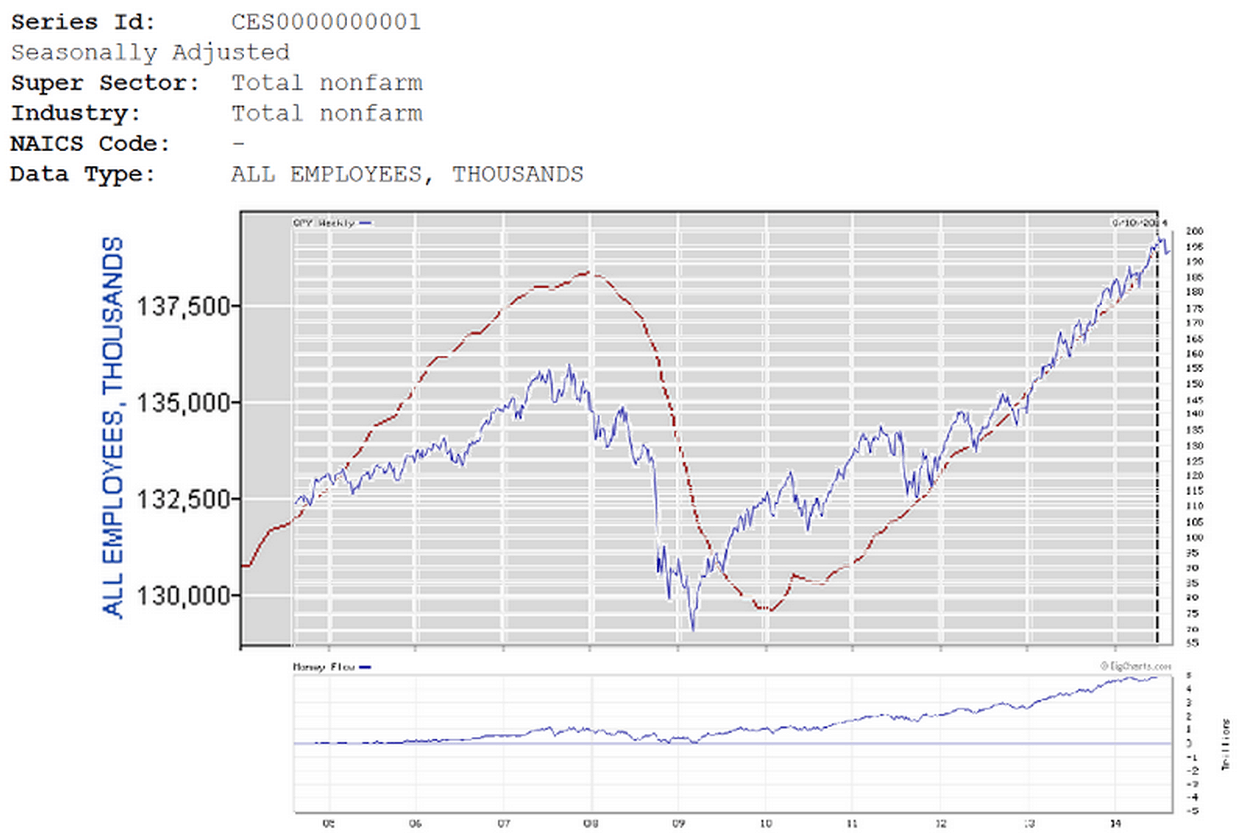
The economy and the market are related but not the same. Ten years of seasonally adjusted NFP with an overlay of SPY as proxy for S&P500/SPX (to also see the flow of money into the ETF/index) renders this:
The market clearly started topping and falling before employment did Q108. Again, the market started to recover quite well before employment in 2009 and 2010, respectively. These both suggest employment preservation and growth factors appear to have an obvious benefit to the stock market before it benefits employment.
Jobs = paychecks = spending = revenues = earnings.
If people work you get a higher stock market.
If people don’t work you eventually get a lower stock market.
Jobs are relevant.
Not-jobs are not relevant.
* Not in the labor force (Current Population Survey)
Includes persons aged 16 years and older in the civilian noninstitutional population who are neither employed nor unemployed in accordance with the definitions contained in this glossary. Information is collected on their desire for and availability for work, job search activity in the prior year, and reasons for not currently searching.


