
Stan and I were asked an interesting question yesterday, which was whether we had any historical stats for how equities tend to perform on Friday the Thirteenth. We don’t, and I don’t recall ever seeing any. Has anyone seen stats on this? Interesting question and if I ever have some free time I might work some up just out of interest.
I was saying yesterday that the decline was likely a practice run as part of the topping process and well, here we are. Nice technical day yesterday with the ES & NQ declines failing into obvious bull flags. The NQ flag broke up yesterday and made target at the ATH retest overnight. The ES flag has broken up at the open today with a strong target back at the retest of the all time high. That’s so close now that we’ll likely do that today.
Here’s the link to my premarket video for Daily Video Subscribers at theartofchart.net this morning, also covering DX, CL, NG, GC & ZB of course. We’ve been nailing pretty much everything except GC this week, though Stan had a better handle on that than I did. I pretty much redrew my GC chart from scratch yesterday night & think I have a good handle on that now. We’ll see in the next day or two whether I’m right about that. If you’re interested in trying the services we offer there is a two week free trial available on this page here. That covers all our services except the Big Five Service covering AAPL, AMZN, FB, NFLX & TSLA.
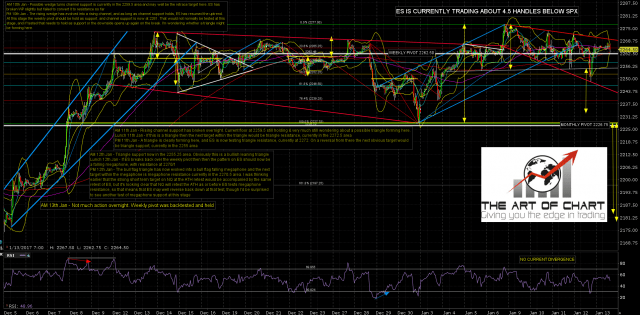
ES has now broken up from the bull flag megaphone with a target at the all time high retest. ES Mar 60min chart:
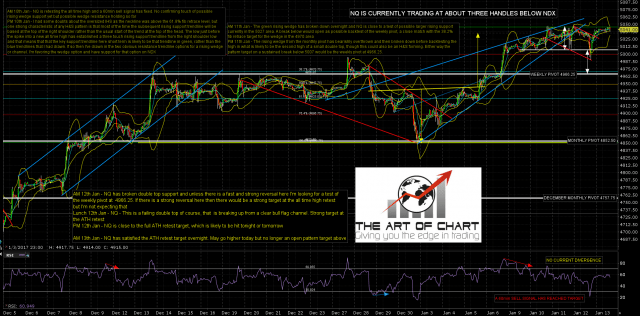
NQ broke up from the bull flag channel yesterday and has since made a new all time high. 4 of the 5 NQ components in our Big Five Service at theartofchart.net are looking short term toppy, and these are a large enough proportion of the index that I’m doubtful about much more upside on NQ short term. NQ Mar 60min chart:
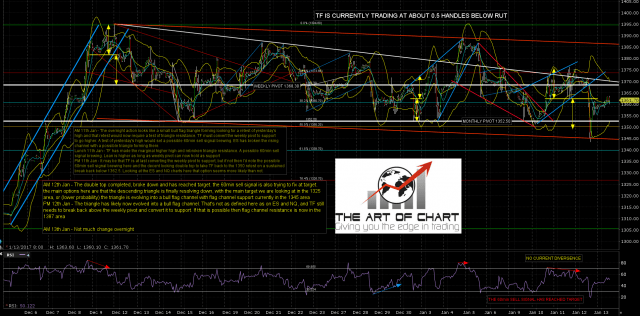
TF has broken back over the weekly pivot and the obvious next target is bull flag resistance, currently in the 1386/7 area. TF Mar 60min chart:
Holiday tape today which should be thin and would usually lean bullish. I’d be surprised to see ES go any lower than the weekly pivot at 2262.50 today, and I wouldn’t be that surprised if ES doesn’t break below 2269 again today.
After a look around for a replacement for Screencast as an image host I’ve settled on Flickr and testing that this week has gone well. 1TB of free storage, no onerous bandwidth restrictions & good reliability. I’m also going to be uploading to Flickr some of the intraday charts that I show on the theartofchart.net subscriber only twitter feed, so if you’re not a subscriber and you’d like to see those then you just need to use this link, and make sure that you have selected for the charts to be sorted by upload date and time so the newest charts are at the top. Strangely there don’t seem to be many, or possibly any, chartists using Flickr for charts. I’ve no idea why that is, as it looks ideal as a chart server and archive. Perhaps I’ll start a trend. Everyone have a great weekend 🙂
