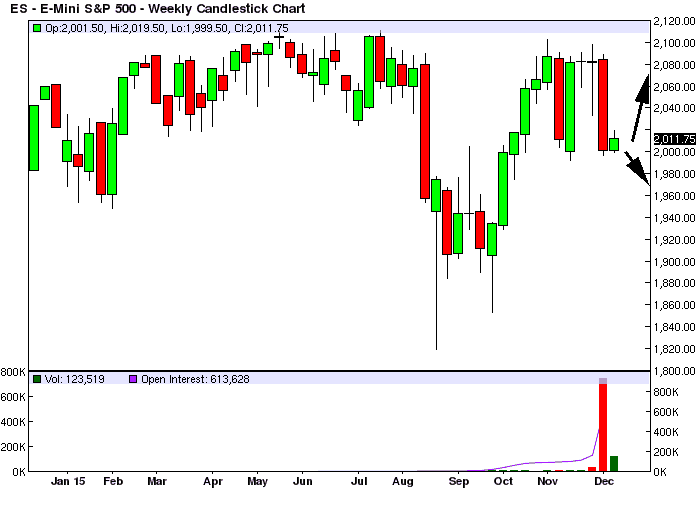
The ESH16 market last week closed down, losing about a 100 points in value from the previous week’s highs. Looking at the ESH16 WEEKLY chart below you can see that the price trend, after recovering, faltered. What have we learned from the last few months? That after a correction there is a mass of buyers ready to step in and push prices back up to the previous top in the ~2100 price area, but as soon as the price reaches that zone the buyers disappear and the market tanks again. Very interesting.
The next valid WEEKLY resistance, according to our quantitative models, is at ~2074, and next valid WEEKLY support is at ~1979 (OVERSOLD).
If there is an attempt to rebound from current levels, the market will encounter WEEKLY/MONTHLY resistance in the ~2074/2166 area, according to our models. There it would be reaching the end of any uptrend, we are not at a major market bottom from where the upside can be considerable.
In short, this means: a rebound is possible soon, but the upside is capped at around ~2100.