Slope of Hope Blog Posts

Slope initially began as a blog, so this is where most of the website’s content resides. Here we have tens of thousands of posts dating back over a decade. These are listed in reverse chronological order. Click on any category icon below to see posts tagged with that particular subject, or click on a word in the category cloud on the right side of the screen for more specific choices.

Liebe Meine Abschmenkee!

By -

ACL…….151.46

AM…….22.70

AMR…….9.25

ATHR…….35.16

BA…….67.58

BIG…….35.66

BOOM…….17.73

CAM…….38.38

CHS…….11.87

CHSI…….39.51

CNH…….27.74

COMV…….9.68

COO…….39.00

CQB…….14.37

CREE…….70.03

CVA…….16.94

CY…….11.77

EFX…….30.63

EIX…….34.49

ELP…….18.98

EXC…….40.94

FIRE…….22.51

GCI…….17.25

GD…….67.65

GME…….20.60

GRS…….7.93

IP…….26.24

JNS…….10.75

L…….34.12

NBL…….66.57

NFP…….11.45

NI…….15.61

NILE…….53.73

NOV…….39.30

OII…….50.15

PAG…….13.76

PDC…….6.56

PDE…….25.41

PKG…….23.60

PLL…….37.98

QDEL…….12.60

ROK…….55.46

SAN…….69.18

TTI…….10.24

XRX…….9.76

1102 ES Resistance Broken (by Springheel Jack)

By -

The bulls finally rediscovered their mojo and broke the very strong
resistance at 1102 ES yesterday. SPX also closed above the 200 daily
SMA, and in my view that makes it unlikely that we will be revisiting
the lows in the near future. For my money, the interim low is now
confirmed as in, and the question is how far this rally will go.

In the short term ES bounced off rising trendline resistance at the high
yesterday, and as I write is retesting the 1102 level. That may well
now prove good support, but if it breaks I see a possible fall to the
next strong support level in the 1084 area, which is also close to
probable rising channel support. If we get there I'll be seeing that as a
buying opportunity:

100616_ES_60min_Rising_Channel

I've been looking hard at the SPX 15 min chart and on that I'm looking
at the recent trading range as a rectangle with a target at 1164 ES and a
possible IHS with a target in the same area. I have a strong uptrend
resistance line, as with ES, but support looks mushy and undefined. I'm
hoping that trading over the rest of the week will confirm a tradeable
rising support trendline:

100616 SPX 15min Rectangle and Poss IHS

On the SPX daily chart with my model bear scenario, I've marked in the
broken 200 SMA line and also the break yesterday of the 50 level on RSI,
both very bullish signals. If we were to rise over the next two weeks
to my model target, that would be in the 1164 SPX area as well, and that
is the primary scenario that I'm considering now:

100616_SPX_Daily_Model_Bear_Scenario

Vix broke down to under 26 yesterday and I've marked in a declining
resistance trendline on the 60min chart that I am expecting should hold
for the duration of this rally:

100616 Vix 60min Downtrend Line

NYMO is probably the most interesting chart that I was looking at last
night. Here's the daily chart showing that we have moved from extremely
oversold to extremely overbought over the last three weeks. If you look
at the chart, a move as fast as this from under -100 to over +80 has
happened only twice in the last three years, once in the October 2008
rally, and again at the March 2009 low. The November 2008 to Jan 2009
move is also worth a look though:

100616 NYMO Daily SR Zones

This confirms in my mind that we have made a very significant low,
though it is obviously very ambiguous over whether the move up that we
are watching now is a rally or a move to new highs. I favor the former,
but I'm bearing the latter possibility in mind too.

Bear Market in Gold (by George Rahal)

By -

Golden lads and lasses must, 
As chimney-sweepers, come to dust.

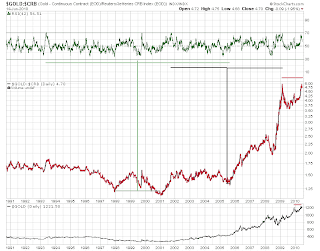
Gold is ontologically a commodity, store of value, and currency. We have all heard the bullish gold arguments. The charts say otherwise.

Gold as a commodity:


Above is the ratio of gold to the commodity index. Note how this ratio made the first of two tops much earlier than gold; it is losing momentum. Also note the second T. It has expired on point. I interpret the accurate inverse T as framing the time period in which gold underperformed. Finally, the pattern during the T rise resembles the many
fractals I observed that preceded market crashes.

Gold as a safe haven:


Plotted above is the ratio of gold to a precious metals index. The bubble burst October of 2008, at the peak of the market panic.
 

Gold as a currency:


Gold to the dollar versus gold. This is a bullish chart confirming that gold
 had a great bull run. However, in the eight years I have plotted, I have only noticed two divergences, one positive one negative. The positive one occurred a mere few weeks prior to gold breaking the 1000 level. A very pronounced negative divergence is present in recent history.

GOLD – THREE PEAKS AND DOMED HOUSE:


Most
numbers match up well, but I just placed select ones. Point 25 will
probably coincide with a stock market decline and a piece of news that
justifies the gold safe-haven trade; then, sell the news. Based on this
analysis, the target price is 680.

Also note the historical
inverse relationship between gold and the US dollar:

One
of these two will win out, and my bet is the dollar (although due for a
ST pullback.) There
will be a
flight to safety in US Treasuries when the bear market in equities kicks
off; foreign investors will need dollars to buy treasuries, which will
also boost the currency's value.

These studies (and others) lead me to conclude that Gold in the next few years will be in a bear market. I also believe we are inches from its peak; a false break above the recent high. The fundamental forces of deflation and an appreciating US dollar will be the main causes of this bear market.