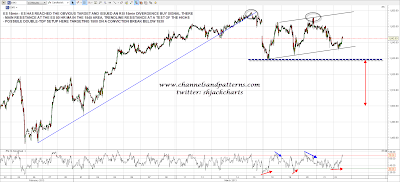
This morning we’re looking at very much the same setup as we were yesterday morning, only we have moved to the other side of the looking glass. Yesterday morning we had an active ES 15min RSI sell signal and were sitting three points above the ES 50 hour MA at 1546, and this morning we have an active ES 15min RSI buy signal, and at the time of writing are sitting 2.5 points below the ES 50 hour MA at 1545. I posted an intraday ES 15min chart on twitter yesterday with a channel support target and you can see that ES reversed there with a slight pinocchio. On a break above the 50 HMA at 1545 the target is channel resistance near the current ES high, and that would now be a strong double-top candidate. If we see short term channel support break then main support is in the 1530 area, and on a break below there the double-top target would be in the 1500 area:
Could ES make it all the way back to 1500? If it did I think it might well make the major support area and possible H&S neckline in the 1485 area, but there is some serious support to get through to make it to 1500 ES. The first support is at the daily middle bollinger band, now at 1537. If that breaks the next support levels on the daily chart are the 50 DMA at 1515 and the lower bollinger band in the 1495 area though by then, as I mentioned, the obvious target would be the 1485 area::
The second important support level is rising channel support from the November low, now in the 1523 area. This is serious support, and a break below would signal that the move up since then has either peaked, or at least that the topping process has started:
CL is still holding the strong support area at 92.3, just, but that’s starting to look like a losing battle. If CL breaks below there on an hourly close basis the next big support level is at 90:
I have been mentioning every day that we might see a significant rally on EURUSD, despite the ongoing confrontation in Cyprus. The reason I’m wondering about that is that the plunge on the Yen has stalled, Sterling is rallying a bit, and a sloppy IHS that I have been watching form on EURUSD is now almost complete. Looking at the DX daily chart the current move towards the double-bottom target just over 84 has been making good progress and has developed a very strong rising support trendline, but there is a lot of negative divergence on the daily RSI. Either we see a sharp move up here to kill that divergence, or the rising support trendline will break and we will see a sharp retracement on USD. Either way it ain’t staying here:
The last chart for today is the copper chart, where after the break of the 18 month symmetrical triangle copper has been moving towards next trendline support at 333. No reason to expect reversal back up here and if 333 breaks the next major support level is at 300. Copper looks depressed here but as it has traded sideways throughout the current cyclical bull market from October 2011, there isn’t much to read into that apart from the obvious observation that you don’t need a lot of copper to print digital money.
Key short term resistance is at the ES 50 HMA at 1545, and if we see ES break over that the next obvious target is at a test of the current highs, for a very possible double-top in that area. The last five ES highs and lows have been signaled on the 15min RSI so I’ll be watching that carefully.


