Slope of Hope Blog Posts
Slope initially began as a blog, so this is where most of the website’s content resides. Here we have tens of thousands of posts dating back over a decade. These are listed in reverse chronological order. Click on any category icon below to see posts tagged with that particular subject, or click on a word in the category cloud on the right side of the screen for more specific choices.
Midlife Vices
I'll be doing a market video later this evening; in the meantime, enjoy this fantastic humor from the late, great Greg Giraldo:
Hedging The Dow At Its All-Time High
The Dow Hits An All-Time High
With the Dow Jones Industrial Average hitting all-time highs recently (albeit, not in inflation-adjusted dollars), in this post, we'll look at the current costs of hedging the Dow component stocks against greater-than-20% drops. We'll also look at the optimal puts1 to hedge a position in the Dow-tracking ETF DIA against the same decline threshold.
Two Reasons To Track Hedging Costs
The first reason to pay attention to hedging costs is if you're considering hedging. But another reason is that we've seen some examples of stocks with high optimal hedging costs underperform those with lower optimal hedging costs. It will be interesting to revisit these Dow component stocks later this year and see if that pattern holds up.
Hedging Costs Of The Dow Components And DIA
The table below shows the costs, as of Tuesday's close, of hedging
each Dow component, and the Dow-tracking ETF (DIA), against
greater-than-20% declines over the next several months, using optimal puts.
|
Symbol |
Name |
Cost of Protection (as % of Position value) |
|
AA |
Alcoa Inc. Common Stock |
3.11%*** |
|
AXP |
American Express |
1.72%*** |
|
BA |
Boeing |
1.30%* |
|
BAC |
Bank of America |
3.20%* |
|
CAT |
Caterpillar |
1.75%* |
|
CSCO |
Cisco Systems |
2.50%* |
|
CVX |
Chevron |
1.37%** |
|
DD |
E.I. du Pont de Nemours |
1.71%*** |
|
DIS |
Walt Disney |
2.55%*** |
|
GE |
General Electric |
1.61%** |
|
HD |
Home Depot |
1.04%* |
|
HPQ |
Hewlett-Packard |
3.19%* |
|
International Business Machines |
1.12%*** |
|
|
INTC |
Intel |
2.14%*** |
|
JNJ |
Johnson & Johnson |
0.68%*** |
|
JPM |
JP Morgan Chase |
1.92%** |
|
KO |
Coca-Cola |
0.65%* |
|
MCD |
McDonald's |
0.65%** |
|
MMM |
3M |
1.14%*** |
|
MRK |
Merck |
1.64%*** |
|
MSFT |
Microsoft |
1.83%*** |
|
PFE |
Pfizer |
1.03%** |
|
PG |
Procter & Gamble |
1.17%*** |
|
T |
AT&T |
1.21%*** |
|
TRV |
Travelers |
1.80%*** |
| UNH | United HealthGroup, Inc. | 2.10%** |
|
UTX |
United Technologies |
1.17%* |
|
VZ |
Verizon Communications |
1.11%*** |
|
WMT |
Wal-Mart Stores |
0.66%** |
|
XOM |
Exxon Mobil |
1.25%*** |
|
DIA |
SPDR Dow Jones Industrial Average ETF |
0.64%** |
*Based on optimal puts expiring in August
**Based on optimal puts expiring in September
***Based on optimal puts expiring in October.
The Optimal Puts To Hedge DIA
These were the optimal puts to hedge 1000 shares of DIA against a greater-than-20% drop as of Tuesday's close.
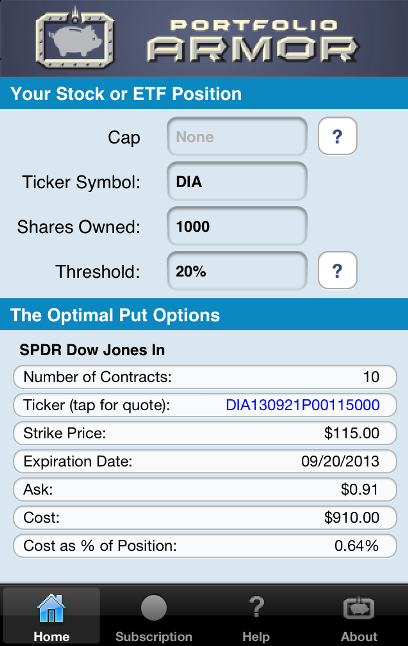
1Optimal puts are the ones that will give you the level of protection you want at the lowest possible cost. Portfolio Armor
uses an algorithm developed by a finance Ph.D to sort through and
analyze all of the available puts for your stocks and ETFs, scanning for
the optimal ones. The screen capture below from the latest build of the soon-to-come 2.0 version of the Portfolio Armor iOS app.
Golden Fibonacci Ratio on EUR/USD (by Strawberry Blonde)
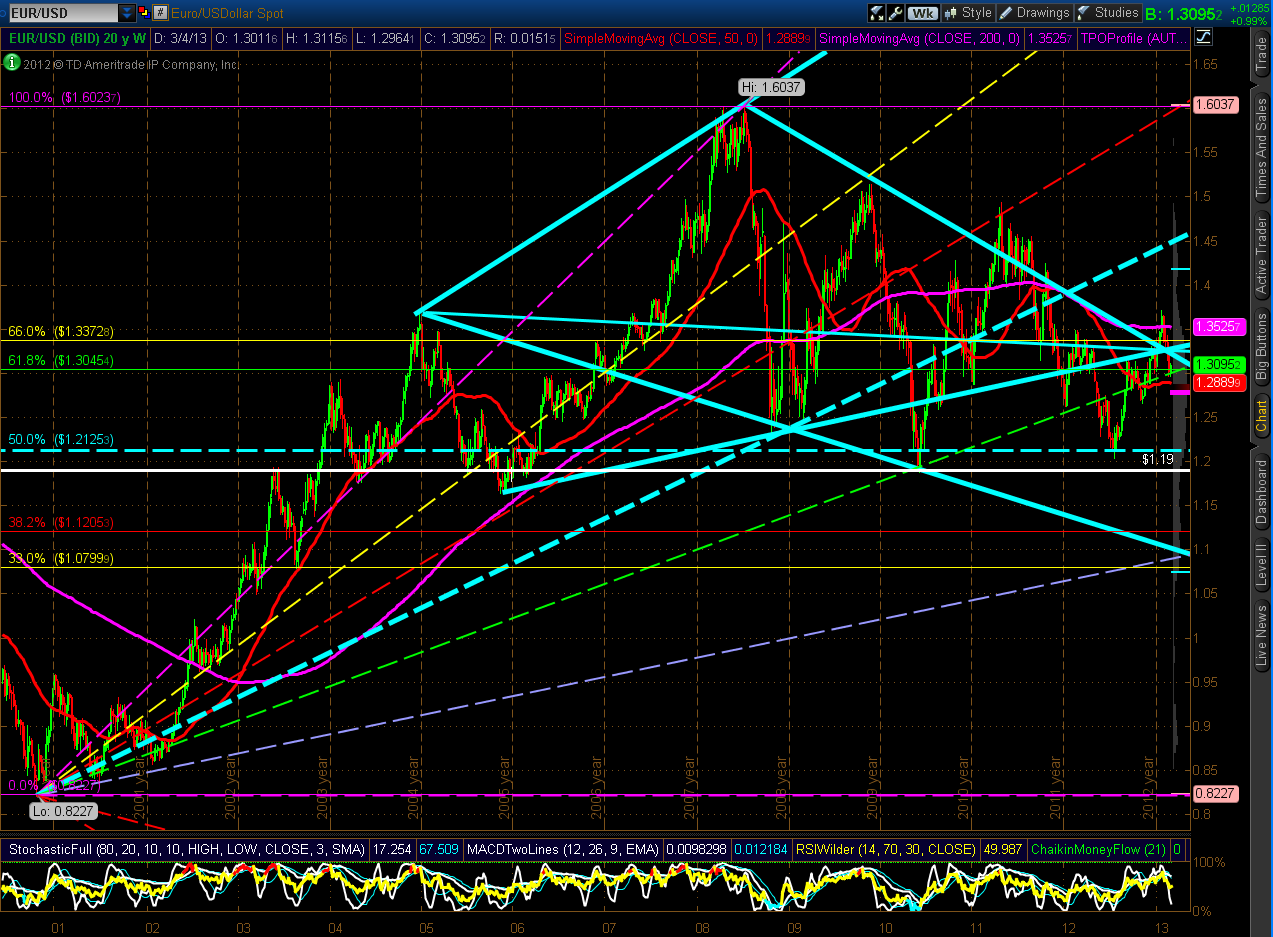
I last wrote about the EUR/USD Forex pair on February 7th. At that time, price was trading around 1.3400.
Since then, price fell and has bounced somewhat…it's now 1.3095 (as of 11:29 am EST on Thursday) and is trading just above a confluence of two Golden Fibonacci Ratios (61.8%), which is near-term support at 1.3045, as shown on the Weekly chart below.
Price is trading in between the 50 sma (red) and 200 sma (pink). These moving averages are in a bearish "Death Cross" formation, and, as such, price is still under its bearish influence. A hold above 1.3045 could send it back up to retest its last swing high…a hold above that level could, finally, propel the EUR/USD higher to, eventually, reverse the moving averages to form a bullish "Golden Cross." This could take some time to play out, however, and we may see further range movement around both moving averages until then….otherwise, a drop and hold below the 50 sma could send price back down to retest the 50% Fibonacci retracement level at 1.2125, or lower.
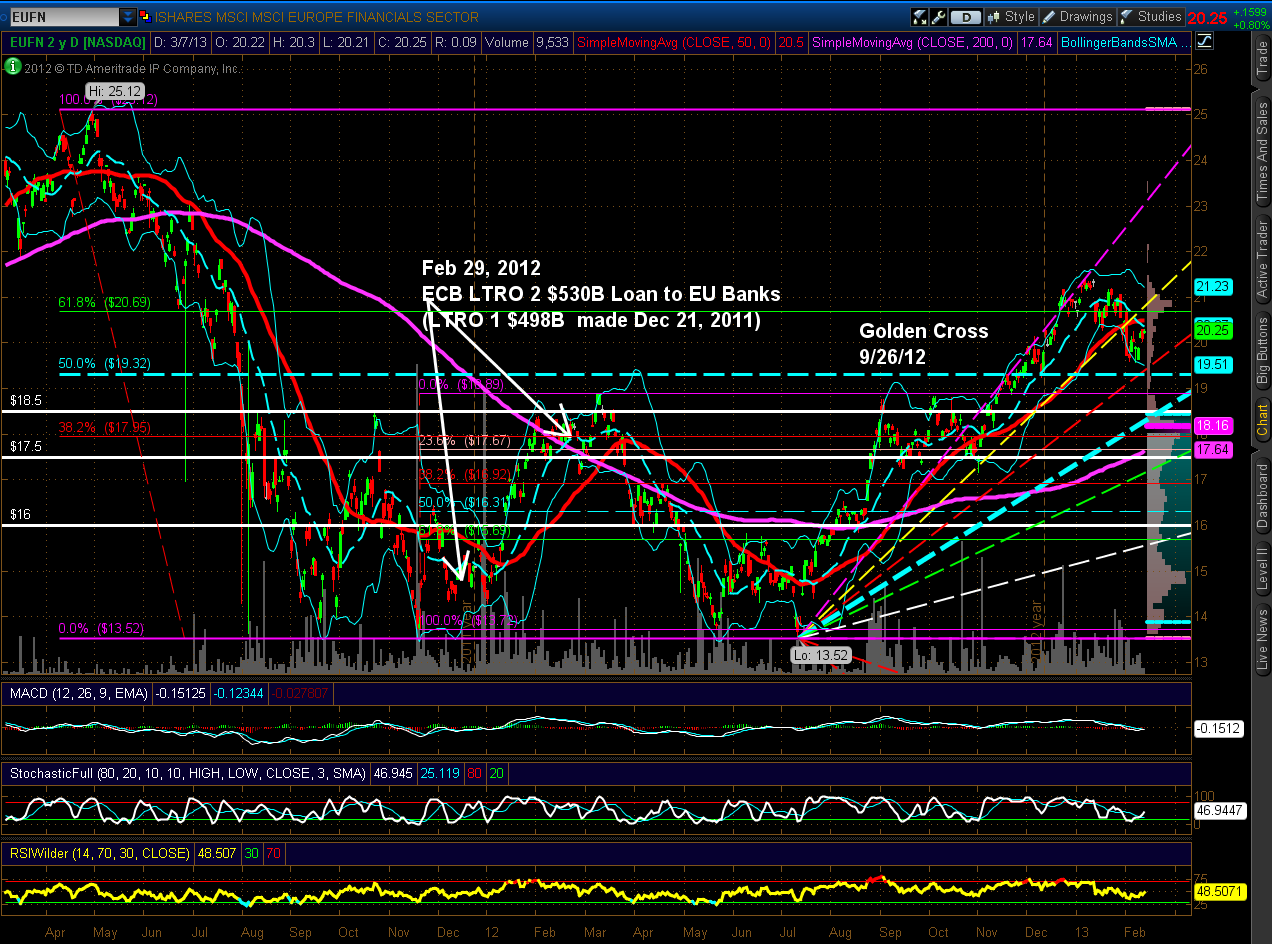
In addition, and as a confirmation to any move on the EUR/USD, I'll be watching the European Financials ETF (EUFN). At the moment, it's in overall uptrend from its July 2012 lows, but has experienced a pullback from its February highs of this year, as shown on the Daily chart below. The Stochastics and RSI indicators have turned up and the MACD looks ready to cross to the upside, as well. A price break and hold above its 61.8% Fibonacci retracement level and 50 sma at 20.69 should produce that MACD crossover to, potentially, propel price higher. Otherwise, a drop below Fibonacci confluence at 19.32 could send price down to its 200 sma at 17.60/50ish, or lower.
Spot the Trend
While somewhat painful (for bears, at least) to observe, the past four years have been, in some sectors, an easy-as-pie, buy-and-hold, any-first-grader-can-do-this bullfest. Look at the consumer staples ETF below. Place a ruler on your screen if you like. It just keeps going up. Steadily. Resolutely. Unfailingly.
I guess I was naive in underestimating how Americans love to buy crap and how they will never stop buying crap. Ever. Because it's what they are good at.
