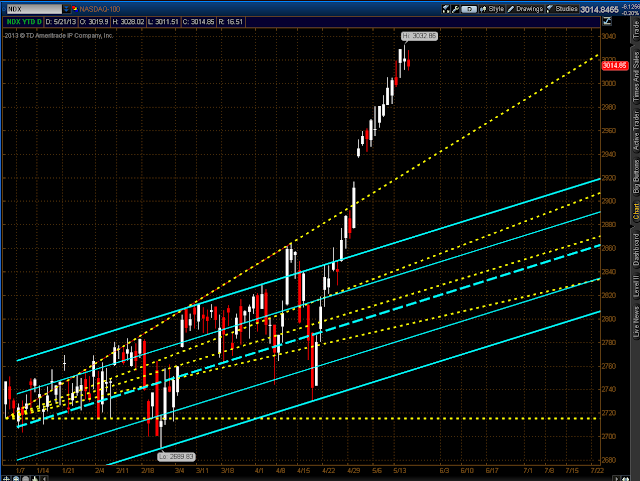
My post of April 26th laid out a scenario for minimum and maximum target objectives to be reached by the Major Indices by the end of Q2, based on a number of assumptions.
The following is an update to report that the minimum target objectives have already been reached in 5 out of the 6 indices (Utilities, which had been on a parabolic rise, pulled back before reaching its minimum target), the maximum target was exceeded in the Nasdaq 100 and the Russell 2000, and the maximum target was nearly reached (within 12 points) on the S&P 500.
This would suggest that these indices have risen at a much faster rate than economic conditions would warrant (my assumptions were based on Q2 GDP mirroring Q1 GDP, thereby causing the indices to perform on a similar trajectory as they did in Q1…however, weakening economic data that we’ve seen, of late, may end up showing a weaker GDP for Q2). As such, a correction (or even a pullback/profit-taking), as I mentioned last week here and here, may be imminent.
The following Year-to-date Daily charts of the Major Indices show market action relative to their respective channels (which were the basis of my projected targets).
The following percentage gained/lost graph of the Major Indices shows how much these indices have gained, so far, for 2013 (as of Monday’s close). Not a bad performance. No doubt, some will be taking profits at these over-extended levels.


