
In the spirit of a picture is worth a thousand words, this post will be a bit chart heavy and light on text.
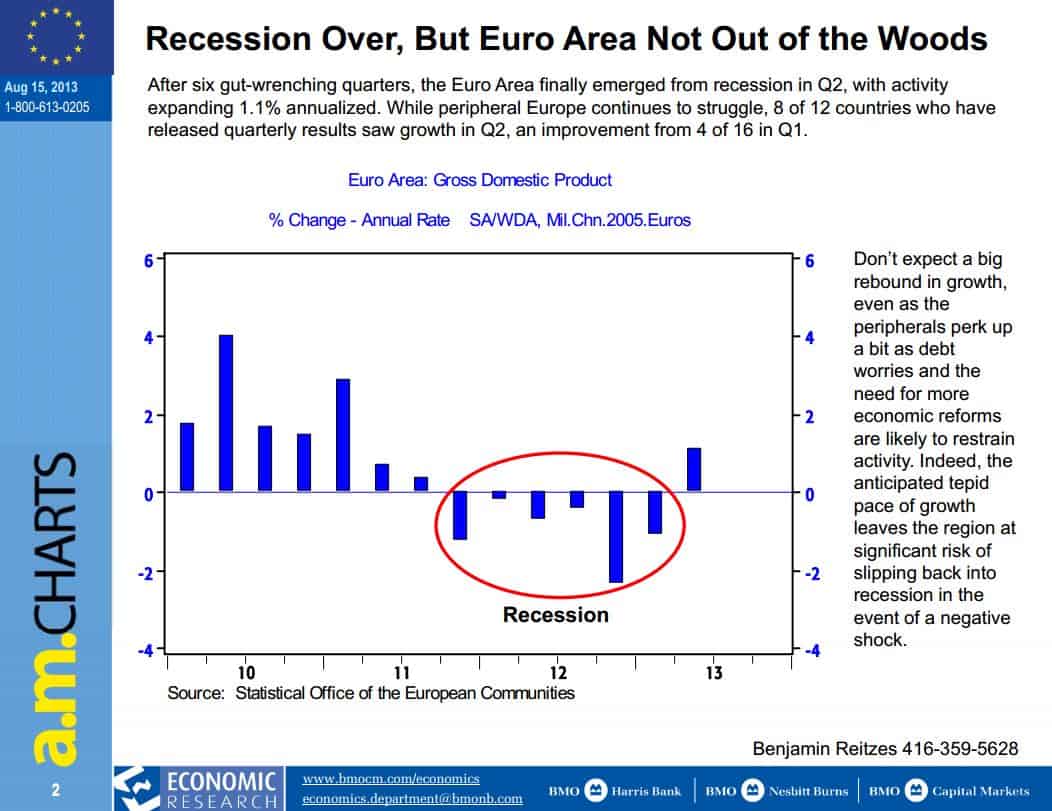
The world is getting better and the situation in Europe is stabilizing. The chart below demonstrates this by showing the Europe has finally emerged from a Recession. Sure, things aren’t spectacular – but they are better.
The markets as we all know have been in a historic bull run from 2009. This run has made investors and traders a bit too complacent in the last year as evidenced by the chart below from Bloomberg. Market corrections occur after periods of complacency but those periods can last for year (see 2004-2007) and by this measure (the P/E-VIX Ratio, the complacency is just now at notably high levels.

For my analysis this week, I want to discuss a bit about Gold (who doesn’t these days?). The World Gold Council is out with their quarterly report and the key findings are below (hint: investment and central banker demand is in decline):
Jewellery: Multi-year high in the jewellery sector as lower prices generated a surge in demand from consumers.
Investment: Record demand for gold bars and coins was countered by sizeable net outflows from ETFs, resulting in a year-on-year decline in overall investment demand relative to Q2 2012.
Technology: Technology sector saw marginal growth, the 1% year-on-year increase the first in two years.
Central Banks: Central banks demand slowed in Q2 2013 from record quarter in year previous, marking tenth consecutive quarter of purchases.
Supply: Total gold supply shrunk 6% from Q2 2012, almost solely due to the reduction in recycling
You can download the report here: http://www.gold.org/download/pub_archive/pdf/GDT_Q2_2013.pdf
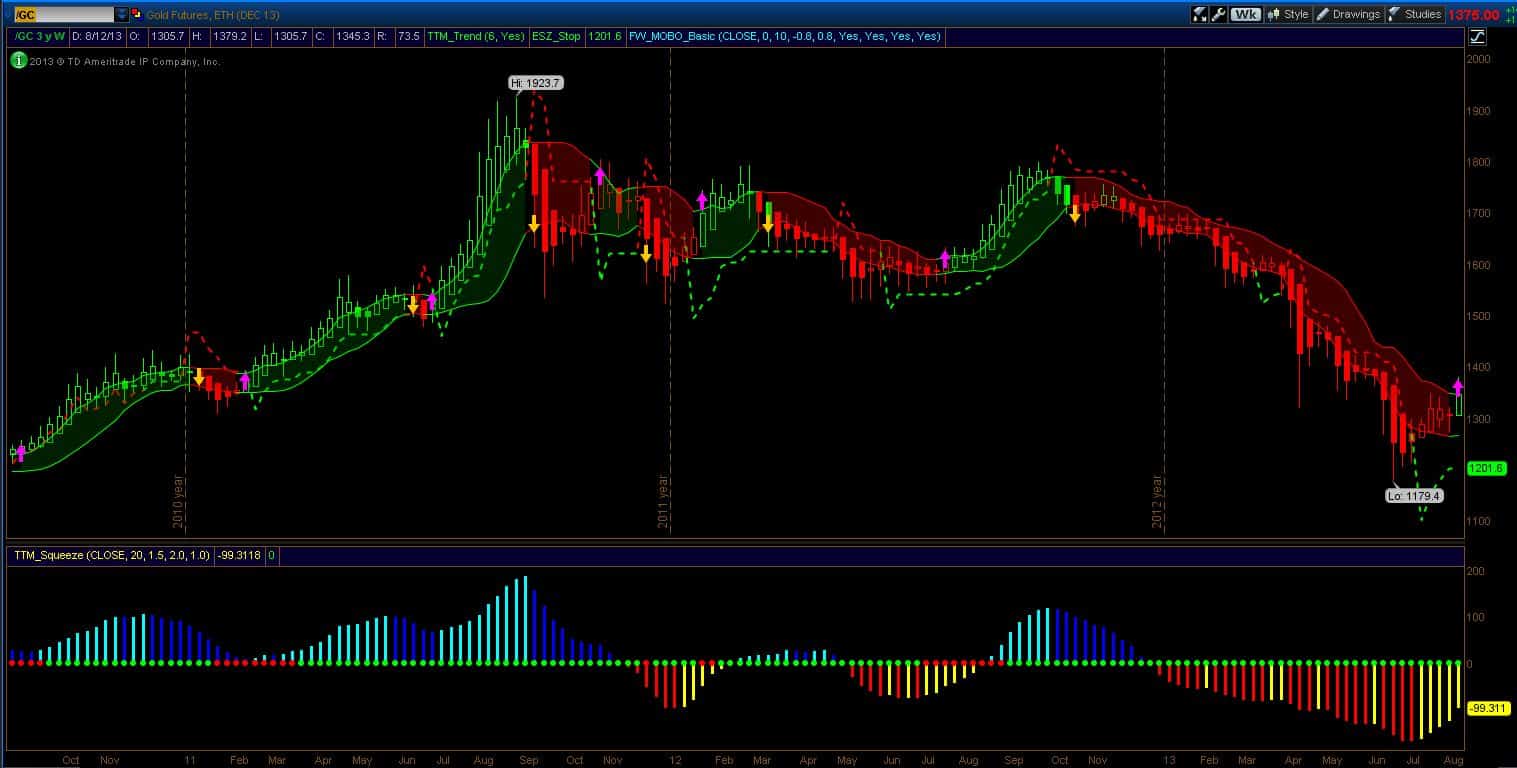
Here is what is important from my charts: We have buy signals on a weekly time frame across the board (Gold and all miners).
Let me reiterate that this is a trend analysis and buy signals means that it is safer to buy here. How you time your entry is an individual choice. But when looking at the charts of GDX or GDXJ, you can see that it is much better to be buying here with an accumulation signal than buying 40 weeks ago when the sell signal was given no? This is the nature of trend analysis. You want to know which way the wind is blowing. There is no way to predict the future and so I have no idea what the gold market will do next. The Monthly charts are still ugly but in all cases, a monthly trend starts first with a weekly trend.
The other part of the analysis that has served well is the calculated statistical stop. I noted a few weeks back, when the short stop was triggered that “GC, GDX and GDXJ are all in bear mode but are presently not shortable anymore”. I then stated in a later that is wasn’t safe to be short and that I was waiting and watching for a buy signal. We also had early warnings with the long stop in place and HA Candles going hollow. I now have the HA Candle chart pattern going green and a momentum breakout. Further, the sell-side momentum has been declining with yellow bars indicating a trend change. Finally, I have been discussing generational opportunities occurring in Gold.
Does all of this make me a gold bull? Hardly – I just follow the charts. I have been bearish for a long time on gold and miners (since I started posting on Slope) but with an eye to when a change may take place. But in the last several weeks I have been preparing to become bullish. For a weekly statistical trader like myself, I will build a position in stages has the weeks go by. Typically after a breakout, we do get some retracement. Managing risk is fairly easy, I know where my stop line is, where the lower statistical channel is. A weekly close below those levels will invalidate my bullish thesis. But knowing these levels, I can choose how much I want to risk at this time and position size accordingly.
The three gold charts are below.


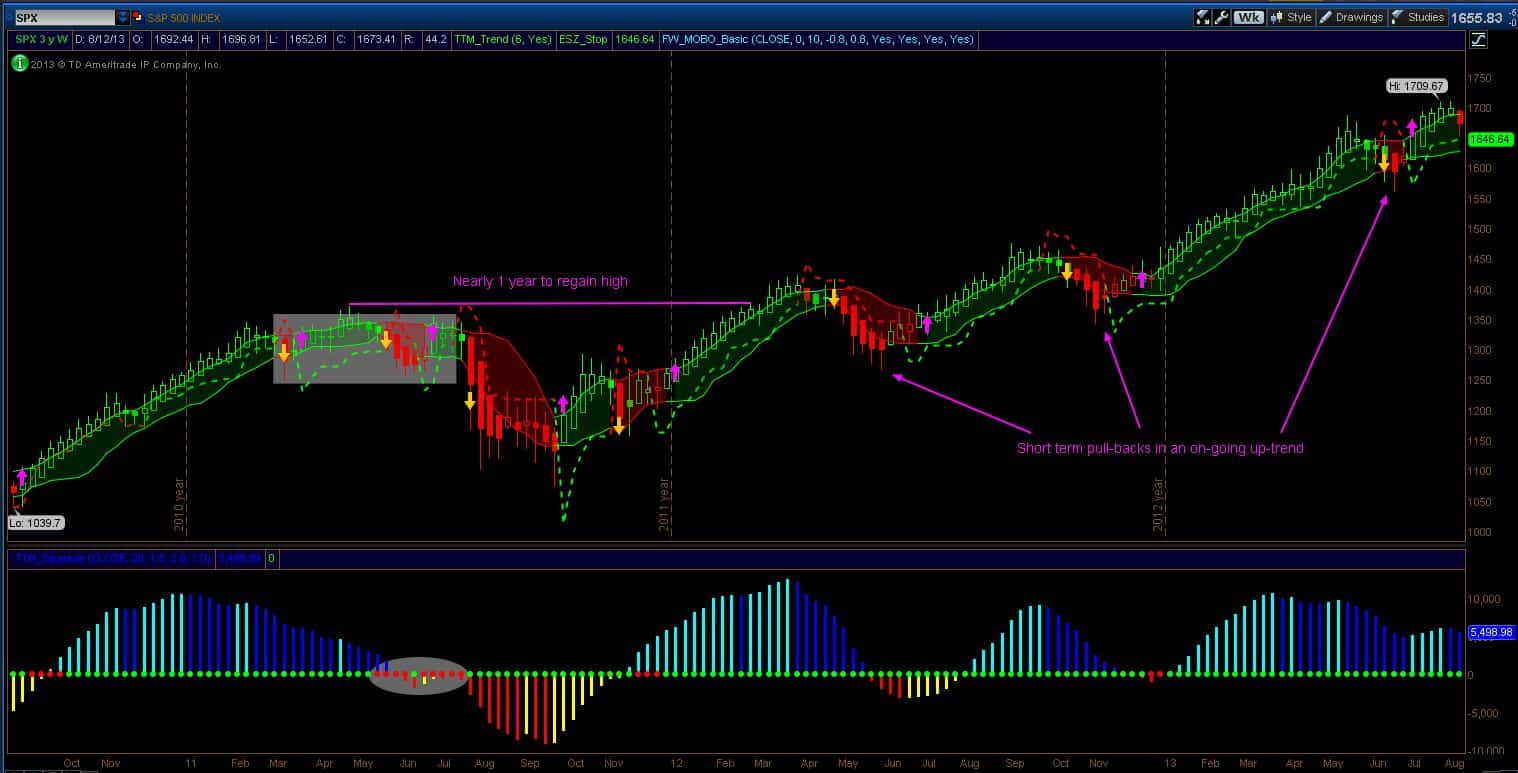
On the SPX weekly chart below, we have an early warning of a possible trend change. The Red filled HA candle and the two dark blue declining momentum bars. You can see on the chart that previous retracements have been shallow and have been buying opportunities. There is now way to know what will happen this time. Seasonality certain suggests caution as September and October are easily the worst two months to be long. You can read about Market and Gold seasonality in my previous post. And speaking of seasonality, it is a bit strange that the Gold market and the broad market would both react according to such a well-known phenomenon. Everyone has been talking about it and even Zerohedge posted a nice chart on gold seasonality to say we are at the start of the August-November move. If only it were that easy.
Good Trading,
-Dr.G
