
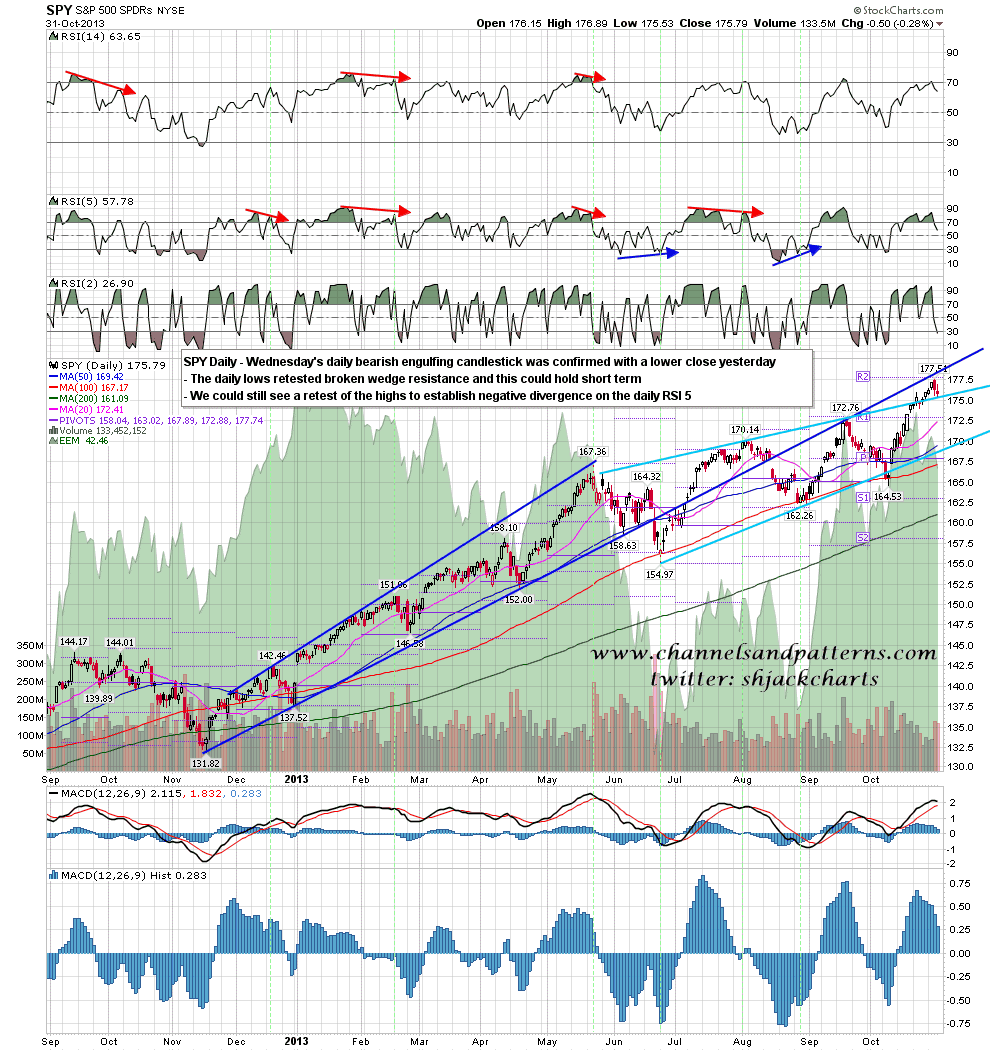
Wednesday’s bearish engulfing daily candlestick confirmed yesterday with a lower intraday low and lower close. I’d have been happier with a more definitive trend day downwards but the last two days have been a decent start on the expected retracement. SPY daily chart:
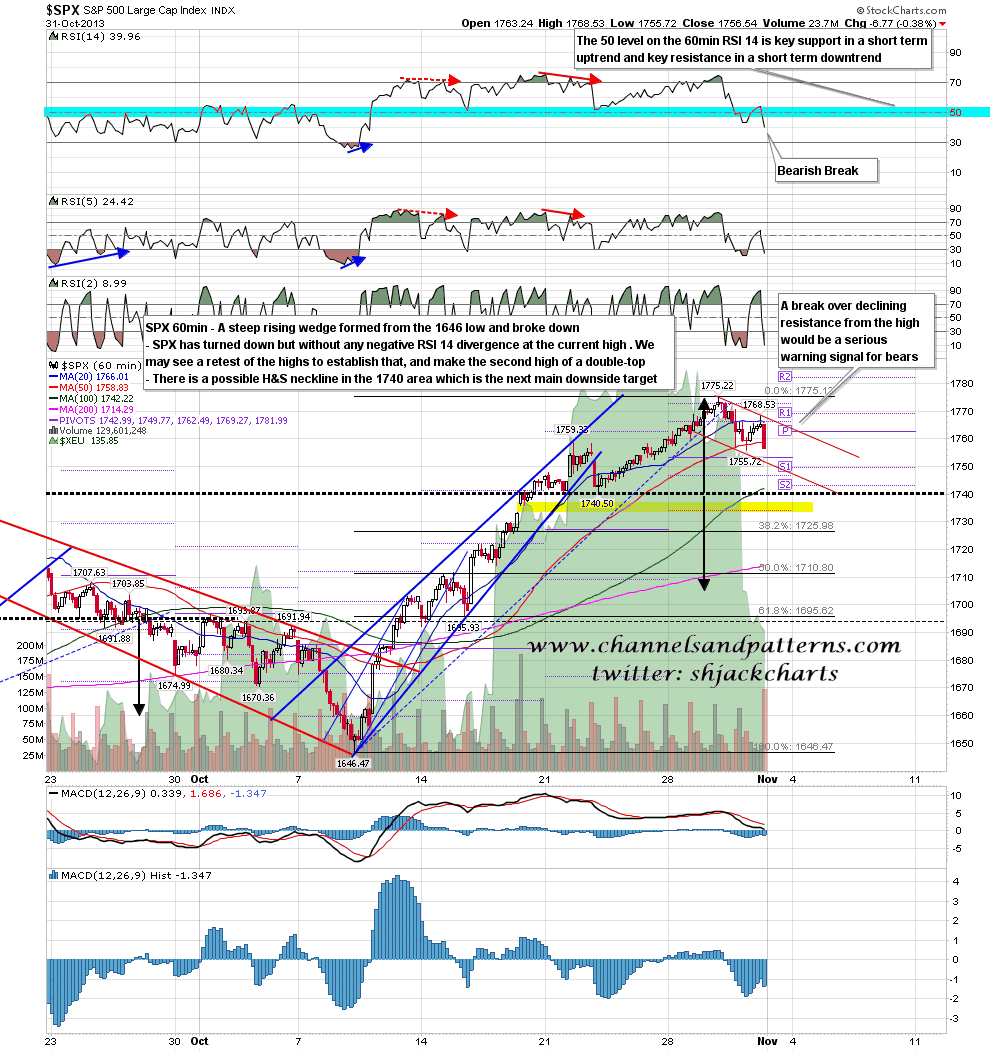
On the SPX 60min chart I have a small rising channel on the path down to test the next big support level at 1740 SPX. A break down from this channel is possible and would be fine, but a break up would be a strong warning signal of a possible retest of the highs. SPX 60min chart:
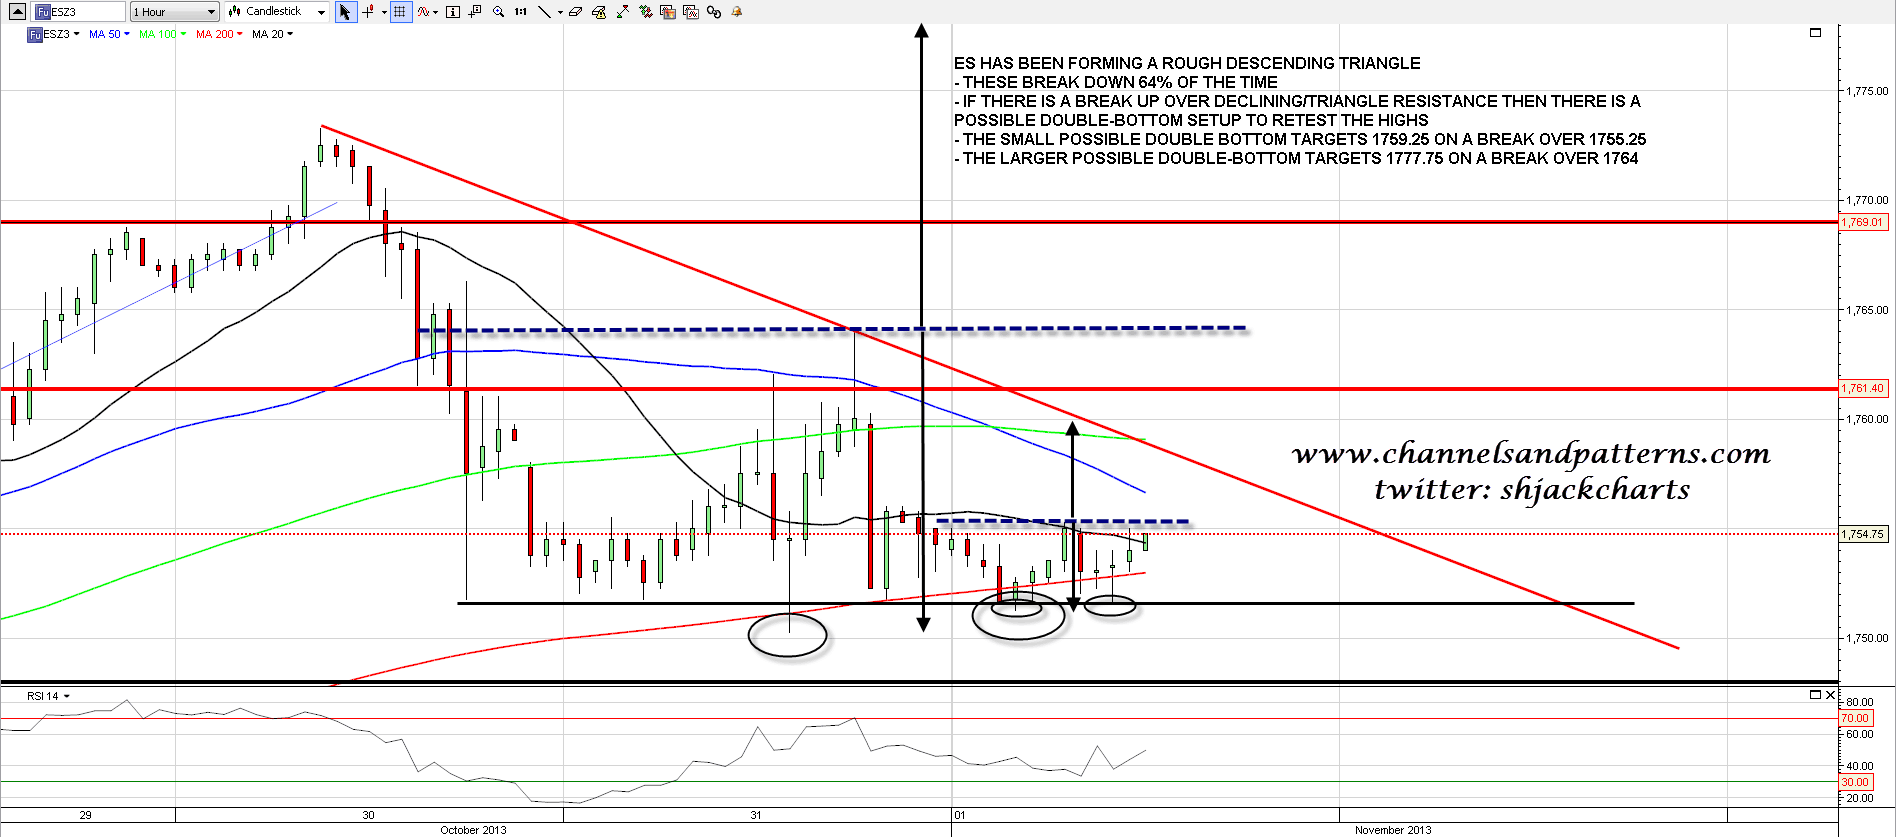
How likely would be a retest of the highs directly from here? Quite a bit less than 50% I think but the setup is there and it could happen. On ES the bears need to see a move below the weekly pivot at 1748 and for that to become resistance. Until we see that move a break over the 50 hour MA (currently at 1756.25), and then declining resistance from the high (currently at 1758.5) would open up a possible move to the weekly R2 pivot at 1769. By that stage I would have a triggered double-bottom target in the 1777.75 ES area, but I wouldn’t expect to see a close over 1769 today. The chart below shows the rough 64% bearish descending triangle forming on ES, and the two possible double-bottom setups that provide a possible path back to retest the highs. ES 60min:
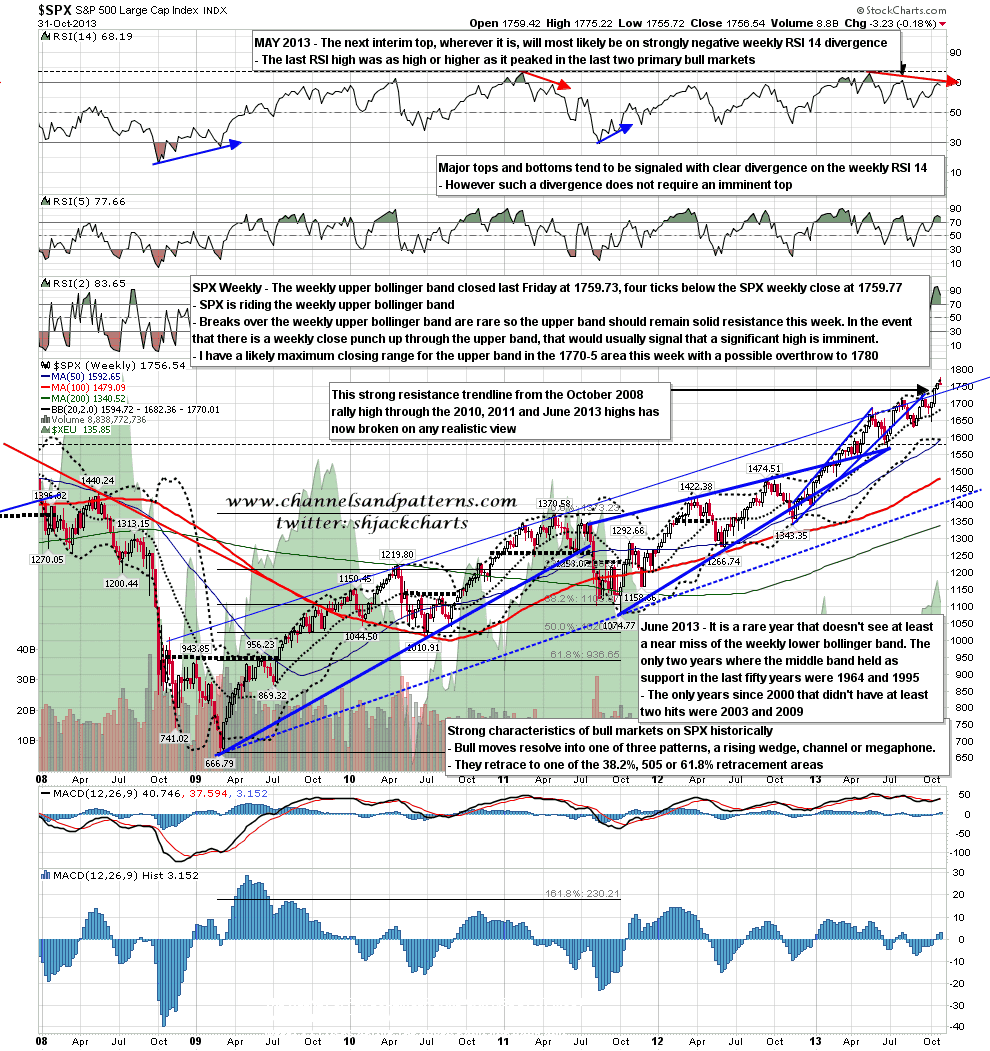
If we see that break up where would I expect to see the close today? Within a couple of points of the weekly upper bollinger band on SPX, currently at 1770.01 but possibly as high as 1774 SPX by EOD. SPX has been riding the weekly upper bollinger band so if the bears drop the ball today, that would be the obvious target. SPX weekly chart:
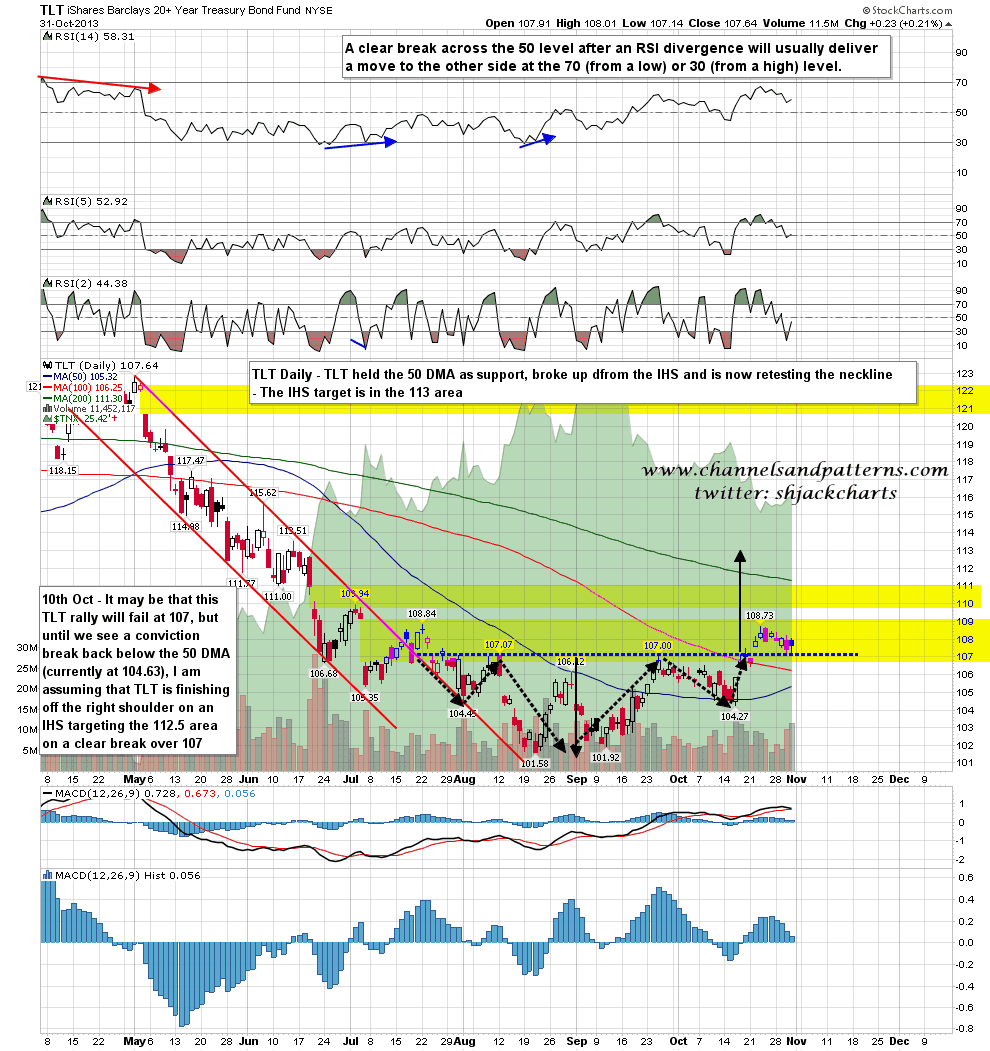
I haven’t posted a bonds chart in a few days, as not much has been happening there, and that’s still the case, but I thought that I would post an updated chart today in any case. The IHS I showed as a possibility three weeks ago and which broke up last week is retesting the IHS neckline. The IHS target is in the 113 area. TLT daily chart:
I’ve spent some time talking about a possible retest of the SPX highs today, but only because it is a possibility that should be borne in mind. The odds favor downside today, and I’m looking for a weekly close below 1748 ES. If ES breaks above the 1758-60 zone however, the obvious closing target today would be in the 1770-5 SPX (approx 1765-9 ES) area that I gave as the bull scenario end of week topping range on Monday morning.
