The level of bear despair yesterday was impressive, and the percentage of bulls is now 62.2%, as compared to previous highs at 61.6% at the end of 2013, 62% in October 2007, 62.9% in December 2000 and 60.8% in August 2007. All of these previous readings were signals that large rallies were ….. um …….. ending, and that significant highs were being made.
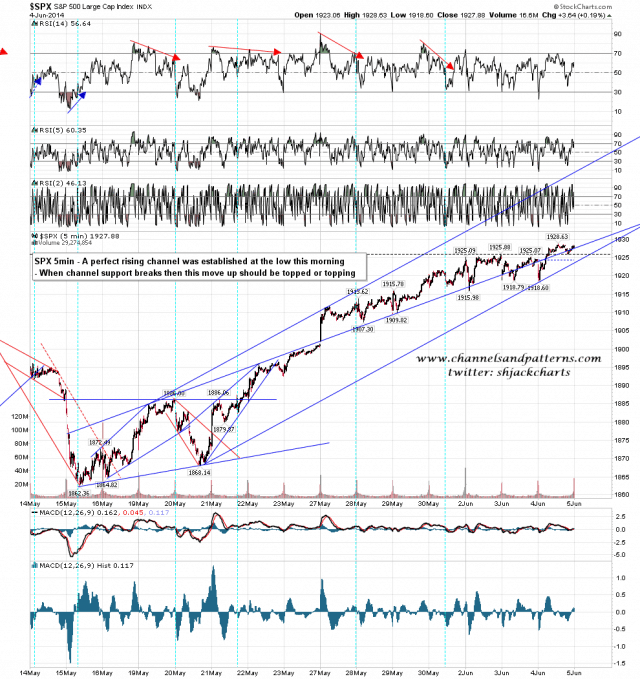
I was delighted yesterday to identify the pattern for the current move, when the low yesterday established a perfect rising channel from the last lows at 1862. This is excellent news as we now have a clear marker for when the current move is ending at the break of channel support there. That break will signal that this move is topped or topping, though a retest of the highs would be routine after such a break, so it would be important not to jump on that break too hard when it happens. SPX 5min chart:
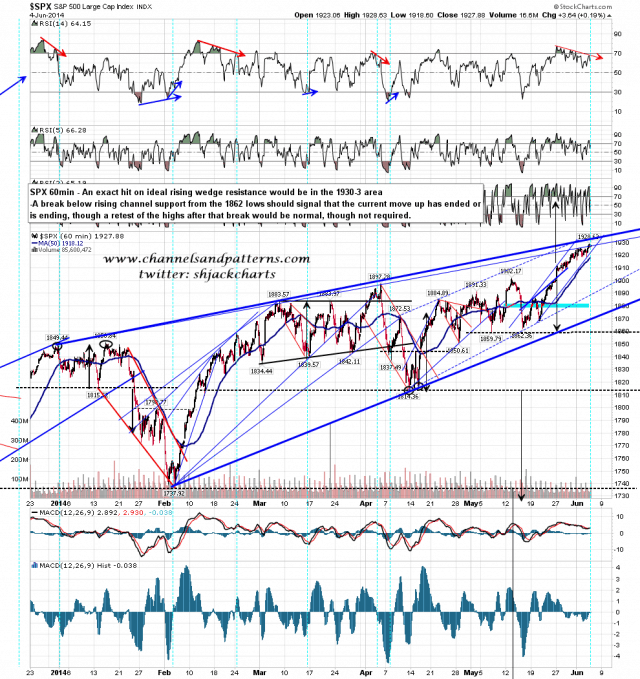
On the 60min chart I’ve moved back to my original and ideal rising wedge upper trendline so I’m looking for a hit of that in the 1930-3 area. I would mention again that the upside target I gave on Wednesday morning last week was 1940, with the suggestion that to get there we might see a bearish overthrow over wedge resistance. That may still be the case. SPX 60min chart:
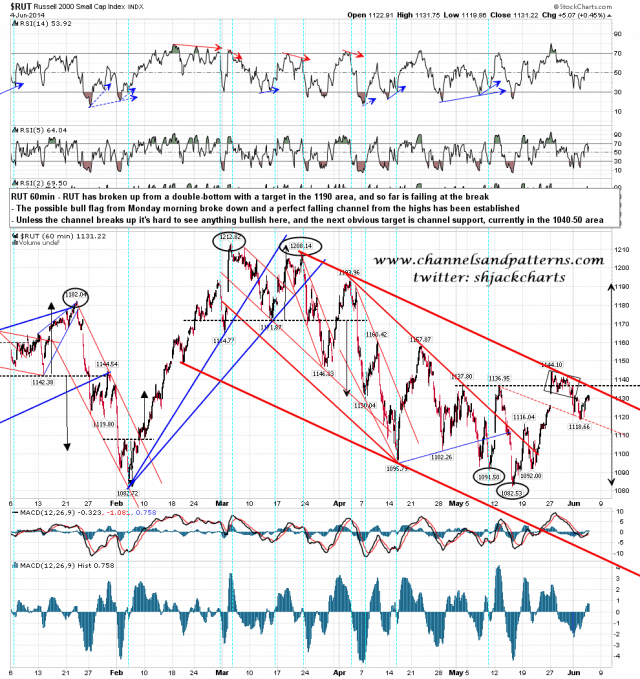
I’m not impressed by all the bear wailing and gnashing of teeth that I’ve been hearing, nor the impressive complacency on the bull side. What would impress me however would be RUT breaking up through falling channel resistance from the March high. That could open up an extension higher so I’ll be watching that carefully to check that RUT remains quietly decomposing in its lofty shallow grave. As long as that channel holds then the upside on US equities looks very limited. RUT 60min chart:
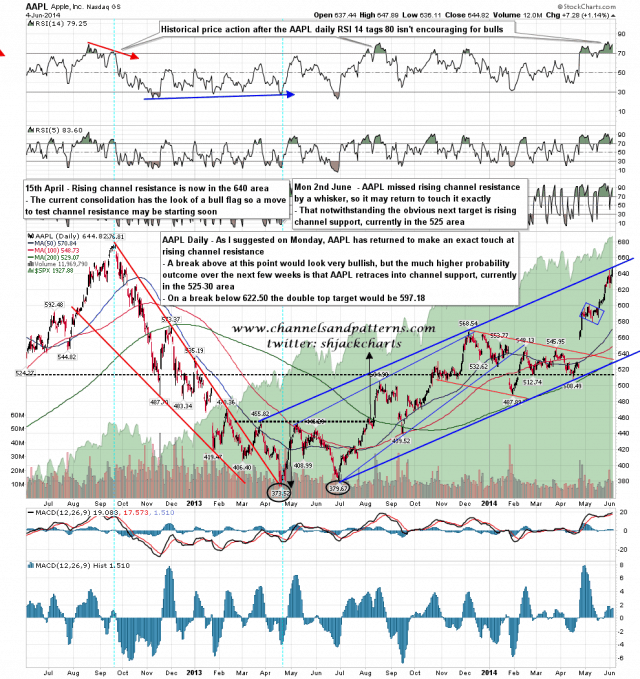
I was saying on Monday that AAPL had narrowly missed hitting rising channel resistance on Friday, and might return for an exact hit. That exact hit was made yesterday and unless we are to see a fairly rare break up from this rising channel then the next obvious target is a test of channel support, currently in the 530 area. In the short term, if yesterday was a short term high, then a break below 622.50 would trigger a double top target at 597.18. AAPL daily chart:
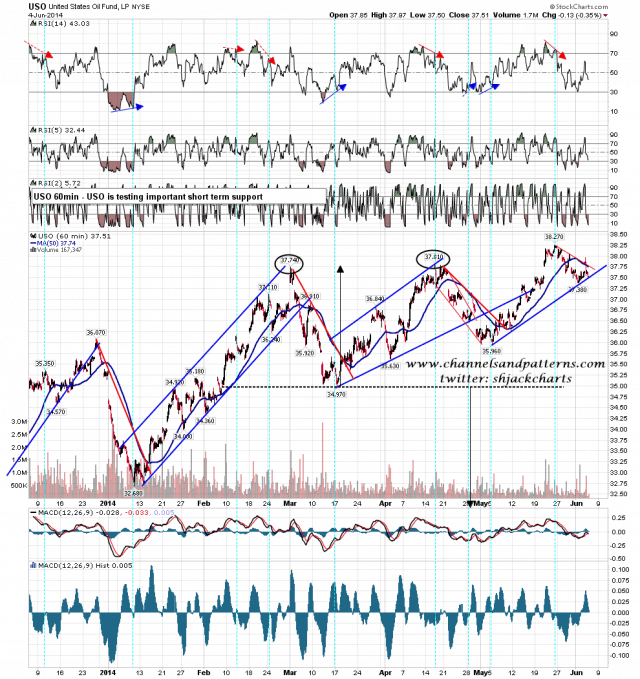
USO is testing important support and, looking at CL overnight, is going to gap below that at the open. If so then USO & CL may drop quite a way further, and we would most likely not see a reversal back up until there was obvious positive divergence on the 60min RSI 14. USO 60min chart:
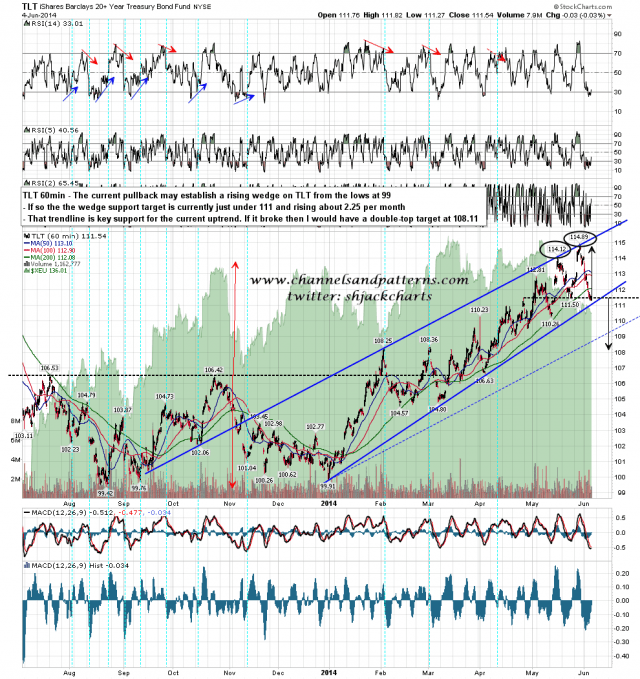
TLT is close to possible rising wedge support in the 111 area. On a break below that I would have a double top target at 108.11. TLT 60min chart:
I remain of the view that we are close to a significant high, and now that I have identified the perfect rising channel from the 1862 area low that should make pinpointing that high much easier.
I have been hearing a lot of talk that TA is now powerless in the face of the Fed and other huge forces pushing this market up. I would say though that hasn’t been my perception over the last few years and would remind people that I called a target at 1965 almost a year ago in a post last June that you can see here. We are now very close to that target, though I don’t believe that could be hit this month.
The overall scenario I was looking at then was a reversal from the 1900s back to retest the 2007 high in the 1580 area, before a reversal back up towards the secular bear market pattern target at 2440 SPX. Will that play out too? Hard to say, as there is some strong support in the 1710-20 area, but I’ve not seen anything so far to suggest that it won’t.


