
I’ve been doing more work on the series of bearish reversal candles over the last twenty years and have combed through 90% or so of the intervening period. I’ll finish that at the weekend and may do a dedicated post on these. The ones I have found so far are:
1999 Feb – From 2nd candle into 5% decline
2002 Dec – From 2nd candle into 17.3% decline
2004 Dec – From 2nd candle into 4.46% decline, then marginal higher high, then 7.56% decline
2005 Oct – From 2nd candle into 2.08% decline
2005 Nov – Failed and resumed uptrend into December interim high
2005 Dec – From 2nd candle into 4.44% decline
2007 Oct – From 3rd candle into 57.4% decline
2014 May – From 2nd candle into 1.66% decline
2014 Sept – From 2nd candle into 1.65% decline, then marginal higher high, then 9.83% decline
2015 May – To be determined
Now the first thing that really springs to the eye here is that only two of these series of two bearish reversal candles made a new high short term, and one of those was the September 2014 series of three. 8 of the 9 resolved down effectively immediately. If we should beat Wednesday’s high at 2134.72 before a decline to at minimum a test of 2099.5 then this time would be a rarity, and that could happen, but the odds are against it, and if seen that would most likely be because of tiny holiday volume. I would note that the SPX high yesterday was 0.44 handles under Wednesday’s new all time high. This setup is highly bearish short term and the median decline from it has been in the 4/5% area.
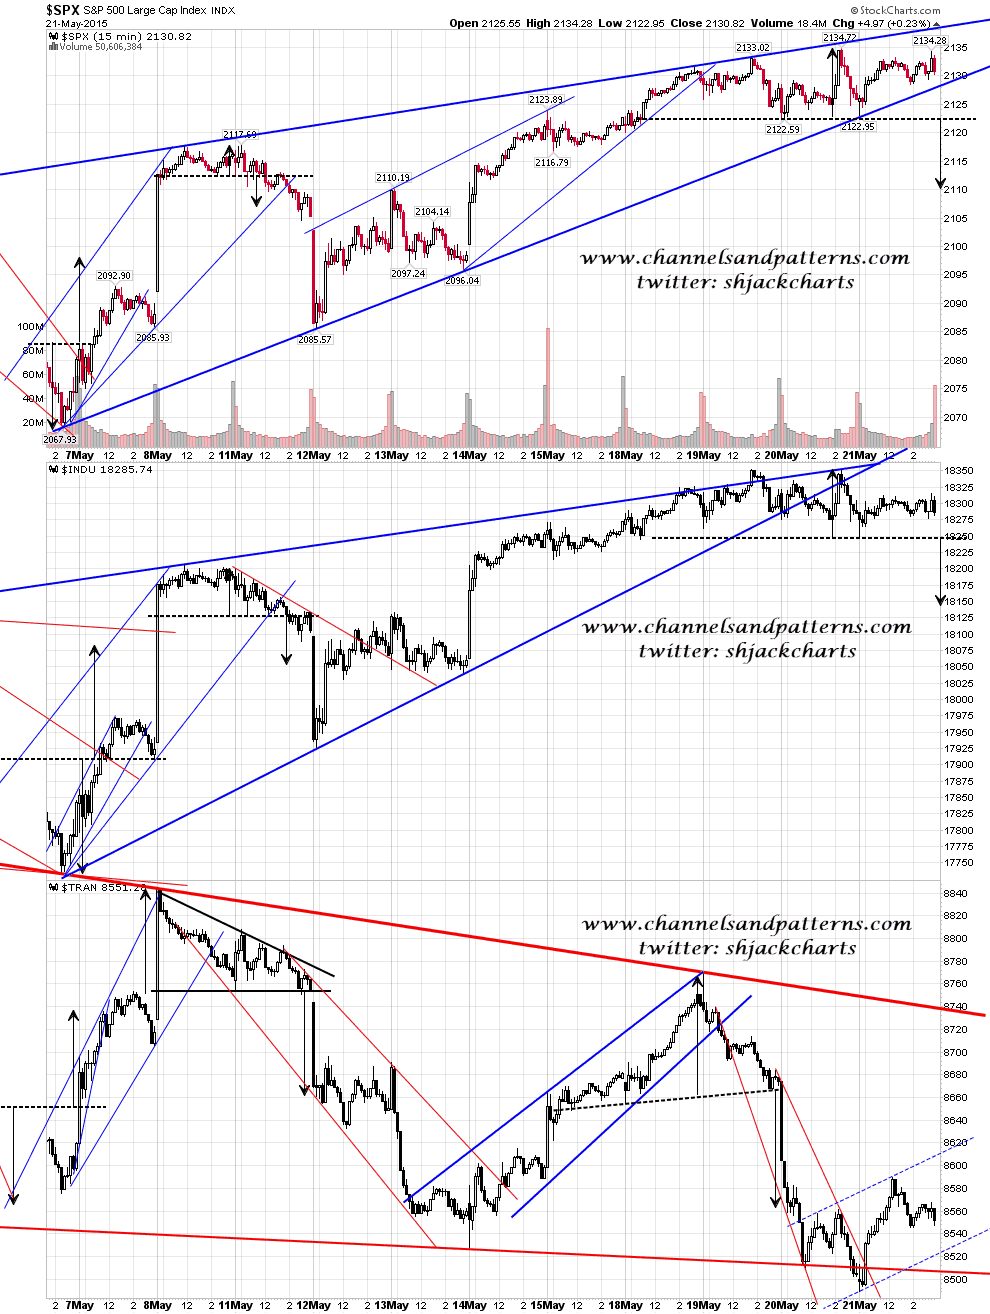
All indices on my optic run list have now broken short term support including SPX, which tested rising wedge support at the open yesterday, and broke wedge support slightly at the open today. A possible double top is in place which would target the 2111 area on a break below 2123. For obvious historical reasons I would be looking for continuation down to at least test the 2100 area. Scan 3x 15min SPX INDU TRAN charts:
Scan 3x 15min NDX RUT NYA charts:

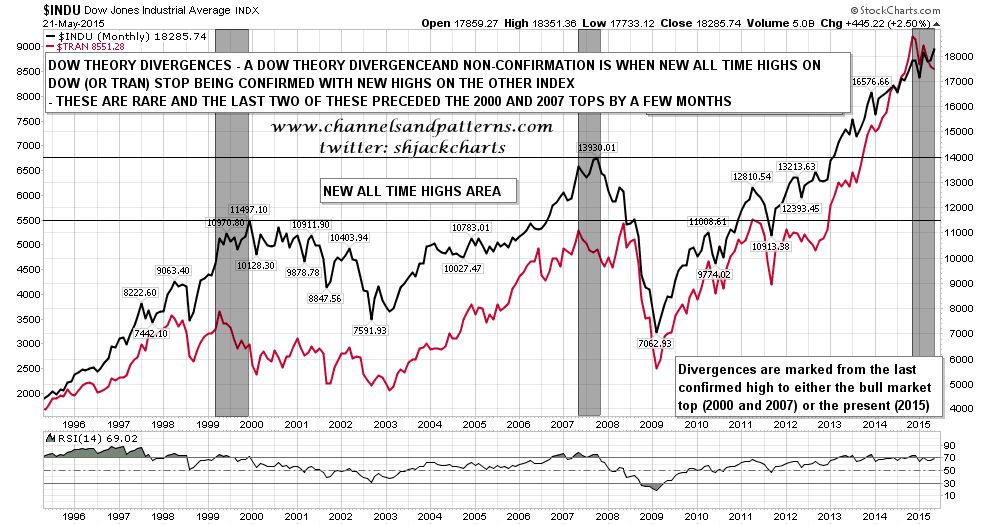
I was asked about Dow Theory non-confirmations yesterday and here is the monthly/20yr chart of Dow and TRAN showing all divergences over that period where a Dow all time high was not confirmed by TRAN. This chart is suggesting a possible major top here but that’s my alternate scenario, with my main scenario just being a 15-20% correction. Only one way to find out for sure though 🙂 Dow Theory Divergences Monthly 20Yr chart:
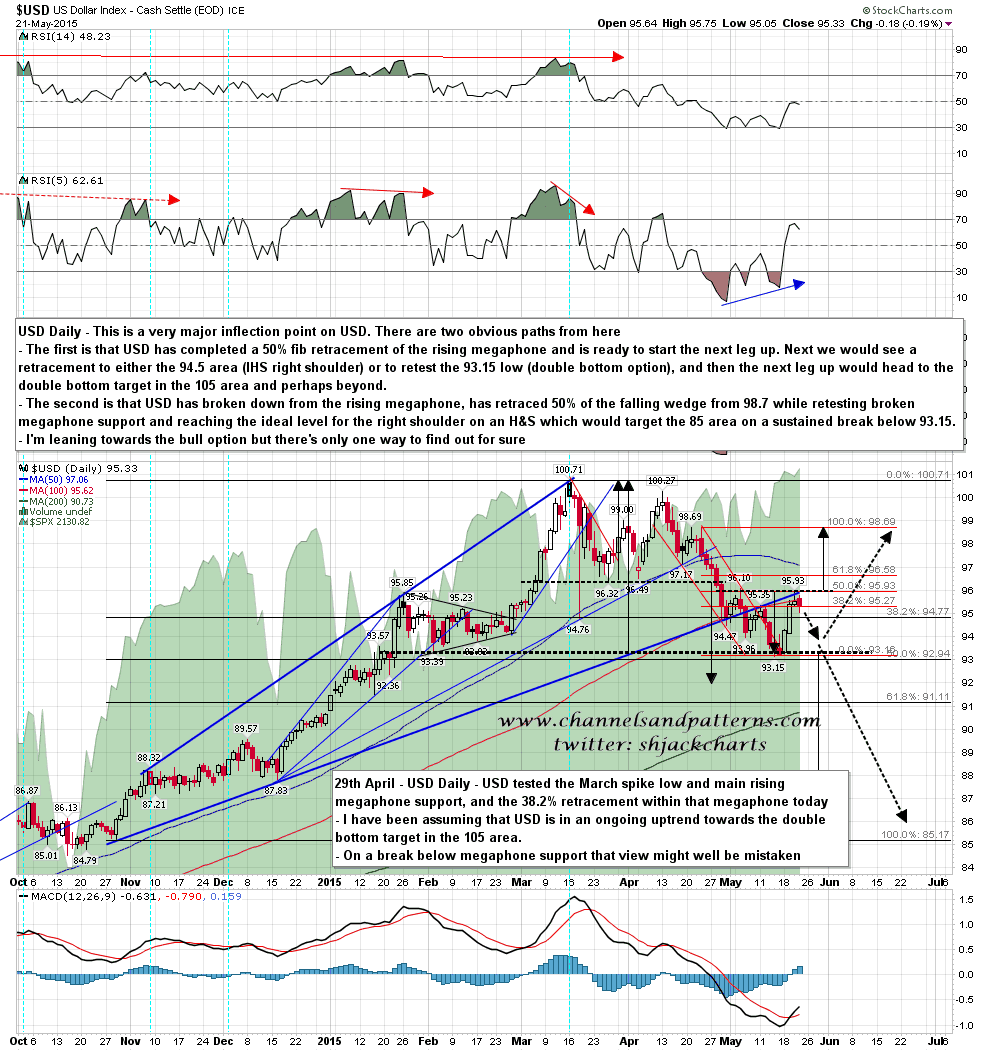
At the risk of USD making the chart below irrelevant by breaking up through 96.1 area resistance with confidence now on the strength of this morning’s inflation numbers, these are the two most likely scenarios in my view if that resistance holds. USD daily chart:
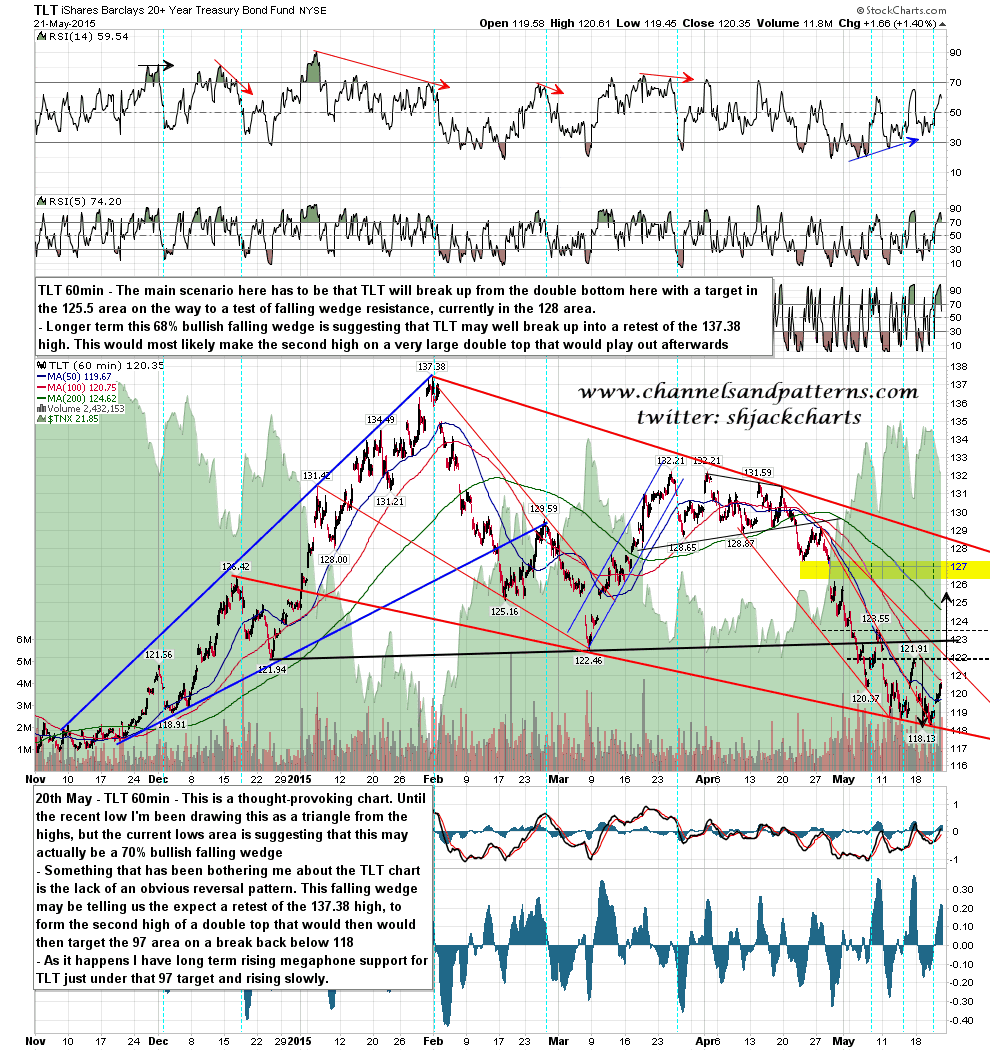
I posted this falling wedge recently calling for a rally on TLT into falling wedge resistance in the 128 area. That looks even more likely with the bottoming action since then. It’s possible that TLT could run all the way back to test the 137 high on the strength of this setup. TLT 60min chart:
I haven’t entirely finished collating these bearish reversal series stats but they are really very bearish. The last time I posted stats this mono-directional was in early Feb 2014 (to a very skeptical audience) and that played out exactly as the stats expected. You can see that post here. We’ll see what happens here, but any new high today is likely to be down to holiday volume. The bearish pattern setups here also lean very bearish short term. Trade safe and watch your risk over the long weekend. 🙂
