As shown on the daily chart of the SPX below, the 50-day MA has, for the most part, held as major support over the past 5 years. Until we see that level breached and held, the bulls will remain, essentially, in control of this market. Although, since the last round of QE stopped at the end of October 2014, this index has spent more time hugging, and circling tightly around, this MA than at any other time during these 5 years…signalling a weakening and, potentially, an end to this bull control.
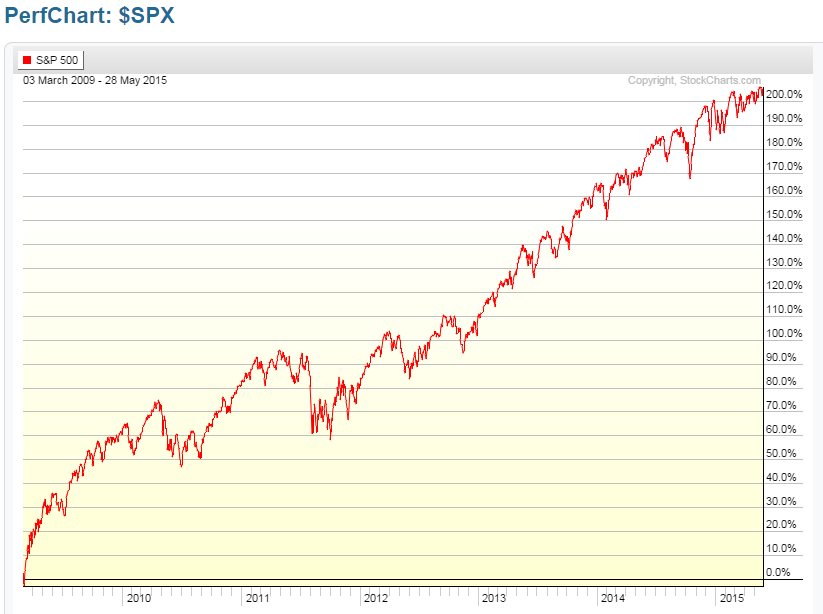
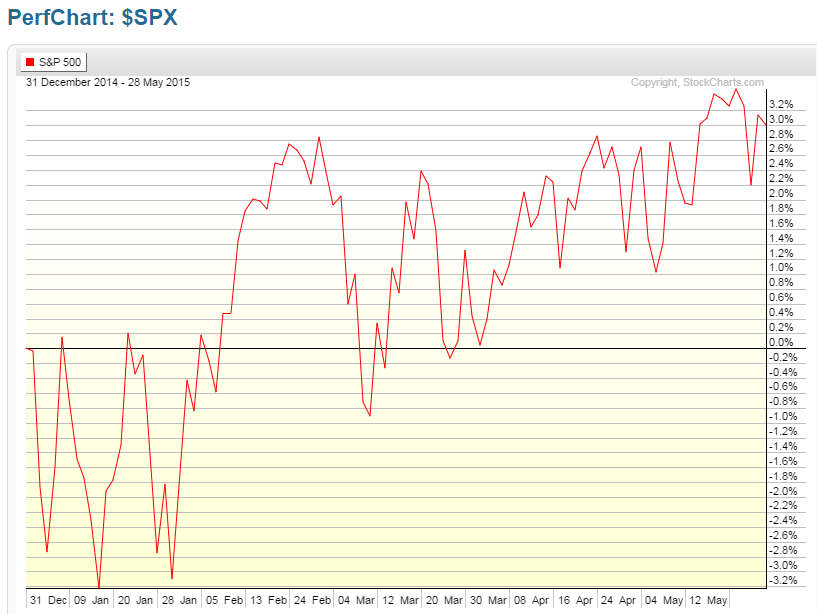
Without the benefit of any further QE from the Fed, buyers will likely be reluctant to commit new money into this market, which is up 204.57% since the closing-low on March 3, 2009, as shown on the percentage-gained graph below. So, while the SPX continues to consolidate, we’ll see the 50 and 200 MAs eventually merge until price, finally, breaks up or down. Once a bearish moving average Death Cross forms, we should see a significant drop in price. Until then, expect more of the same…and, my 2015 outlook for equities may very well come into fruition…at the moment, the SPX is up 3.01% year-to-date, as shown on the last percentage-gained graph…I had forecast an overall price increase of 4% for this year (it reached 3.49% on May 21st…the target high to be surpassed and held if bulls are to remain in control).
So, in a nutshell, I’d keep an eye on the 50 and 200 MAs and their spread (widening or decreasing), and the 4% target-price increase to gauge either weakness or strength for the SPX for the remainder of this year.